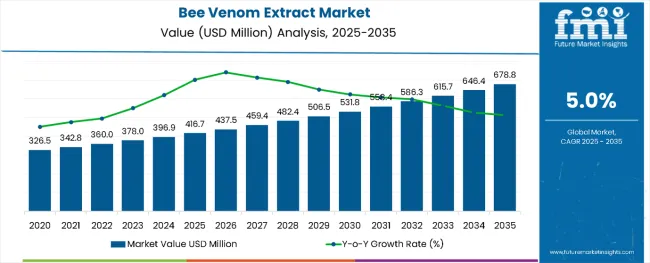
The global bee venom extract market is projected to grow from USD 416.7 million in 2025 to approximately USD 678.8 million by 2035, recording an absolute increase of USD 262.6 million over the forecast period. This translates into a total growth of 63.0%, with the market forecast to expand at a compound annual growth rate (CAGR) of 5.0% between 2025 and 2035. The overall market size is expected to grow by nearly 1.63X during the same period, supported by increasing awareness of bee venom therapeutic properties and growing demand for natural pharmaceutical ingredients.
Bee Venom Extract Market Key Takeaways
| Metric | Value (USD Million) |
|---|---|
| Bee Venom Extract Market (2025) | USD 416.7 Million |
| Bee Venom Extract Market (2035) | USD 678.8 Million |
| CAGR (2025 to 2035) | 5.0% |
Between 2025 and 2030, the bee venom extract market is projected to expand from USD 416.7 million to USD 531.8 million, resulting in a value increase of USD 115.1 million, which represents 43.8% of the total forecast growth for the decade. This phase of growth will be shaped by rising adoption of natural therapeutic compounds in pharmaceutical applications, increasing research and development activities focused on bee venom bioactive compounds, and growing consumer preference for alternative medicine solutions. Manufacturers are expanding their extraction capabilities to address the growing demand for high-quality bee venom products across various therapeutic applications.
From 2030 to 2035, the market is forecast to grow from USD 531.8 million to USD 678.8 million, adding another USD 147.5 million, which constitutes 56.2% of the overall ten-year expansion. This period is expected to be characterized by expansion of bee venom applications in cosmetic formulations, integration of advanced extraction technologies, and development of standardized quality control protocols across different product categories. The growing adoption of bee venom in pain management and anti-inflammatory treatments will drive demand for more sophisticated extraction methods and specialized processing capabilities.
Between 2020 and 2025, the bee venom extract market experienced steady expansion, driven by increasing recognition of bee venom therapeutic benefits and growing research supporting its medical applications. The market developed as pharmaceutical companies and cosmetic manufacturers recognized the potential of bee venom compounds for various health and beauty applications. Healthcare practitioners and alternative medicine providers began emphasizing bee venom therapy for arthritis, joint pain, and inflammatory conditions.
Market expansion is being supported by the increasing recognition of bee venom therapeutic properties and the corresponding need for natural pharmaceutical ingredients in drug formulation and therapeutic applications. Modern healthcare systems rely on bioactive compounds found in bee venom for developing treatments for various conditions including arthritis, inflammation, and neurological disorders. Even minor therapeutic applications require comprehensive quality control and standardization to maintain optimal product efficacy and patient safety.
The growing interest in natural medicine and increasing research into bee venom bioactive compounds are driving demand for high-quality bee venom extracts from certified suppliers with appropriate extraction methods and expertise. Healthcare providers are increasingly incorporating bee venom therapy into treatment protocols following clinical evidence demonstrating therapeutic benefits. Regulatory approvals and pharmaceutical industry standards are establishing standardized extraction procedures that require specialized equipment and trained technicians.
The market is segmented by type, application, and region. By type, the market is divided into liquid and powder forms. Based on application, the market is categorized into pharmaceutical and cosmetic & personal care segments. Regionally, the market is divided into North America, Europe, Asia Pacific, Latin America, and Middle East & Africa.
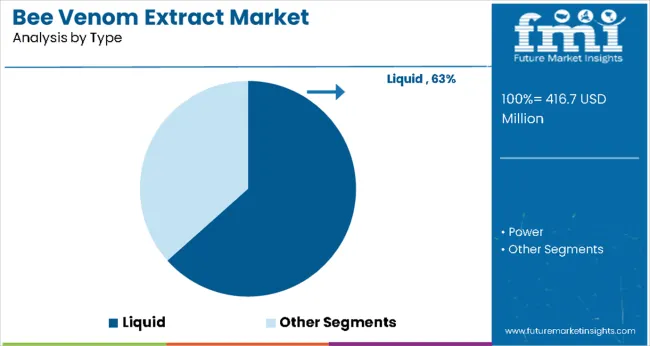
The liquid segment is projected to account for 63% of the bee venom extract market in 2025. This leading share is supported by the widespread preference for liquid bee venom extracts in pharmaceutical applications, which represent the majority of current therapeutic formulations. Liquid extracts provide better bioavailability and easier integration into various pharmaceutical preparations, making them the preferred form for most therapeutic applications. The segment benefits from established extraction procedures and comprehensive processing capabilities from multiple suppliers. Liquid bee venom demonstrates superior solubility characteristics, enabling more effective delivery of bioactive compounds like melittin and apamin in topical formulations and injectables.
The form's versatility allows seamless incorporation into serums, creams, and injectable solutions, supporting its dominant market position. Additionally, liquid extracts offer enhanced quality control mechanisms during manufacturing, ensuring consistent potency and therapeutic efficacy across production batches. The segment also benefits from established cold-chain distribution networks that maintain product integrity during transportation. Furthermore, liquid formulations enable precise dosing mechanisms crucial for clinical applications, particularly in bee venom therapy and acupuncture treatments where exact concentration control is essential for patient safety.
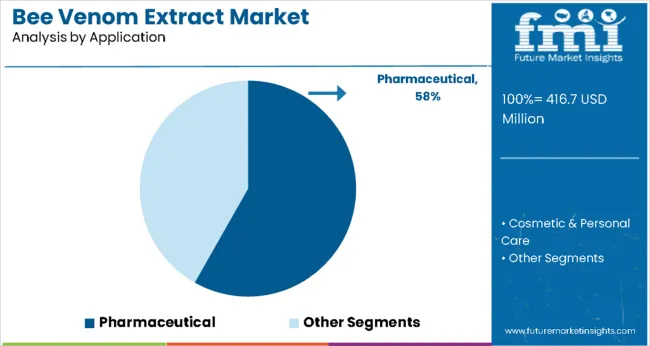
Pharmaceutical applications are expected to represent 58% of bee venom extract demand in 2025. This dominant share reflects the high therapeutic potential of bee venom compounds in pharmaceutical formulations and the large population of patients requiring alternative treatment options. Modern pharmaceutical applications increasingly feature bee venom extracts in pain management, anti-inflammatory treatments, and neurological disorder therapies. The segment benefits from growing clinical research supporting bee venom therapeutic efficacy and increasing regulatory approvals for bee venom-based pharmaceutical products.
The pharmaceutical sector leverages bee venom's proven anti-inflammatory, analgesic, and neuroprotective properties for treating conditions including arthritis, multiple sclerosis, and Parkinson's disease. Clinical studies demonstrate significant efficacy in cancer treatment applications, where melittin shows promising cytotoxic effects against various tumor types including breast, cervical, and hepatocellular carcinoma. The segment's growth is further supported by expanding research into combination therapies, where bee venom enhances chemotherapy effectiveness while reducing drug resistance, positioning it as a valuable adjuvant treatment in oncology protocols.
The bee venom extract market is advancing steadily due to increasing therapeutic applications and growing recognition of natural medicine importance. However, the market faces challenges including limited bee venom supply, seasonal availability constraints, and varying extraction quality across different suppliers. Standardization efforts and quality certification programs continue to influence product quality and market development patterns.
Expansion of Therapeutic Application Areas
The growing deployment of bee venom extracts in various therapeutic applications is enabling treatment of diverse medical conditions including arthritis, multiple sclerosis, and chronic pain disorders. Advanced formulations incorporating bee venom compounds provide targeted therapeutic benefits while reducing side effects associated with conventional treatments. These applications are particularly valuable for patients seeking natural alternatives to synthetic pharmaceuticals and healthcare providers focusing on integrative medicine approaches.
Integration of Advanced Extraction and Processing Technologies
Modern bee venom extract producers are incorporating advanced extraction technologies and automated processing systems that improve product purity and reduce processing time. Integration of quality control systems and standardized extraction protocols enables more consistent product quality and comprehensive documentation. Advanced processing equipment also supports extraction of specific bee venom compounds including melittin, phospholipase A2, and other bioactive peptides.
Write-up
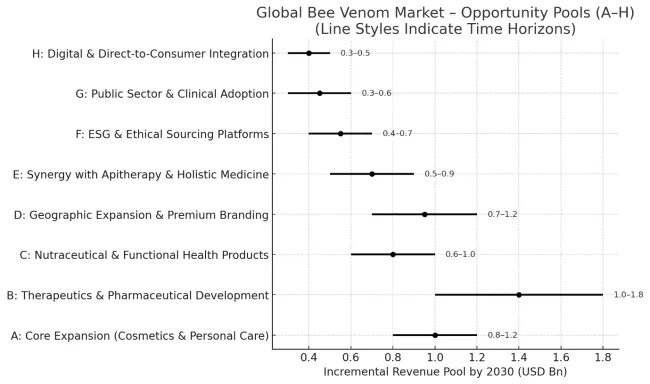
The bee venom extract market is still niche but rapidly gaining traction as natural products and functional bioactives rise in demand. Over the next decade, it could unlock USD ≈ 4.6-7.9 billion in incremental revenue by ~2035. Growth is driven by the convergence of premium cosmetics, holistic medicine, and novel therapeutic applications.
| Countries | CAGR (2025 to 2035) |
|---|---|
| India | 5.7% |
| China | 5.5% |
| United States | 4.8% |
| United Kingdom | 4.6% |
| France | 4.4% |
| South Korea | 4.2% |
| Germany | 3.9% |
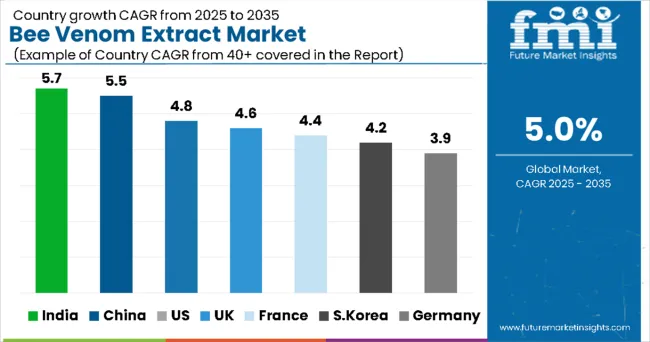
The bee venom extract market is growing rapidly across key regions, with India leading at a 5.7% CAGR through 2035, driven by traditional medicine practices, growing pharmaceutical research, and increasing awareness of natural therapeutic alternatives. China follows at 5.5%, supported by expanding healthcare infrastructure and government initiatives promoting traditional medicine integration with modern healthcare systems. The United States records 4.8% growth, emphasizing regulatory compliance, quality standardization, and research-backed therapeutic applications. The United Kingdom shows 4.6% expansion, focusing on natural medicine integration and pharmaceutical innovation. France demonstrates 4.4% growth through advanced research capabilities and consumer acceptance, while South Korea achieves 4.2% through biotechnology advancement and alternative medicine adoption. Germany records 3.9% growth with emphasis on quality standards and pharmaceutical manufacturing excellence.
The report covers an in-depth analysis of 40+ countries; seven top-performing countries are highlighted below.
Revenue from bee venom extract in India is projected to exhibit the highest growth rate with a CAGR of 5.7% through 2035, driven by traditional Ayurvedic medicine practices and increasing integration of natural therapeutic compounds in modern healthcare systems. The country's expanding pharmaceutical industry and growing research activities focused on natural medicine applications are creating significant demand for bee venom extracts. Major pharmaceutical companies and traditional medicine practitioners are establishing comprehensive supply chains to support the growing population seeking alternative therapeutic solutions across urban and rural markets.
Revenue from bee venom extract in China is expanding at a CAGR of 5.5%, supported by increasing healthcare infrastructure development and growing integration of traditional Chinese medicine with modern therapeutic applications. The country's expanding pharmaceutical manufacturing capabilities and increasing investment in natural medicine research are driving demand for high-quality bee venom extracts. Authorized pharmaceutical manufacturers and traditional medicine institutions are gradually establishing capabilities to serve the growing population seeking natural therapeutic alternatives.
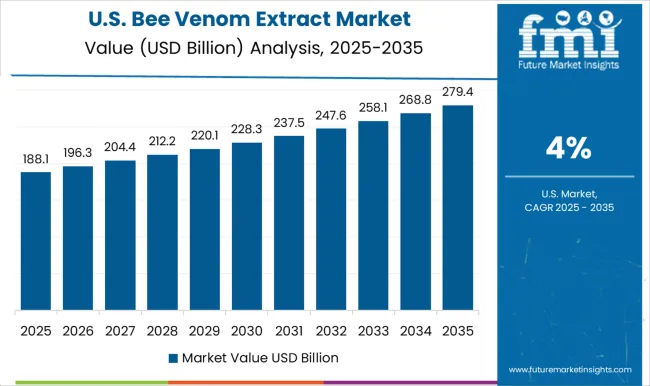
Revenue from bee venom extract in the United States is growing at a CAGR of 4.8%, driven by increasing alternative medicine adoption and growing regulatory framework development for natural therapeutic products. The country's established pharmaceutical industry is gradually integrating bee venom extracts into therapeutic applications while maintaining strict quality control standards. Healthcare providers and pharmaceutical companies are investing in bee venom research and product development to address growing market demand for natural therapeutic alternatives.
Demand for bee venom extract in the United Kingdom is projected to grow at a CAGR of 4.6%, supported by the country's emphasis on natural medicine integration and pharmaceutical research innovation. British pharmaceutical companies and research institutions are implementing comprehensive bee venom extract applications that meet stringent regulatory standards and therapeutic efficacy requirements. The market is characterized by focus on scientific validation, advanced quality control, and compliance with comprehensive pharmaceutical safety regulations.
Demand for bee venom extract in France is expanding at a CAGR of 4.4%, driven by increasing pharmaceutical research capabilities and growing consumer acceptance of natural therapeutic alternatives. French pharmaceutical companies and research institutions are establishing comprehensive bee venom extract applications to serve diverse therapeutic needs. The market benefits from government support for natural medicine research and consumer preference for alternative therapeutic options following clinical evidence supporting bee venom efficacy.
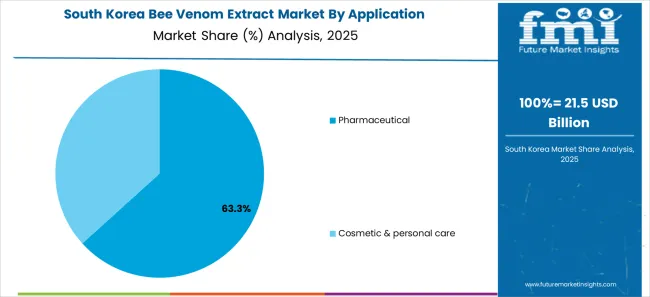
Revenue from bee venom extract in South Korea is expanding at a CAGR of 4.2%, supported by increasing biotechnology advancement and growing alternative medicine adoption in healthcare systems. Korean pharmaceutical companies and biotechnology firms are establishing comprehensive bee venom extract processing capabilities to serve domestic and international markets. The country's emphasis on technological innovation and quality control is driving development of advanced extraction methods and therapeutic applications.
Demand for bee venom extract in Germany is projected to grow at a CAGR of 3.9%, driven by the country's emphasis on pharmaceutical manufacturing excellence and stringent quality control standards. German pharmaceutical companies are implementing comprehensive bee venom extract applications that meet rigorous regulatory requirements and therapeutic efficacy standards. The market is characterized by focus on manufacturing precision, advanced quality assurance, and compliance with European pharmaceutical regulations.
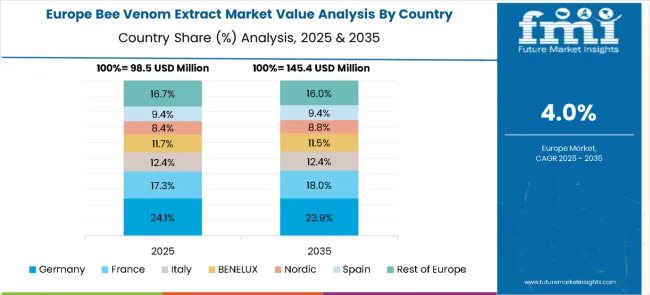
The bee venom extract market in Europe is projected to grow from USD 98.5 million in 2025 to USD 145.4 million by 2035, registering a CAGR of 4.0% over the forecast period. Germany is expected to maintain its leadership with a 24.1% share in 2025, followed by France at 17.3%, supported by strong pharmaceutical and cosmetic applications. Italy represents 12.4% of the market, while the BENELUX region accounts for 11.7%, and the Nordic countries hold 8.4%. Spain captures 9.4% of the European market, while the Rest of Europe collectively makes up 16.7%. By 2035, Germany will continue leading with a 23.9% share, France will grow slightly to 18.0%, and Italy will remain steady at 12.4%. BENELUX and Spain are projected at 11.5% and 9.4%, respectively, while the Rest of Europe will stand at 16.0%, reflecting steady demand expansion across the continent.
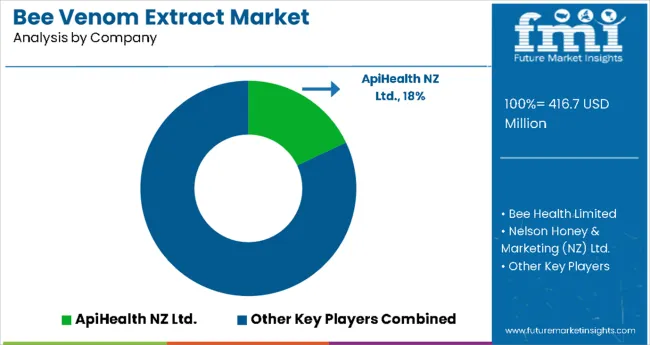
The bee venom extract market is defined by competition among specialized natural product companies, pharmaceutical manufacturers, and biotechnology firms. Companies are investing in advanced extraction equipment, quality control systems, standardized procedures, and research capabilities to deliver pure, reliable, and therapeutically effective bee venom extract solutions. Strategic partnerships, technological innovation, and geographic expansion are central to strengthening product portfolios and market presence.
Api Health NZ Ltd., New Zealand-based, holds an 18.0% market position and offers high-quality bee venom extracts with a focus on pharmaceutical applications and therapeutic efficacy. Bee Health Limited provides comprehensive bee venom extract solutions integrated with natural health product manufacturing and quality assurance. Nelson Honey & Marketing (NZ) Ltd., New Zealand, delivers technologically advanced extraction services with standardized procedures and quality integration. Comvita Limited emphasizes natural product expertise and global distribution capabilities for bee venom extract applications.
Nature's Health Products NZ Ltd. offers bee venom extract solutions integrated into comprehensive natural health product operations. These companies provide specialized extraction expertise, standardized procedures, and product reliability across global and regional networks, focusing on pharmaceutical applications, cosmetic formulations, and therapeutic product development.
The bee venom extract market is emerging as a high-value niche in natural therapeutics, cosmetics, and pharmaceutical R&D. Its applications in anti-inflammatory skincare, arthritis treatments, and drug discovery make it attractive to wellness, pharma, and nutraceutical industries. With increasing consumer preference for natural bio-actives and sustainable sourcing, coordinated stakeholder action will be critical to scaling production responsibly, ensuring quality, and unlocking new therapeutic frontiers.
Key Players in the Bee Venom Extract Market
| Items | Values |
|---|---|
| Quantitative Units (2025) | USD 416.7 Million |
| Type | Liquid, Powder |
| Application | Pharmaceutical, Cosmetic & Personal Care |
| Regions Covered | North America, Europe, Asia Pacific, Latin America, Middle East & Africa |
| Country Covered | India, China, United States, United Kingdom, France, South Korea, Germany, and 40+ countries |
| Key Companies Profiled | ApiHealth NZ Ltd.; Bee Health Limited; Nelson Honey & Marketing (NZ) Ltd.; Comvita Limited; Nature's Health Products NZ Ltd. |
| Additional Attributes | Dollar sales by type/application, regional demand (APAC, NA, Europe), competition from natural product leaders, buyer preference (liquid vs powder), pharma integration, extraction innovations, quality systems, standardized processing for pharma/cosmetic efficacy |
The global bee venom extract market is estimated to be valued at USD 416.7 Million in 2025.
The market size for the bee venom extract market is projected to reach USD 678.8 Million by 2035.
The bee venom extract market is expected to grow at a 5.0% CAGR between 2025 and 2035.
The key product types in bee venom extract market are liquid and powder.
In terms of application, pharmaceutical segment to command 62.7% share in the bee venom extract market in 2025.


Full Research Suite comprises of:
Market outlook & trends analysis
Interviews & case studies
Strategic recommendations
Vendor profiles & capabilities analysis
5-year forecasts
8 regions and 60+ country-level data splits
Market segment data splits
12 months of continuous data updates
DELIVERED AS:
PDF EXCEL ONLINE
Beeswax for Cosmetics Market Size and Share Forecast Outlook 2025 to 2035
Beetroot Powder Market Size and Share Forecast Outlook 2025 to 2035
Beet Pulp Market Size and Share Forecast Outlook 2025 to 2035
Beer Fermenter Market Size and Share Forecast Outlook 2025 to 2035
Beer Stabilizers Market Size and Share Forecast Outlook 2025 to 2035
Beef Fat Market Size and Share Forecast Outlook 2025 to 2035
Beer Bottles Market Size and Share Forecast Outlook 2025 to 2035
Beer Dispensers Market Analysis - Size, Share, and Forecast Outlook 2025 to 2035
Beer Pasteurization Equipment Market Size and Share Forecast Outlook 2025 to 2035
Beer Glass Chillers Market Size and Share Forecast Outlook 2025 to 2035
Beet Sugar Market Analysis - Size, Share, and Forecast Outlook 2025 to 2035
Beer Packaging Market Size, Share & Forecast 2025 to 2035
Beef Concentrate Market Size, Growth, and Forecast for 2025 to 2035
Beer Market Analysis - Size, Share, and Forecast Outlook 2025 to 2035
Beer Keg System Market Forecast & Outlook for 2025 to 2035
Beer Dispensing Machine Market Trends - Growth, Demand & Analysis 2025 to 2035
Beer Line Cooling System Market Trend Analysis Based on System, Application, and End-Use, and Region 2025 to 2035
Beer Line Cleaning Kit Market Trend Analysis Based on Product, End-User, Type, and Region 2025 to 2035
Beer Filter System Market insights by Equipment Type, Type, Filtration Process, Application, and Region 2025 to 2035
Beer Bottling Kit Market Insights by Equipment, Application, Mode of Operation, Distribution Channel, and Region 2025 to 2035

Thank you!
You will receive an email from our Business Development Manager. Please be sure to check your SPAM/JUNK folder too.
Chat With
MaRIA