Methodology

Biobased Binder for Nonwoven Market Forecast and Outlook (2025–2035)

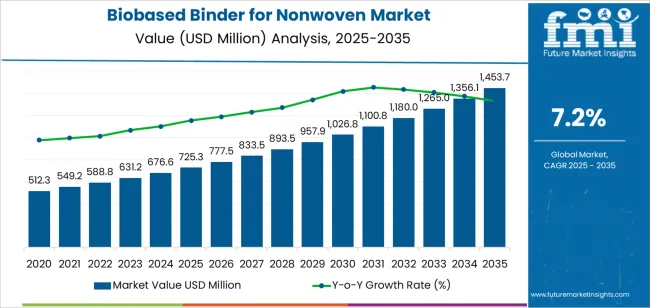
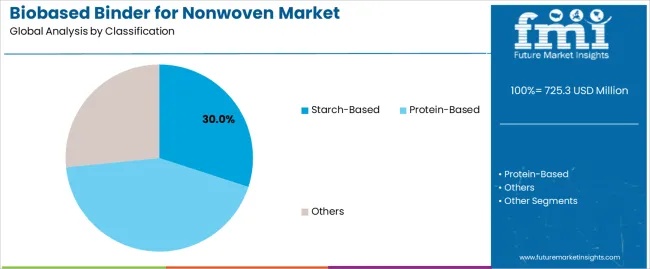
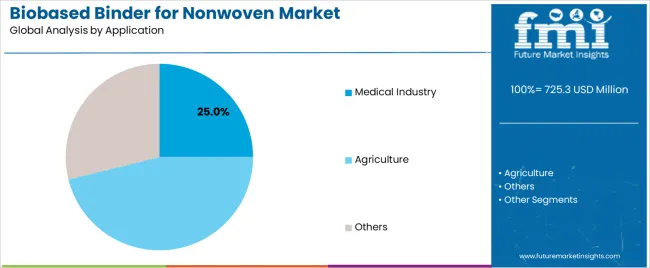
The biobased binder for nonwoven market is valued at USD 725.3 million in 2025 and is projected to reach USD 1,453.7 million by 2035 at a CAGR of 7.2%, creating an absolute dollar opportunity of USD 728.4 million across the assessment period. Demand rises as nonwoven producers replace petrochemical binders with starch, protein and polysaccharide-based alternatives in hygiene, filtration and geotextile applications. Starch-based chemistry leads with a 30.0% share in 2025, while the medical industry application segment maintains a 25.0% share driven by strong usage in gowns, masks, wound dressings and filtration components.

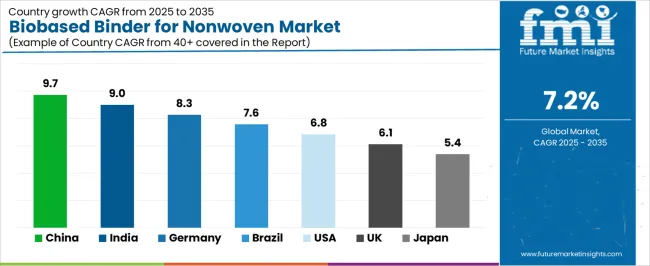
A growth rate volatility index of 0.21 indicates stable progression supported by bioeconomy incentives and regulatory influence across major regions. From 2025 to 2030, adoption accelerates due to wider use of cross-linked biopolymer platforms that improve bonding strength, thermal stability and water resistance across disposable and technical nonwoven products. The period from 2030 to 2035 reflects a moderated expansion pattern as industry consolidation and standardization emerge across global production hubs. Asia Pacific, Europe and North America remain central demand clusters, with China growing at 9.7%, India at 9.0% and Germany at 8.3% through 2035.
Quick Stats for the Biobased Binder for Nonwoven Market

  • Biobased Binder for Nonwoven Market Value (2025): USD 725.3 million
  • Biobased Binder for Nonwoven Market Forecast Value (2035): USD 1,453.7 million
  • Biobased Binder for Nonwoven Market Forecast CAGR (2025-2035): 7.2%
  • Leading Type in Biobased Binder for Nonwoven Market: Starch-Based
  • Key Growth Regions: Asia Pacific, Europe, and North America
  • Top Players: Ingredion, OrganoClick, CH-Polymers, Intercol, Sustaina, Suominen, Owens Corning, NIRI, BASF, Henkel

Biobased Binder For Nonwoven Market Market Value Analysis

What is the Growth Forecast for the Biobased Binder for Nonwoven Market through 2035?

Between 2025 and 2030, the Biobased Binder for Nonwoven Market is projected to grow from USD 725.3 million to USD 1,026.8 million, representing an accelerated growth phase of 41.6% during the first half of the decade. This acceleration reflects strong market momentum driven by increasing global demand for sustainable, renewable, and non-toxic binding solutions in hygiene products, construction materials, and automotive interiors. Supportive environmental regulations, coupled with the rising preference for biodegradable alternatives to petrochemical binders, are strengthening adoption. Rapid technological advancements in bioresin formulation, process optimization, and scalable production systems are further enhancing performance, elasticity, and bonding strength in nonwoven applications.

From 2030 to 2035, the market will experience a moderate deceleration in growth, expanding from USD 1,026.8 million to USD 1,453.7 million a 41.6% increase, but at a slightly slower annualized rate due to market maturation and standardization. This deceleration indicates a transition from innovation-led expansion to volume-driven consolidation. As major manufacturers scale production, price competition and supply chain stabilization will influence growth rates. However, sustained R&D investment in advanced biopolymers, crosslinking agents, and hybrid bio-synthetic formulations will maintain steady performance improvements. The long-term trajectory will favor efficiency optimization, lifecycle sustainability, and enhanced product differentiation through carbon-neutral and circular economy initiatives.

Biobased Binder for Nonwoven Market Key Takeaways

Metric Value
Market Value (2025) USD 725.3 million
Market Forecast Value (2035) USD 1,453.7 million
Forecast CAGR (2025–2035) 7.2%

What Is Driving the Expansion of the Biobased Binder for Nonwoven Market in Eco-Efficient Material Manufacturing?

The biobased binder for nonwoven market is expanding as manufacturers transition toward renewable raw materials to meet environmental regulations and consumer sustainability expectations. These binders, derived from natural polymers such as starch, lignin, cellulose, or plant-based polyesters, provide structural adhesion in nonwoven fabrics used across hygiene, filtration, automotive, and construction applications. Unlike petrochemical-based binders, biobased formulations reduce carbon emissions and improve biodegradability without compromising mechanical strength or bonding uniformity. Advances in bio-polymer modification and crosslinking technologies enhance water resistance, flexibility, and thermal stability, enabling broader use in performance-critical products such as wipes, filters, and insulation materials.

Market growth is further supported by government initiatives promoting bioeconomy development and circular material innovation. Producers in Europe and North America invest in process optimization to balance renewable content ratios with scalability and cost efficiency. Partnerships between chemical suppliers and nonwoven fabric manufacturers accelerate commercial adoption through product testing and certification programs. Demand from hygiene and packaging sectors remains strong as major brands integrate sustainable sourcing into procurement policies. However, variability in bio-feedstock availability and production cost differentials pose ongoing challenges. Continuous improvement in biopolymer synthesis and industrial-scale compounding ensures the biobased binder segment remains a vital component of the eco-efficient nonwoven materials market.

How Are Material Innovations and End-use Trends Defining Segmentation in the Biobased Binder for Nonwoven Market?

The biobased binder for nonwoven market is segmented by classification, application, and region. By classification, the market includes starch-based, protein-based, and other binder types. Based on application, it is categorized into the medical industry, agriculture, and others. Regionally, the market spans North America, Europe, East Asia, South Asia, Latin America, and the Middle East & Africa. These segments reflect the influence of sustainable material development, industrial diversification, and regional policy support driving bio-based adoption within the nonwoven manufacturing ecosystem.
What Factors Sustain the Leadership of the Starch-Based Segment in the Market?

Biobased Binder For Nonwoven Market Analysis By Classification

The starch-based segment accounts for approximately 30.0% of the global biobased binder for nonwoven market in 2025, marking it as the leading classification category. Its position is driven by material renewability, low cost, and adaptability across multiple nonwoven production processes. Derived from agricultural sources such as corn, potatoes, and cassava, starch-based binders deliver reliable adhesion and biodegradability that meet emerging environmental and regulatory criteria.

The segment’s sustained use in lightweight and disposable nonwoven applications stems from its favorable bonding strength and processing simplicity. Ongoing formulation advancements, including chemical and enzymatic modifications, enhance water resistance, tensile integrity, and thermal stability. Industrial demand is particularly concentrated in regions promoting circular economy frameworks and eco-labeling standards, notably in Europe and East Asia. Manufacturers are integrating starch-based binders into filtration media, hygiene products, and agricultural fabrics to balance performance and sustainability objectives. With consistent policy alignment and scalability advantages, the starch-based category continues to anchor the market’s transition toward renewable and low-impact binder solutions across diverse nonwoven manufacturing environments.
Which End-use Sector Generates the Strongest Demand for Biobased Nonwoven Binders?

Biobased Binder For Nonwoven Market Analysis By Application

The medical industry segment represents about 25.0% of the total biobased binder for nonwoven market in 2025, emerging as the primary application area. Its leadership arises from the increasing adoption of eco-friendly nonwoven materials in disposable healthcare products such as surgical gowns, wound dressings, face masks, and filtration components. Biobased binders ensure reliable fiber bonding while maintaining compliance with hygiene and biocompatibility standards required for medical-grade materials.

Demand from healthcare manufacturers is reinforced by sustainability initiatives aimed at reducing plastic waste and transitioning toward biodegradable material use. Starch and protein-based binders are favored for their safety profile, ease of integration into existing production lines, and compatibility with sterilization processes. The segment’s growth is most evident in North America and Europe, where healthcare regulations and institutional procurement policies encourage bio-based alternatives in medical consumables. Continuous improvements in binder stability and coating performance also enhance product quality consistency across production scales. The medical industry remains the largest consumer sector for biobased binders, reflecting its alignment with environmentally responsible healthcare manufacturing and the rising global focus on sustainable material innovation within nonwoven applications.

What are the Key Trends, Drivers, and Restraints in the Biobased Binder for Nonwoven Market?

The biobased binder for nonwoven market is expanding as environmental considerations and sustainability demands rise across nonwoven applications such as hygiene, filtration and geotextiles. Biobased binders derived from plant-based sources such as starch, lignin or proteins are increasingly adopted to bond fibers without relying solely on traditional synthetic resins. Growth is supported by stricter regulatory frameworks around VOCs, increasing nonwoven usage, and consumer preference for eco-friendly materials. Constraints include higher material costs, performance gaps compared to conventional binders and supply-chain limitations. Manufacturers are responding with tailored binder formulations, improved processing compatibility and stronger positioning in green value chains.

How are sustainability regulations and end-use growth driving binder demand?

End‐use sectors such as hygiene wipes, home insulation, filtration fabrics and automotive nonwovens are frequently under pressure to reduce carbon footprint and improve recyclability. For nonwoven fabric producers seeking greener credentialed products, a key USP lies in "renewable-feedstock binder solutions certified to reduce embodied carbon while maintaining fiber-bond strength" enabling mills to differentiate their nonwoven lines for eco-label or regulatory compliance. As the volume of nonwoven usage increases globally, especially in emerging economies, demand for biobased binder alternatives continues to rise.

What challenges are constraining broader adoption of biobased binders in nonwovens?

Broader market adoption remains limited by factors such as higher costs of biobased raw materials, variability in performance under some process conditions, and longer validation cycles for new formulations. Some nonwoven fabric manufacturers may avoid switching from proven synthetic binder systems due to concerns around throughput, cure time or compatibility. For binder suppliers targeting this segment, a USP lies in "rapid custom formulation and on-site trial support that minimise changeover risk and validate performance under existing nonwoven line conditions" which helps reduce barrier to adoption by nonwoven fabric producers.

What key trends are shaping the future development of biobased binder solutions for nonwovens?

Key trends include the development of hybrid binder systems combining biobased and synthetic chemistries to balance sustainability and performance, and the introduction of modular binder platforms designed for various nonwoven process temperatures and fibers. Companies are also introducing digital formulation tools that help manufacturers tailor binder properties for specific nonwoven applications, such as meltblown filters or spunbond geotextiles. A relevant USP for solution providers is "platformised binder portfolio with selectable bio-feedstock ratios and processing modules, enabling scalable use across multiple nonwoven applications" supporting nonwoven producers in platform diversification while managing inventory and process complexity.
What is the Analysis of the Biobased Binder for Nonwoven Market by Key Country?

Biobased Binder For Nonwoven Market Cagr Analysis By Country

Country CAGR (%)
China 9.7%
India 9.0%
Germany 8.3%
Brazil 7.6%
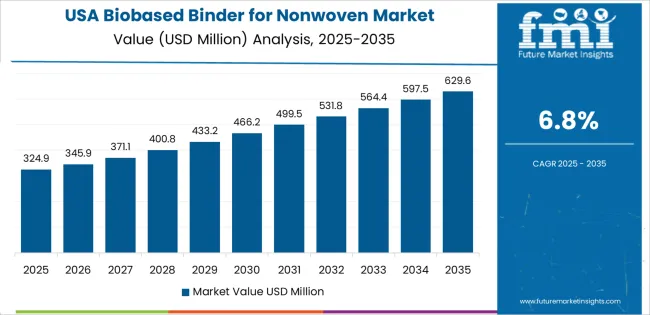
USA 6.8%
UK 6.1%
Japan 5.4%

The biobased binder for nonwoven market is expanding rapidly worldwide, with China leading at a 9.7% CAGR through 2035, driven by growing sustainability mandates, industrial-scale nonwoven production, and advancements in green chemical processing. India follows at 9.0%, supported by increasing use of eco-friendly materials, strong textile sector growth, and government emphasis on biodegradable product innovation. Germany grows at 8.3%, reflecting leadership in biopolymer research, material science excellence, and circular economy integration. Brazil records a 7.6% CAGR, benefiting from bioresource availability and rising investment in sustainable manufacturing. The USA, at 6.8%, focuses on innovation in bioresins and performance optimization, while the UK (6.1%) and Japan (5.4%) emphasize environmental compliance, product quality, and expansion in sustainable nonwoven applications for hygiene and filtration sectors.

How Is Eco-Efficient Manufacturing Accelerating Market Growth in China?

China is demonstrating strong expansion in the biobased binder for nonwoven market, projected to grow at a CAGR of 9.7% through 2035. The country’s rapid adoption of eco-friendly industrial materials and sustainable textile technologies is driving market growth. Domestic producers are increasing biopolymer output and optimizing production processes for nonwoven fabrics used in hygiene, filtration, and packaging. Government incentives promoting low-carbon manufacturing continue to strengthen investment in bio-based adhesive systems, replacing conventional petrochemical binders.

  • Expansion in nonwoven production boosts biobased binder demand.
  • Green manufacturing policies encourage industrial adoption.
  • Local innovation improves bio-polymer efficiency and strength.
  • Hygiene and packaging sectors sustain consistent market growth.

Why Is Green Chemistry Development Strengthening Market Potential in India?

India is witnessing rapid growth in the biobased binder for nonwoven market, advancing at a CAGR of 9.0%, supported by expansion in sustainable manufacturing and increasing consumer preference for eco-friendly materials. Domestic producers are collaborating with research institutes to develop starch and cellulose-based binders compatible with hygiene and filtration applications. Rising awareness of sustainable production practices among nonwoven manufacturers is improving large-scale adoption. The growing medical and agricultural textile industries further strengthen market stability.

  • Collaboration with research institutes supports innovation in bio-binders.
  • Growing medical and hygiene sectors enhance product utilization.
  • Expansion of sustainable textiles drives industrial transformation.
  • Policy support promotes domestic material development.

How Does Material Science Expertise Sustain Market Competitiveness in Germany?

Across Germany, the biobased binder for nonwoven market is expanding at a CAGR of 8.3%, supported by advanced material science capabilities and strict environmental standards. Manufacturers are developing next-generation biopolymer formulations using starch, lignin, and polylactic acid to ensure mechanical stability and recyclability. The focus on replacing synthetic binders in filtration and automotive applications aligns with EU sustainability targets. Integration of automation and precision mixing technologies enhances product consistency and production efficiency.

  • Advanced polymer chemistry drives binder innovation.
  • EU sustainability goals encourage biobased adoption.
  • Automation improves process stability and material uniformity.
  • Nonwoven demand from automotive and filtration industries sustains growth.

Why Is Industrial Diversification Encouraging Market Development in Brazil?

Brazil is recording steady progress in the biobased binder for nonwoven market, projected to expand at a CAGR of 7.6% through 2035. Industrial diversification and growing environmental awareness are fueling adoption of sustainable binders. Local manufacturers are utilizing renewable feedstocks such as soy derivatives and sugarcane byproducts to reduce reliance on petroleum-based adhesives. Expansion in packaging, hygiene, and agricultural textiles is creating long-term opportunities for bio-based alternatives. Supportive government policies promoting renewable materials further reinforce growth momentum.
  • Utilization of renewable agricultural byproducts strengthens sustainability.
  • Expansion in hygiene and packaging drives material consumption.
  • Environmental awareness promotes industrial transformation.
  • Policy frameworks encourage adoption of green production methods.

How Do Eco-Efficiency Initiatives Support Market Expansion in the United States?

Biobased Binder For Nonwoven Market Country Value Analysis

In the United States, the biobased binder for nonwoven market is growing at a CAGR of 6.8%, driven by the transition toward renewable materials across industrial manufacturing. Producers are developing bio-acrylate and protein-based binders offering improved flexibility and bonding strength. Expansion in filtration, medical, and automotive textile applications ensures consistent material utilization. Federal incentives for sustainable manufacturing and waste reduction continue to support bio-based technology investments across nonwoven production facilities.

  • Renewable chemistry supports high-performance binder development.
  • Filtration and medical applications sustain steady demand.
  • Federal sustainability incentives encourage innovation.
  • Automotive nonwovens reinforce long-term consumption growth.

Why Is Eco-Innovation Sustaining Market Activity in the United Kingdom?

Across the United Kingdom, the biobased binder for nonwoven market is advancing at a CAGR of 6.1%, supported by eco-innovation and strong research collaboration between universities and manufacturing firms. Development of plant-based polymers and biodegradable adhesive formulations aligns with the country’s decarbonization strategy. Increasing adoption of sustainable hygiene and filtration products drives steady demand. Regulatory alignment with European environmental standards ensures ongoing investment in next-generation binder technologies.

  • Eco-innovation strengthens competitiveness of domestic producers.
  • Regulatory alignment supports product standardization.
  • Biodegradable materials gain traction in nonwoven applications.
  • Collaboration between academia and industry sustains innovation flow.

How Does Precision Manufacturing Maintain Market Stability in Japan?

Japan is experiencing consistent growth in the biobased binder for nonwoven market, projected to rise at a CAGR of 5.4% through 2035. Domestic companies emphasize precision in polymer formulation and surface treatment to enhance binding performance and recyclability. Applications in high-quality hygiene, industrial filtration, and electronics continue to drive steady adoption. Research investment in hybrid bio-synthetic binders improves mechanical integrity while maintaining environmental compatibility, ensuring long-term market stability and export competitiveness.
  • Precision engineering improves material consistency and durability.
  • Research supports hybrid bio-synthetic binder innovation.
  • Demand from filtration and hygiene maintains stable usage.
  • Environmental compatibility sustains long-term industrial relevance.

How Competitive Is the Global Biobased Binder for Nonwoven Market and What Defines Its Strategic Landscape?

Biobased Binder For Nonwoven Market Analysis By Company

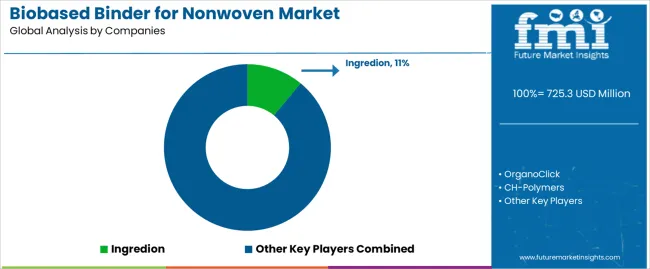
The global biobased binder for nonwoven market demonstrates moderate concentration, supported by chemical innovators and material technology providers focusing on sustainable production. Ingredion leads the market with an estimated 11% share, leveraging starch-based polymer systems developed for biodegradable and renewable nonwoven applications. OrganoClick and CH-Polymers maintain strong positions through proprietary biopolymer formulations that enhance bonding strength and water resistance without compromising compostability.

Intercol and Sustaina contribute specialized adhesive solutions emphasizing low VOC content and compatibility with cellulose and PLA fiber matrices. Suominen integrates binder technologies into nonwoven fabric manufacturing, aligning product performance with hygiene, filtration, and industrial sustainability requirements. Owens Corning focuses on structural reinforcement applications where biobased binders replace conventional petrochemical adhesives.

NIRI strengthens innovation through research partnerships, developing customized binder chemistries for next-generation sustainable textiles. BASF and Henkel sustain competitiveness by expanding their green chemistry portfolios and adapting established adhesive technologies to biopolymer-compatible systems. Competition in this market is shaped by mechanical strength retention, processability, and end-of-life biodegradation characteristics. Strategic differentiation depends on renewable content optimization, cost-efficiency at scale, and compliance with global environmental standards. Long-term market leadership will be defined by the ability to balance functional performance with reduced carbon footprint, enabling manufacturers to meet growing sustainability targets across hygiene, automotive, and filtration nonwoven applications.

Key Players in the Biobased Binder for Nonwoven Market

  • Ingredion
  • OrganoClick
  • CH-Polymers
  • Intercol
  • Sustaina
  • Suominen
  • Owens Corning
  • NIRI
  • BASF
  • Henkel

Report Scope for the Biobased Binder for Nonwoven Market

Items Values
Quantitative Units (2025) USD million
Type (Classification) Starch-Based, Protein-Based, Others
Application Medical Industry, Agriculture, Others
Regions Covered North America, Europe, East Asia, South Asia, Latin America, Middle East & Africa, Eastern Europe
Countries Covered China, India, USA, Germany, Brazil, UK, Japan, and 40+ countries
Key Companies Profiled Ingredion, OrganoClick, CH-Polymers, Intercol, Sustaina, Suominen, Owens Corning, NIRI, BASF, Henkel
Additional Attributes Dollar sales by classification and application segments; regional adoption analysis across hygiene, filtration, and agricultural applications; performance benchmarking of starch, protein, and hybrid binder systems; insights on bio-feedstock utilization and carbon reduction impact; industrial adoption drivers linked to circular economy goals; analysis of mechanical strength, thermal resistance, and biodegradability; R&D focus on crosslinked and hybrid binder formulations; policy influence of green manufacturing initiatives; integration trends in nonwoven production lines; and competitive landscape evaluation highlighting technological innovation, supply chain scalability, and sustainability certification alignment.

Biobased Binder for Nonwoven Market by Segments

Classification:

  • Starch-Based
  • Protein-Based
  • Others

Application:

  • Medical Industry
  • Agriculture
  • Others

Region:

East Asia

  • China
  • Japan
  • South Korea
  • Taiwan
  • Rest of East Asia

Europe

  • Germany
  • UK
  • France
  • Italy
  • Spain
  • Switzerland
  • Nordic
  • BENELUX
  • Rest of Europe

North America

  • USA
  • Canada
  • Mexico

South Asia

  • India
  • Pakistan
  • Bangladesh
  • Rest of South Asia

Latin America

  • Brazil
  • Argentina
  • Chile
  • Rest of Latin America

Middle East & Africa

  • Kingdom of Saudi Arabia
  • Other GCC Countries
  • Turkey
  • South Africa
  • Other African Union
  • Rest of Middle East & Africa

Eastern Europe

  • Russia
  • Poland
  • Czech Republic

Rest of Eastern Europe

Frequently Asked Questions

How big is the biobased binder for nonwoven market in 2025?

The global biobased binder for nonwoven market is estimated to be valued at USD 725.3 million in 2025.

What will be the size of biobased binder for nonwoven market in 2035?

The market size for the biobased binder for nonwoven market is projected to reach USD 1,453.7 million by 2035.

How much will be the biobased binder for nonwoven market growth between 2025 and 2035?

The biobased binder for nonwoven market is expected to grow at a 7.2% CAGR between 2025 and 2035.

What are the key product types in the biobased binder for nonwoven market?

The key product types in biobased binder for nonwoven market are starch-based, protein-based and others.

Which application segment to contribute significant share in the biobased binder for nonwoven market in 2025?

In terms of application, medical industry segment to command 25.0% share in the biobased binder for nonwoven market in 2025.

Table of Content

  1. Executive Summary
    • Global Market Outlook
    • Demand to side Trends
    • Supply to side Trends
    • Technology Roadmap Analysis
    • Analysis and Recommendations
  2. Market Overview
    • Market Coverage / Taxonomy
    • Market Definition / Scope / Limitations
  3. Market Background
    • Market Dynamics
      • Drivers
      • Restraints
      • Opportunity
      • Trends
    • Scenario Forecast
      • Demand in Optimistic Scenario
      • Demand in Likely Scenario
      • Demand in Conservative Scenario
    • Opportunity Map Analysis
    • Product Life Cycle Analysis
    • Supply Chain Analysis
    • Investment Feasibility Matrix
    • Value Chain Analysis
    • PESTLE and Porter’s Analysis
    • Regulatory Landscape
    • Regional Parent Market Outlook
    • Production and Consumption Statistics
    • Import and Export Statistics
  4. Global Market Analysis 2020 to 2024 and Forecast, 2025 to 2035
    • Historical Market Size Value (USD Million) Analysis, 2020 to 2024
    • Current and Future Market Size Value (USD Million) Projections, 2025 to 2035
      • Y to o to Y Growth Trend Analysis
      • Absolute $ Opportunity Analysis
  5. Global Market Pricing Analysis 2020 to 2024 and Forecast 2025 to 2035
  6. Global Market Analysis 2020 to 2024 and Forecast 2025 to 2035, By Classification
    • Introduction / Key Findings
    • Historical Market Size Value (USD Million) Analysis By Classification , 2020 to 2024
    • Current and Future Market Size Value (USD Million) Analysis and Forecast By Classification , 2025 to 2035
      • Starch-Based
      • Protein-Based
      • Others
    • Y to o to Y Growth Trend Analysis By Classification , 2020 to 2024
    • Absolute $ Opportunity Analysis By Classification , 2025 to 2035
  7. Global Market Analysis 2020 to 2024 and Forecast 2025 to 2035, By Application
    • Introduction / Key Findings
    • Historical Market Size Value (USD Million) Analysis By Application, 2020 to 2024
    • Current and Future Market Size Value (USD Million) Analysis and Forecast By Application, 2025 to 2035
      • Medical Industry
      • Agriculture
      • Others
    • Y to o to Y Growth Trend Analysis By Application, 2020 to 2024
    • Absolute $ Opportunity Analysis By Application, 2025 to 2035
  8. Global Market Analysis 2020 to 2024 and Forecast 2025 to 2035, By Region
    • Introduction
    • Historical Market Size Value (USD Million) Analysis By Region, 2020 to 2024
    • Current Market Size Value (USD Million) Analysis and Forecast By Region, 2025 to 2035
      • North America
      • Latin America
      • Western Europe
      • Eastern Europe
      • East Asia
      • South Asia and Pacific
      • Middle East & Africa
    • Market Attractiveness Analysis By Region
  9. North America Market Analysis 2020 to 2024 and Forecast 2025 to 2035, By Country
    • Historical Market Size Value (USD Million) Trend Analysis By Market Taxonomy, 2020 to 2024
    • Market Size Value (USD Million) Forecast By Market Taxonomy, 2025 to 2035
      • By Country
        • USA
        • Canada
        • Mexico
      • By Classification
      • By Application
    • Market Attractiveness Analysis
      • By Country
      • By Classification
      • By Application
    • Key Takeaways
  10. Latin America Market Analysis 2020 to 2024 and Forecast 2025 to 2035, By Country
    • Historical Market Size Value (USD Million) Trend Analysis By Market Taxonomy, 2020 to 2024
    • Market Size Value (USD Million) Forecast By Market Taxonomy, 2025 to 2035
      • By Country
        • Brazil
        • Chile
        • Rest of Latin America
      • By Classification
      • By Application
    • Market Attractiveness Analysis
      • By Country
      • By Classification
      • By Application
    • Key Takeaways
  11. Western Europe Market Analysis 2020 to 2024 and Forecast 2025 to 2035, By Country
    • Historical Market Size Value (USD Million) Trend Analysis By Market Taxonomy, 2020 to 2024
    • Market Size Value (USD Million) Forecast By Market Taxonomy, 2025 to 2035
      • By Country
        • Germany
        • UK
        • Italy
        • Spain
        • France
        • Nordic
        • BENELUX
        • Rest of Western Europe
      • By Classification
      • By Application
    • Market Attractiveness Analysis
      • By Country
      • By Classification
      • By Application
    • Key Takeaways
  12. Eastern Europe Market Analysis 2020 to 2024 and Forecast 2025 to 2035, By Country
    • Historical Market Size Value (USD Million) Trend Analysis By Market Taxonomy, 2020 to 2024
    • Market Size Value (USD Million) Forecast By Market Taxonomy, 2025 to 2035
      • By Country
        • Russia
        • Poland
        • Hungary
        • Balkan & Baltic
        • Rest of Eastern Europe
      • By Classification
      • By Application
    • Market Attractiveness Analysis
      • By Country
      • By Classification
      • By Application
    • Key Takeaways
  13. East Asia Market Analysis 2020 to 2024 and Forecast 2025 to 2035, By Country
    • Historical Market Size Value (USD Million) Trend Analysis By Market Taxonomy, 2020 to 2024
    • Market Size Value (USD Million) Forecast By Market Taxonomy, 2025 to 2035
      • By Country
        • China
        • Japan
        • South Korea
      • By Classification
      • By Application
    • Market Attractiveness Analysis
      • By Country
      • By Classification
      • By Application
    • Key Takeaways
  14. South Asia and Pacific Market Analysis 2020 to 2024 and Forecast 2025 to 2035, By Country
    • Historical Market Size Value (USD Million) Trend Analysis By Market Taxonomy, 2020 to 2024
    • Market Size Value (USD Million) Forecast By Market Taxonomy, 2025 to 2035
      • By Country
        • India
        • ASEAN
        • Australia & New Zealand
        • Rest of South Asia and Pacific
      • By Classification
      • By Application
    • Market Attractiveness Analysis
      • By Country
      • By Classification
      • By Application
    • Key Takeaways
  15. Middle East & Africa Market Analysis 2020 to 2024 and Forecast 2025 to 2035, By Country
    • Historical Market Size Value (USD Million) Trend Analysis By Market Taxonomy, 2020 to 2024
    • Market Size Value (USD Million) Forecast By Market Taxonomy, 2025 to 2035
      • By Country
        • Kingdom of Saudi Arabia
        • Other GCC Countries
        • Turkiye
        • South Africa
        • Other African Union
        • Rest of Middle East & Africa
      • By Classification
      • By Application
    • Market Attractiveness Analysis
      • By Country
      • By Classification
      • By Application
    • Key Takeaways
  16. Key Countries Market Analysis
    • USA
      • Pricing Analysis
      • Market Share Analysis, 2024
        • By Classification
        • By Application
    • Canada
      • Pricing Analysis
      • Market Share Analysis, 2024
        • By Classification
        • By Application
    • Mexico
      • Pricing Analysis
      • Market Share Analysis, 2024
        • By Classification
        • By Application
    • Brazil
      • Pricing Analysis
      • Market Share Analysis, 2024
        • By Classification
        • By Application
    • Chile
      • Pricing Analysis
      • Market Share Analysis, 2024
        • By Classification
        • By Application
    • Germany
      • Pricing Analysis
      • Market Share Analysis, 2024
        • By Classification
        • By Application
    • UK
      • Pricing Analysis
      • Market Share Analysis, 2024
        • By Classification
        • By Application
    • Italy
      • Pricing Analysis
      • Market Share Analysis, 2024
        • By Classification
        • By Application
    • Spain
      • Pricing Analysis
      • Market Share Analysis, 2024
        • By Classification
        • By Application
    • France
      • Pricing Analysis
      • Market Share Analysis, 2024
        • By Classification
        • By Application
    • India
      • Pricing Analysis
      • Market Share Analysis, 2024
        • By Classification
        • By Application
    • ASEAN
      • Pricing Analysis
      • Market Share Analysis, 2024
        • By Classification
        • By Application
    • Australia & New Zealand
      • Pricing Analysis
      • Market Share Analysis, 2024
        • By Classification
        • By Application
    • China
      • Pricing Analysis
      • Market Share Analysis, 2024
        • By Classification
        • By Application
    • Japan
      • Pricing Analysis
      • Market Share Analysis, 2024
        • By Classification
        • By Application
    • South Korea
      • Pricing Analysis
      • Market Share Analysis, 2024
        • By Classification
        • By Application
    • Russia
      • Pricing Analysis
      • Market Share Analysis, 2024
        • By Classification
        • By Application
    • Poland
      • Pricing Analysis
      • Market Share Analysis, 2024
        • By Classification
        • By Application
    • Hungary
      • Pricing Analysis
      • Market Share Analysis, 2024
        • By Classification
        • By Application
    • Kingdom of Saudi Arabia
      • Pricing Analysis
      • Market Share Analysis, 2024
        • By Classification
        • By Application
    • Turkiye
      • Pricing Analysis
      • Market Share Analysis, 2024
        • By Classification
        • By Application
    • South Africa
      • Pricing Analysis
      • Market Share Analysis, 2024
        • By Classification
        • By Application
  17. Market Structure Analysis
    • Competition Dashboard
    • Competition Benchmarking
    • Market Share Analysis of Top Players
      • By Regional
      • By Classification
      • By Application
  18. Competition Analysis
    • Competition Deep Dive
      • Ingredion
        • Overview
        • Product Portfolio
        • Profitability by Market Segments (Product/Age /Sales Channel/Region)
        • Sales Footprint
        • Strategy Overview
          • Marketing Strategy
          • Product Strategy
          • Channel Strategy
      • OrganoClick
      • CH-Polymers
      • Intercol
      • Sustaina
      • Suominen
      • Owens Corning
      • NIRI
      • BASF
      • Henkel
  19. Assumptions & Acronyms Used
  20. Research Methodology

List of Tables

  • Table 1: Global Market Value (USD Million) Forecast by Region, 2020 to 2035
  • Table 2: Global Market Value (USD Million) Forecast by Classification , 2020 to 2035
  • Table 3: Global Market Value (USD Million) Forecast by Application, 2020 to 2035
  • Table 4: North America Market Value (USD Million) Forecast by Country, 2020 to 2035
  • Table 5: North America Market Value (USD Million) Forecast by Classification , 2020 to 2035
  • Table 6: North America Market Value (USD Million) Forecast by Application, 2020 to 2035
  • Table 7: Latin America Market Value (USD Million) Forecast by Country, 2020 to 2035
  • Table 8: Latin America Market Value (USD Million) Forecast by Classification , 2020 to 2035
  • Table 9: Latin America Market Value (USD Million) Forecast by Application, 2020 to 2035
  • Table 10: Western Europe Market Value (USD Million) Forecast by Country, 2020 to 2035
  • Table 11: Western Europe Market Value (USD Million) Forecast by Classification , 2020 to 2035
  • Table 12: Western Europe Market Value (USD Million) Forecast by Application, 2020 to 2035
  • Table 13: Eastern Europe Market Value (USD Million) Forecast by Country, 2020 to 2035
  • Table 14: Eastern Europe Market Value (USD Million) Forecast by Classification , 2020 to 2035
  • Table 15: Eastern Europe Market Value (USD Million) Forecast by Application, 2020 to 2035
  • Table 16: East Asia Market Value (USD Million) Forecast by Country, 2020 to 2035
  • Table 17: East Asia Market Value (USD Million) Forecast by Classification , 2020 to 2035
  • Table 18: East Asia Market Value (USD Million) Forecast by Application, 2020 to 2035
  • Table 19: South Asia and Pacific Market Value (USD Million) Forecast by Country, 2020 to 2035
  • Table 20: South Asia and Pacific Market Value (USD Million) Forecast by Classification , 2020 to 2035
  • Table 21: South Asia and Pacific Market Value (USD Million) Forecast by Application, 2020 to 2035
  • Table 22: Middle East & Africa Market Value (USD Million) Forecast by Country, 2020 to 2035
  • Table 23: Middle East & Africa Market Value (USD Million) Forecast by Classification , 2020 to 2035
  • Table 24: Middle East & Africa Market Value (USD Million) Forecast by Application, 2020 to 2035

List of Figures

  • Figure 1: Global Market Pricing Analysis
  • Figure 2: Global Market Value (USD Million) Forecast 2020-2035
  • Figure 3: Global Market Value Share and BPS Analysis by Classification , 2025 and 2035
  • Figure 4: Global Market Y-o-Y Growth Comparison by Classification , 2025-2035
  • Figure 5: Global Market Attractiveness Analysis by Classification
  • Figure 6: Global Market Value Share and BPS Analysis by Application, 2025 and 2035
  • Figure 7: Global Market Y-o-Y Growth Comparison by Application, 2025-2035
  • Figure 8: Global Market Attractiveness Analysis by Application
  • Figure 9: Global Market Value (USD Million) Share and BPS Analysis by Region, 2025 and 2035
  • Figure 10: Global Market Y-o-Y Growth Comparison by Region, 2025-2035
  • Figure 11: Global Market Attractiveness Analysis by Region
  • Figure 12: North America Market Incremental Dollar Opportunity, 2025-2035
  • Figure 13: Latin America Market Incremental Dollar Opportunity, 2025-2035
  • Figure 14: Western Europe Market Incremental Dollar Opportunity, 2025-2035
  • Figure 15: Eastern Europe Market Incremental Dollar Opportunity, 2025-2035
  • Figure 16: East Asia Market Incremental Dollar Opportunity, 2025-2035
  • Figure 17: South Asia and Pacific Market Incremental Dollar Opportunity, 2025-2035
  • Figure 18: Middle East & Africa Market Incremental Dollar Opportunity, 2025-2035
  • Figure 19: North America Market Value Share and BPS Analysis by Country, 2025 and 2035
  • Figure 20: North America Market Value Share and BPS Analysis by Classification , 2025 and 2035
  • Figure 21: North America Market Y-o-Y Growth Comparison by Classification , 2025-2035
  • Figure 22: North America Market Attractiveness Analysis by Classification
  • Figure 23: North America Market Value Share and BPS Analysis by Application, 2025 and 2035
  • Figure 24: North America Market Y-o-Y Growth Comparison by Application, 2025-2035
  • Figure 25: North America Market Attractiveness Analysis by Application
  • Figure 26: Latin America Market Value Share and BPS Analysis by Country, 2025 and 2035
  • Figure 27: Latin America Market Value Share and BPS Analysis by Classification , 2025 and 2035
  • Figure 28: Latin America Market Y-o-Y Growth Comparison by Classification , 2025-2035
  • Figure 29: Latin America Market Attractiveness Analysis by Classification
  • Figure 30: Latin America Market Value Share and BPS Analysis by Application, 2025 and 2035
  • Figure 31: Latin America Market Y-o-Y Growth Comparison by Application, 2025-2035
  • Figure 32: Latin America Market Attractiveness Analysis by Application
  • Figure 33: Western Europe Market Value Share and BPS Analysis by Country, 2025 and 2035
  • Figure 34: Western Europe Market Value Share and BPS Analysis by Classification , 2025 and 2035
  • Figure 35: Western Europe Market Y-o-Y Growth Comparison by Classification , 2025-2035
  • Figure 36: Western Europe Market Attractiveness Analysis by Classification
  • Figure 37: Western Europe Market Value Share and BPS Analysis by Application, 2025 and 2035
  • Figure 38: Western Europe Market Y-o-Y Growth Comparison by Application, 2025-2035
  • Figure 39: Western Europe Market Attractiveness Analysis by Application
  • Figure 40: Eastern Europe Market Value Share and BPS Analysis by Country, 2025 and 2035
  • Figure 41: Eastern Europe Market Value Share and BPS Analysis by Classification , 2025 and 2035
  • Figure 42: Eastern Europe Market Y-o-Y Growth Comparison by Classification , 2025-2035
  • Figure 43: Eastern Europe Market Attractiveness Analysis by Classification
  • Figure 44: Eastern Europe Market Value Share and BPS Analysis by Application, 2025 and 2035
  • Figure 45: Eastern Europe Market Y-o-Y Growth Comparison by Application, 2025-2035
  • Figure 46: Eastern Europe Market Attractiveness Analysis by Application
  • Figure 47: East Asia Market Value Share and BPS Analysis by Country, 2025 and 2035
  • Figure 48: East Asia Market Value Share and BPS Analysis by Classification , 2025 and 2035
  • Figure 49: East Asia Market Y-o-Y Growth Comparison by Classification , 2025-2035
  • Figure 50: East Asia Market Attractiveness Analysis by Classification
  • Figure 51: East Asia Market Value Share and BPS Analysis by Application, 2025 and 2035
  • Figure 52: East Asia Market Y-o-Y Growth Comparison by Application, 2025-2035
  • Figure 53: East Asia Market Attractiveness Analysis by Application
  • Figure 54: South Asia and Pacific Market Value Share and BPS Analysis by Country, 2025 and 2035
  • Figure 55: South Asia and Pacific Market Value Share and BPS Analysis by Classification , 2025 and 2035
  • Figure 56: South Asia and Pacific Market Y-o-Y Growth Comparison by Classification , 2025-2035
  • Figure 57: South Asia and Pacific Market Attractiveness Analysis by Classification
  • Figure 58: South Asia and Pacific Market Value Share and BPS Analysis by Application, 2025 and 2035
  • Figure 59: South Asia and Pacific Market Y-o-Y Growth Comparison by Application, 2025-2035
  • Figure 60: South Asia and Pacific Market Attractiveness Analysis by Application
  • Figure 61: Middle East & Africa Market Value Share and BPS Analysis by Country, 2025 and 2035
  • Figure 62: Middle East & Africa Market Value Share and BPS Analysis by Classification , 2025 and 2035
  • Figure 63: Middle East & Africa Market Y-o-Y Growth Comparison by Classification , 2025-2035
  • Figure 64: Middle East & Africa Market Attractiveness Analysis by Classification
  • Figure 65: Middle East & Africa Market Value Share and BPS Analysis by Application, 2025 and 2035
  • Figure 66: Middle East & Africa Market Y-o-Y Growth Comparison by Application, 2025-2035
  • Figure 67: Middle East & Africa Market Attractiveness Analysis by Application
  • Figure 68: Global Market - Tier Structure Analysis
  • Figure 69: Global Market - Company Share Analysis
Dashboard
Dashboard
Dashboard
Dashboard
Dashboard
Dashboard

Our Research Products

Full Research Suite

The "Full Research Suite" delivers actionable market intel, deep dives on markets or technologies, so clients act faster, cut risk, and unlock growth.

Competitor Leaderboard Report

The Leaderboard benchmarks and ranks top vendors, classifying them as Established Leaders, Leading Challengers, or Disruptors & Challengers.

Future Leaders Index

Locates where complements amplify value and substitutes erode it, forecasting net impact by horizon

Market Data & Forecasts

We deliver granular, decision-grade intel: market sizing, 5-year forecasts, pricing, adoption, usage, revenue, and operational KPIs—plus competitor tracking, regulation, and value chains—across 60 countries broadly.

Market Focus Report

Spot the shifts before they hit your P&L. We track inflection points, adoption curves, pricing moves, and ecosystem plays to show where demand is heading, why it is changing, and what to do next across high-growth markets and disruptive tech

Survey Report

Real-time reads of user behavior. We track shifting priorities, perceptions of today’s and next-gen services, and provider experience, then pace how fast tech moves from trial to adoption, blending buyer, consumer, and channel inputs with social signals (#WhySwitch, #UX).

Bespoke Reports

Partner with our analyst team to build a custom report designed around your business priorities. From analysing market trends to assessing competitors or crafting bespoke datasets, we tailor insights to your needs.

Supplier Intelligence

Discovery & Profiling

Capacity & Footprint

Performance & Risk

Compliance & Governance

Commercial Readiness

Who Supplies Whom

Scorecards & Shortlists

Playbooks & Docs

Category Intelligence

Definition & Scope

Demand & Use Cases

Cost Drivers

Market Structure

Supply Chain Map

Trade & Policy

Operating Norms

Deliverables

Buyer Intelligence

Account Basics

Spend & Scope

Procurement Model

Vendor Requirements

Terms & Policies

Entry Strategy

Pain Points & Triggers

Outputs

Pricing Analysis

Benchmarks

Trends

Should-Cost

Indexation

Landed Cost

Commercial Terms

Deliverables

Brand Analysis

Positioning & Value Prop

Share & Presence

Customer Evidence

Go-to-Market

Digital & Reputation

Compliance & Trust

KPIs & Gaps

Outputs

Full Research Suite comprises of:

Market outlook & trends analysis

Market outlook & trends analysis

Interviews & case studies

Interviews & case studies

Strategic recommendations

Strategic recommendations

Vendor profiles & capabilities analysis

Vendor profiles & capabilities analysis

5-year forecasts

5-year forecasts

8 regions and 60+ country-level data splits

8 regions and 60+ country-level data splits

Market segment data splits

Market segment data splits

12 months of continuous data updates

12 months of continuous data updates

DELIVERED AS:

PDF EXCEL ONLINE

Full Research Suite


$5000

$7500

$10000

Buy Report Now
Similar Industry Reports

Similar Industry Reports

Biobased And Synthetic Polyamides Market

Biobased And Synthetic Polyamides Market Size and Share Forecast Outlook 2025 to 2035

Biobased Polypropylene PP Size Market

Biobased Polypropylene PP Size Market Size and Share Forecast Outlook 2025 to 2035

Biobased Degreaser Market

Biobased Degreaser Market Size and Share Forecast Outlook 2025 to 2035

Biobased Biodegradable Plastic Market

Biobased Biodegradable Plastic Market Growth - Trends & Forecast 2025 to 2035

Biobased Propylene Glycol Market

Biobased Propylene Glycol Market Growth - Trends & Forecast 2025 to 2035

Biobased Transformer Oil Market

Biobased Transformer Oil Market

Binders Market
Binders Market

Binders Market Size and Share Forecast Outlook 2025 to 2035

Binder's Board Market

Binder's Board Market Size and Share Forecast Outlook 2025 to 2035

Binder Clip Market
Binder Clip Market

Binder Clip Market Trends & Industry Growth Forecast 2024-2034

Binder Jet Market
Binder Jet Market

Binder Jet Market

Seed Binders Market
Seed Binders Market

Seed Binders Market Analysis - Size, Share & Forecast 2025 to 2035

Feed Binder Market
Feed Binder Market

Feed Binder Market

Pellet binders Market

Pellet Binders Market Analysis - Size, Share, and Forecast Outlook 2025 to 2035

Custom Binders Market

Custom Binders Market Growth & Industry Forecast 2025 to 2035

Polymer Binders Market

Polymer Binders Market Size and Share Forecast Outlook 2025 to 2035

Battery Binders Market

Battery Binders Market Size and Share Forecast Outlook 2025 to 2035

Cathode Binders Market Share Analysis

Analyzing Cathode Binders Market Share & Industry Leaders

Organic Binders Market

Organic Binders Market

Bio-Based Binder for Building Materials Market

Bio-Based Binder for Building Materials Market Size and Share Forecast Outlook 2025 to 2035

Paper Coating Binders Market

Paper Coating Binders Market Size and Share Forecast Outlook 2025 to 2035

Future Market Insights

Biobased Binder for Nonwoven Market

Chat With MaRIA

Chat With

MaRIA

Hi There, I am MaRIA, Your Market Research Intelligence Assistant. How may I help you?