Pellet Binders Market Size and Share Forecast Outlook 2025 to 2035

The pellet binders market is set to expand from USD 1.7 billion in 2025 to USD 2.5 billion by 2035, registering a CAGR of 4.3%. Annual growth begins at USD 0.07 billion in 2026 and gradually increases to nearly USD 0.09 billion by 2035, indicating steady value accumulation.
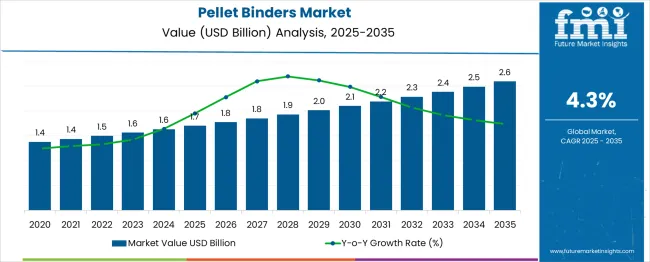
Quick Stats of the Pellet Binders Market

  • Pellet Binders Market Size (2025): USD 1.7 billion
  • Projected Pellet Binders Market Size (2035): USD 2.5 billion
  • Forecast CAGR of Pellet Binders Market (2025 to 2035): 4.3%
  • Leading Segment of Pellet Binders Market (2025): Lignosulfonates (33%)
  • Key Growth Regions of Pellet Binders Market: Asia-Pacific
  • Top Key Players of Pellet Binders Market: Borregaard (LignoTech), Uniscope Inc., FMC Corporation, Danisco (IFF - International Flavors & Fragrances), Kemin Industries

Pellet Binders Market Market Value Analysis

Metric Value
Industry Size (2025E) USD 1.7 billion
Industry Value (2035F) USD 2.5 billion
CAGR (2025 to 2035) 4.3%

This trend reflects consistent demand in animal feed and biomass sectors, where pellet quality and structural integrity are vital. As livestock industries expand and compound feed volumes rise, binders that enhance pellet durability and nutrient retention gain preference.

The use of these binders in aquafeed and wood biomass processing further diversifies applications. Technological improvements in binder formulation and customized usage in region-specific feed types will support steady gains.

The pellet binders market holds an estimated 1.5-3% share of the global animal feed additives market, which exceeds USD 45 billion. Within the compound feed market, valued over USD 550 billion, pellet binders account for less than 0.5%, primarily serving as processing enhancers rather than nutritional inputs.

In the broader animal nutrition space, their contribution is marginal, around 0.3-0.6%. However, within the feed processing aids segment, pellet binders form a substantial share of 25-30%, as they are critical for improving pellet durability, minimizing fines, and enhancing throughput.

In livestock and aquaculture feed markets, especially for species requiring water-stable pellets like fish and shrimp, pellet binders represent around 3-4% of the segment, reflecting their specialized but essential functional role.

Analyzing Pellet Binders Market by Top Investment Segments

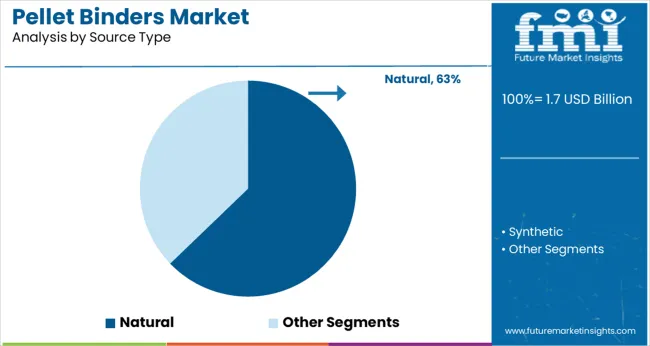
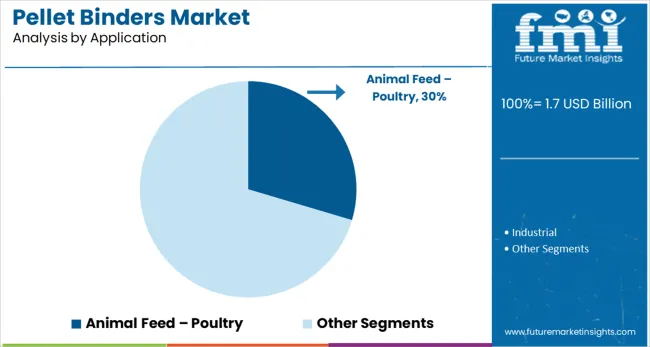
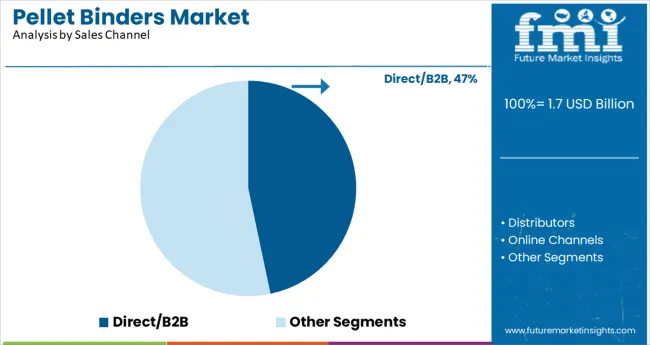
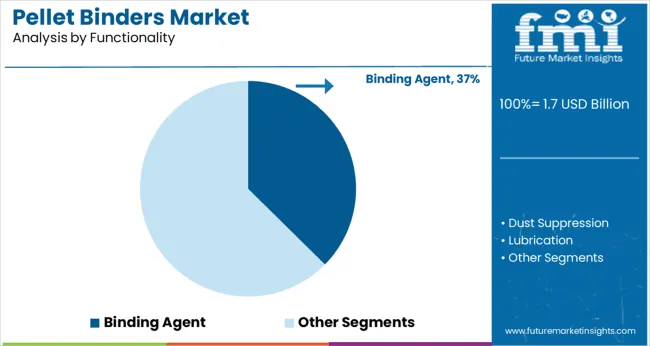
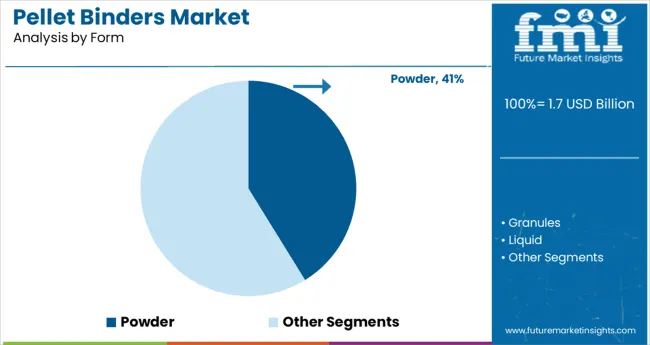
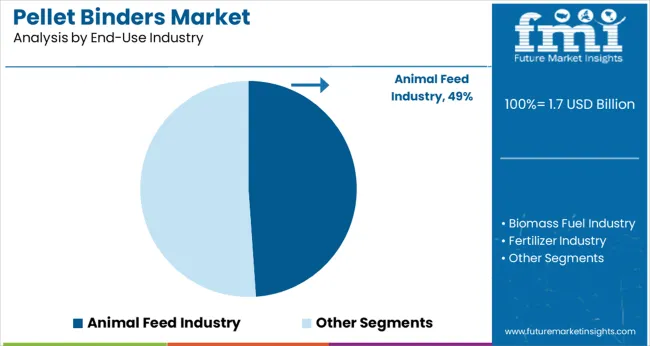
In the pellet binders industry,the largest segment in 2025 is Lignosulfonates with a 33% share, followed by Natural source types at 63%. Poultry leads the Animal Feed application segment with 30%, while Binding Agents dominate functionality with 37%. Powders make up 41% of forms, and Direct/B2B sales channels account for 47%. The Animal Feed industry holds 49% share.
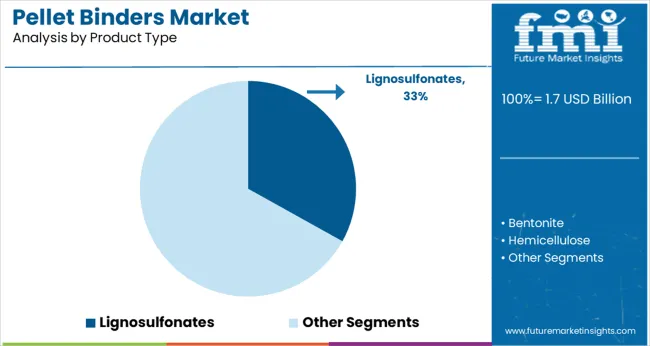
Lignosulfonates in Pellet Binders Market

Pellet Binders Market Analysis By Product Type

Lignosulfonates hold a 33% share in 2025, owing to their high binding efficiency and cost-effectiveness across feed and industrial pellet applications.Increased use in ruminant and poultry feed, especially in Asia and Latin America, from 2025 to 2027.

Rising demand in biomass applications due to superior pellet durability between 2028 and 2030.Innovations in low-dust, heat-stable lignosulfonates supporting higher market penetration in Europe and North America by 2031.
  • Strong demand in animal feed applications, particularly in poultry.
  • Increasing preference for environmentally friendly and natural additives.
  • Significant use in the pelletization process across diverse industries.

Natural Sources to Capture the Largest Share

Pellet Binders Market Analysis By Source Type

Natural sources are expected to account for 63% of the industry share in 2025, driven by growing preferences for non-synthetic, biodegradable binders. Natural binders, particularly lignosulfonates, are gaining traction in aquafeed and pet food applications.

The shift toward natural alternatives is further supported by regulatory pressures in Europe and North America, which encourage cleaner formulations. Companies like Novus International are responding by developing efficient and natural binders. As demand for more environmentally friendly and performance-driven ingredients rises, natural binders are poised for continued growth in both feed and biomass sectors.
  • High preference for natural ingredients in animal nutrition.
  • Increased consumer awareness of natural and safe additives.
  • Regulatory pressures are fostering demand for natural alternatives.

Poultry Feed Drives Largest Application Segment

Pellet Binders Market Analysis By Application

Poultry feed is projected to hold a 30% share of the industry in 2025, driven by its essential role in improving feed efficiency and reducing dust. Large-scale broiler and layer operations, particularly in Asia and Latin America, are expanding the demand for pellet binders. The adoption of precision feeding systems and antibiotic-free poultry approaches in Europe is anticipated to further boost this segment.

Key companies like Cargill and ADM are enhancing their product offerings with tailored binder solutions for poultry feed, which are critical for maintaining pellet quality and ensuring optimal growth in poultry production.
  • Poultry's need for functional additives to boost growth and immunity.
  • Constant demand for effective gut health solutions in poultry feed.
  • Increase in feed efficiency demand contributing to overall industry growth

B2B Sales Model Remains Dominant

Pellet Binders Market Analysis By Sales Channel

Direct/B2B sales are expected to dominate the industry with a 47% share in 2025. This sales model allows feed manufacturers to source in bulk and build long-term relationships with suppliers, ensuring cost-effectiveness and personalized solutions. Strong supplier-integrator partnerships are anticipated to drive growth, particularly between 2025 and 2029.

Additionally, the rise of digital procurement and e-commerce platforms is expected to enhance the B2B model's efficiency. Leading companies like Kemin Industries and Impextraco are strengthening their B2B offerings to cater to this growing demand, providing a secure and streamlined supply chain for large-scale feed producers.
  • Strong reliance on B2B for cost-effective bulk purchasing.
  • Direct relationships facilitate customized solutions for clients.
  • Increased reliance on digital channels for seamless transactions.

Binding Agents to Retain Largest Share in 2025

Pellet Binders Market Analysis By Functionality

Binding agents are projected to account for 37% of the industry in 2025, as they play a critical role in improving pellet stability and feed integrity. These agents are particularly important in livestock feed, where durability and minimal fines are essential for high-quality pellets.

With the growing need for multifunctional binders that offer additional benefits such as improved nutrient retention, demand is expected to increase. Leading companies like Perstorp Group and ADDCON GmbH are enhancing their portfolios to meet these needs, focusing on innovations that improve both texture and mechanical stability in pelletized feed.
  • Crucial for improving pellet stability and feed integrity.
  • Increased focus on reducing feed wastage through improved pelletization.
  • Ongoing innovation in binder formulations to optimize functionality.

Powdered Pellet Binders Lead Form Segment

Pellet Binders Market Analysis By Form

Powdered form is expected to capture 41% of the industry share in 2025 due to its ease of dispersion and compatibility with dry feed mixes. This form is particularly advantageous in poultry, swine, and biomass sectors, where efficient mixing and cost-effective production are critical.

Powdered binders are gaining prominence due to innovations in moisture-resistant and low-dust formulations. Companies like Kemin Industries and Impextraco are expanding their powdered binder product lines to meet growing demand for high-performance, easy-to-use binder solutions in feed and industrial applications.
  • Strong demand in animal feed applications, particularly in poultry.
  • Increasing preference for environmentally friendly and natural additives.
  • Significant use in the pelletization process across diverse industries.

Animal Feed Industry Continues as Major End-Use Segment

Pellet Binders Market Analysis By End Use Industry

The animal feed industry is expected to hold 49% share in 2025. Pellet adhesives are indispensable in enhancing feed processing and pellet handling. Growth in commercial poultry and swine operations is expected to drive demand from 2025 to 2027.

Between 2028 and 2032, the adoption of specialty feed formulations will further increase binder usage, especially in high-performance feeds for aquaculture and pets. Major feed producers like Nutreco and Land O'Lakes are investing in advanced binder solutions to meet the evolving needs of the animal feed sector.

  • Leading role in the demand for customized feed solutions.
  • Growing trend toward specialized nutrition in livestock feeding.
  • Expansion of feed additives' role in improving animal health and productivity.

Pellet Binders Market Dynamics

The industry is shaped by a combination of evolving product demands, raw material dynamics, and technological advancements. As various sectors, particularly the animal feed industry, expand, the need for efficient and high-performance pellet adhesives is intensifying. However, challenges such as raw material price fluctuations and regulatory hurdles continue to pose significant pressures.

Growing Demand for Functional Pellet Binders

The demand for specialized pellet adhesives is being driven by industries prioritizing feed efficiency and stability, particularly in animal feed. The increasing need for customized solutions in sectors like poultry and swine is pushing growth. Innovations in binder formulations that focus on enhancing dust suppression and thermal stability are further increasing their appeal. Manufacturers are focusing on cost-effective alternatives that improve feed performance.

  • Demand is driven by enhanced feed efficiency, particularly in poultry and swine.
  • Starch-based and synthetic binders are gaining popularity.
  • Stability and cost-effectiveness are becoming key in feed production.

Challenges from Raw Material Price Volatility and Regulatory Pressures

Raw material price volatility, particularly for lignosulfonates and bentonites, is elevating production costs in the market. Additionally, growing regulatory measures around feed quality and binder formulation are placing pressure on manufacturers. These regulatory constraints are becoming more stringent in regions with high environmental standards. Increased ingredient costs are challenging profit margins, especially for manufacturers in competitive industries.
  • Lignosulfonates and bentonites face significant price volatility.
  • Regulatory pressures are tightening binder formulation standards.
  • Rising raw material costs are squeezing profit margins in the feed industry.

Top Countries Advancing, Applying, and Scaling Pellet Binder Solutions

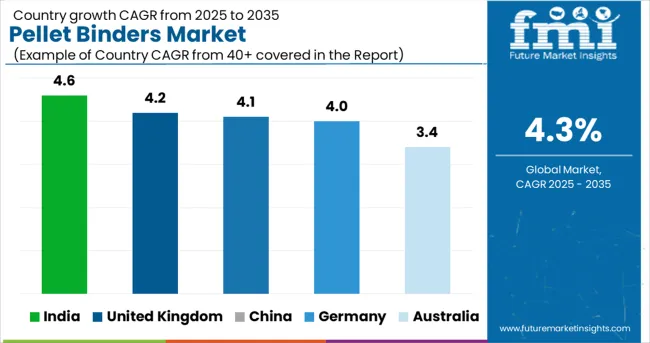
Pellet Binders Market Cagr Analysis By Country

Countries Projected CAGR
India 4.6%
United Kingdom 4.2%
China 4.1%
Germany 4.0%
Australia 3.4%

The report includes analysis of over 40 countries, with five profiled below for reference.

The global pellet binders market is projected to grow at a CAGR of 4.3% from 2025 to 2035. India leads at 4.6%, outperforming the global rate by 0.3 percentage points, supported by expansion in integrated feed operations and rising demand for lignosulfonate-based binders in commercial mills. The United Kingdom follows at 4.2%, driven by modernized feed plants adopting low-dust, high-efficiency binders for aquafeed and monogastric diets.

China and Germany report 4.1% and 4.0% growth respectively, showing strong adoption of synthetic and natural binders to enhance pellet quality and meet throughput targets. In China, binder demand is closely linked to recovery in swine production and capacity upgrades.

Germany focuses on emission-compliant binder systems under EU norms. Australia lags with 3.4% growth due to a preference for mash formats and slower feed mill modernization. These trends highlight divergent binder strategies across BRICS and OECD economies.

In-depth Analysis of Pellet Binders Market in India

The pellet binders market in India is projected to expand at a CAGR of 4.6% between 2025 and 2035. Growth in the market is supported by the increasing need for high-quality feed solutions, especially in the poultry and aquaculture sectors.

The growing adoption of natural binders like lignosulfonates, which provide cost-effectiveness and enhance feed stability, is expected to play a significant role in industry development. Additionally, regulatory improvements related to feed quality are expected to push the demand for efficient binder formulations, positioning India as a key industry for pellet adhesivesin the coming years.

  • The poultry and aquaculture industries are central to market expansion.
  • Natural binders are gaining popularity for their performance and cost-effectiveness.
  • Regulatory changes are expected to favor the adoption of high-quality binders.

Demand Forecast for Pellet Binders Market in the United Kingdom

The pellet binders market in the United Kingdom is estimated to grow at a CAGR of 4.2% between 2025 and 2035. Increased emphasis on feed efficiency and enhanced performance is likely to propel demand for premium-quality binders. Innovations in binder formulations that improve feed output while reducing waste will be crucial to the industry evolution.

With the implementation of more rigorous regulatory standards, manufacturers will likely be inclined to prioritize high-performance binder solutions to ensure compliance and meet growing expectations.

  • Focus on feed efficiency will drive increased demand for advanced binders.
  • Stricter regulations will lead to a preference for higher-quality binder formulations.
  • Demand for improved feed performance will result in continued innovation in binders.

Growth Analysis of Pellet Binders Market in China

Demand for the pellet binders in China is expected to grow at a CAGR of 4.1% between 2025 and 2035. A surge in demand for high-performance animal feed in the poultry and swine industries is expected to fuel the growth of binders. Natural binders such as lignosulfonates are becoming increasingly essential due to their efficiency in improving feed quality.

Government initiatives to boost livestock productivity and ensure food security will likely lead to increased investment in better-quality binder solutions, strengthening the industry prospects in the coming decade.

  • The poultry and swine sectors are key components of the growing binder demand.
  • Natural binders, particularly lignosulfonates, are gaining ground for their effectiveness.
  • Government-led initiatives to improve livestock productivity are expected to escalate the need for high-quality binders.

Future Outlook for Pellet Binders Market in Germany

The sale of pellet binders in Germany is forecasted to experience a CAGR of 4.0% from 2025 to 2035. With stringent feed regulations and a heightened focus on animal welfare, there is an increased push for higher-quality, safer feed solutions.

Innovations in binder formulations, such as moisture-resistant and dust-free options, are expected to be more widely adopted. The industry is likely to see strong growth due to a continued focus on optimizing feed efficiency and improving binder performance across the agricultural and industrial sectors.

  • Regulatory pressures will encourage the adoption of higher-quality binders.
  • Binder innovations focusing on moisture resistance and dust reduction will gain popularity.
  • Feed efficiency improvements will continue to drive demand for advanced binder solutions.

Pellet Binders Market Growth Outlook in Australia

Demand for pellet binders in Australia is anticipated to grow at a CAGR of 3.4% between 2025 and 2035. The country’s emphasis on renewable energy and cleaner energy sources is expected to increase demand for biomass pellets, subsequently boosting the binder industry.

The poultry and aquaculture sectors will continue to prioritize high-efficiency feed solutions. As industries seek to enhance feed performance, demand for functional binders that improve feed stability and reduce waste will continue to rise, supporting growth in the market.

  • Biomass pellet demand will contribute to binder industry expansion in Australia.
  • The poultry and aquaculture industries will remain central to binder growth.
  • Functional binder solutions that improve feed efficiency will see higher demand.

Competitive Landscape of the Pellet Binders Market

Pellet Binders Market Analysis By Company (2)

In the pellet binders market, leading companies are focusing on growth through product innovation, regional expansion, and improving supply chain efficiencies. Key players like Borregaard (LignoTech), Uniscope Inc., and FMC Corporation are actively enhancing their portfolios with advanced binder solutions, particularly for the animal feed and biomass sectors. Their strategies revolve around developing natural alternatives to synthetic binders, with a focus on improving stability, thermal resistance, and cost-efficiency.

Companies like Danisco (IFF - International Flavors & Fragrances) and Kemin Industries are leveraging their strong R&D capabilities to introduce customized binder solutions for specific applications, including poultry, swine, and aquaculture.

They are also strengthening their presence in emerging markets like Asia and Latin America by targeting expanding industrial and agricultural sectors. Additionally, some regional players are focusing on offering low-dust, moisture-resistant binders, catering to specific regulatory and environmental needs.

Leading Company - Borregaard ASAIndustry Share - 35%

Recent Industry News

  • In June 2024, IFF’s Danisco Animal Nutrition & Health unit received EU-wide regulatory approval for two innovative poultry feed solutions: Axtra® XAP, a multi-enzyme blend, and Syncra® AVI, an enzyme-probiotic complex. These solutions are designed to meet the challenges of modern poultry production, delivering significant technical and economic performance improvements in poultry feeds.

Leading Companies in Pellet Binders Market

  • Borregaard (LignoTech)
  • Uniscope Inc.
  • FMC Corporation
  • Danisco (IFF - International Flavors & Fragrances)
  • Kemin Industries

Research Coverage and Scope Summary

Report Attributes Details
Market Size (2025) USD 1.7 billion
Projected Market Size (2035) USD 2.5 billion
CAGR (2025 to 2035) 4.3%
Base Year for Estimation 2024
Historical Period 2020 to 2024
Projections Period 2025 to 2035
Quantitative Units USD billion for value and thousand metric tons for volume
Product Types Analyzed (Segment 1) Lignosulfonates, Bentonite, Hemicellulose, Molasses, Carboxymethylcellulose (CMC), Starch-based Binders, Clay-based Binders, Synthetic Binders
Source Types Analyzed (Segment 2) Natural, Synthetic
Applications Analyzed (Segment 3) Animal Feed (Poultry, Swine, Ruminants, Aquaculture, Pets), Industrial Applications (Fertilizers, Biomass Fuels)
Functionalities Analyzed (Segment 4) Binding Agents, Dust Suppression, Lubrication, Thermal Stability
Forms Analyzed (Segment 5) Powder, Granules, Liquid
Sales Channels Analyzed (Segment 6) Direct/B2B, Distributors, Online Channels
End-Use Industries Analyzed (Segment 7) Animal Feed, Biomass Fuel, Fertilizer
Regions Covered North America, Europe, East Asia, South Asia & Pacific, Latin America, Middle East & Africa
Countries Covered United States, Canada, Germany, United Kingdom, France, Italy, Spain, China, India, Japan, South Korea, Australia, Brazil, Mexico, Argentina, Saudi Arabia, UAE, South Africa
Key Players Borregaard (LignoTech), Uniscope Inc., FMC Corporation, Danisco (IFF - International Flavors & Fragrances), Kemin Industries
Additional Attributes Dollar sales, share by binder type and end-use, demand growth in animal feed and biomass fuel, shift toward natural binding agents, regional industrial application trends, formulation compatibility improvements

Key Segments

By Product Type:

The segment includes Lignosulfonates, Bentonite, Hemicellulose, Molasses, Carboxymethylcellulose (CMC), Starch-based Binders, Clay-based Binders, and Synthetic Binders.

By Source Type:

This includes Natural and Synthetic sources, with each playing a crucial role in product quality and application suitability.

By Application:

The segment covers Animal Feed (Poultry, Swine, Ruminants, Aquaculture, Pets), Industrial applications (e.g., fertilizers, biomass fuels).

By Functionality:

This segment includes Binding Agents, Dust Suppression, Lubrication, and Thermal Stability functionalities.

By Form:

The segment is categorized into Powder, Granules, and Liquid forms, offering versatility in application.

By Sales Channel:

The industry is segmented into Direct/B2B, Distributors, and Online Channels.

By End-Use Industry:

Key end-use industries include Animal Feed, Biomass Fuel, and Fertilizer industries.

By Region:

Regional analysis covers North America, Europe, East Asia, South Asia & Pacific, Latin America, and Middle East & Africa.

Table of Content

  1. Executive Summary
    • Global Market Outlook
    • Demand-side Trends
    • Supply-side Trends
    • Technology Roadmap Analysis
    • Analysis and Recommendations
  2. Market Overview
    • Market Coverage / Taxonomy
    • Market Definition / Scope / Limitations
  3. Market Background
    • Market Dynamics
      • Drivers
      • Restraints
      • Opportunity
      • Trends
    • Scenario Forecast
      • Demand in Optimistic Scenario
      • Demand in Likely Scenario
      • Demand in Conservative Scenario
    • Opportunity Map Analysis
    • Product Life Cycle Analysis
    • Supply Chain Analysis
      • Supply Side Participants and their Roles
        • Producers
        • Mid-Level Participants (Traders/ Agents/ Brokers)
        • Wholesalers and Distributors
      • Value Added and Value Created at Node in the Supply Chain
      • List of Raw Material Suppliers
      • List of Existing and Potential Buyer’s
    • Investment Feasibility Matrix
    • Value Chain Analysis
      • Profit Margin Analysis
      • Wholesalers and Distributors
      • Retailers
    • PESTLE and Porter’s Analysis
    • Regulatory Landscape
      • By Key Regions
      • By Key Countries
    • Regional Parent Market Outlook
    • Production and Consumption Statistics
    • Import and Export Statistics
  4. Global Market Analysis 2020 to 2024 and Forecast, 2025 to 2035
    • Historical Market Size Value (USD Billion) & Volume (Thousand Metric Tons) Analysis, 2020 to 2024
    • Current and Future Market Size Value (USD Billion) & Volume (Thousand Metric Tons) Projections, 2025 to 2035
      • Y-o-Y Growth Trend Analysis
      • Absolute $ Opportunity Analysis
  5. Global Market Pricing Analysis 2020 to 2024 and Forecast 2025 to 2035
  6. Global Market Analysis 2020 to 2024 and Forecast 2025 to 2035, By Product Type
    • Introduction / Key Findings
    • Historical Market Size Value (USD Billion) & Volume (Thousand Metric Tons) Analysis by Product Type, 2020 to 2024
    • Current and Future Market Size Value (USD Billion) & Volume (Thousand Metric Tons) Analysis and Forecast by Product Type, 2025 to 2035
      • Lignosulfonates
      • Bentonite
      • Hemicellulose
      • Molasses
      • Carboxymethylcellulose (CMC)
      • Starch-based Binders
      • Clay-based Binders
      • Synthetic Binders
    • Y-o-Y Growth Trend Analysis By Product Type, 2020 to 2024
    • Absolute $ Opportunity Analysis By Product Type, 2025 to 2035
  7. Global Market Analysis 2020 to 2024 and Forecast 2025 to 2035, By Source Type
    • Introduction / Key Findings
    • Historical Market Size Value (USD Billion) & Volume (Thousand Metric Tons) Analysis By Source Type, 2020 to 2024
    • Current and Future Market Size Value (USD Billion) & Volume (Thousand Metric Tons) Analysis and Forecast By Source Type, 2025 to 2035
      • Natural
      • Synthetic
    • Y-o-Y Growth Trend Analysis By Source Type, 2020 to 2024
    • Absolute $ Opportunity Analysis By Source Type, 2025 to 2035
  8. Global Market Analysis 2020 to 2024 and Forecast 2025 to 2035, By Application
    • Introduction / Key Findings
    • Historical Market Size Value (USD Billion) & Volume (Thousand Metric Tons) Analysis By Application, 2020 to 2024
    • Current and Future Market Size Value (USD Billion) & Volume (Thousand Metric Tons) Analysis and Forecast By Application, 2025 to 2035
      • Animal Feed
        • Poultry
        • Swine
        • Ruminants
        • Aquaculture
        • Pets
      • Industrial
        • Fertilizers
        • Biomass Fuels
    • Y-o-Y Growth Trend Analysis By Application, 2020 to 2024
    • Absolute $ Opportunity Analysis By Application, 2025 to 2035
  9. Global Market Analysis 2020 to 2024 and Forecast 2025 to 2035, By Functionality
    • Introduction / Key Findings
    • Historical Market Size Value (USD Billion) & Volume (Thousand Metric Tons) Analysis By Functionality, 2020 to 2024
    • Current and Future Market Size Value (USD Billion) & Volume (Thousand Metric Tons) Analysis and Forecast By Functionality, 2025 to 2035
      • Binding Agent
      • Dust Suppression
      • Lubrication
      • Thermal Stability
    • Y-o-Y Growth Trend Analysis By Functionality, 2020 to 2024
    • Absolute $ Opportunity Analysis By Functionality, 2025 to 2035
  10. Global Market Analysis 2020 to 2024 and Forecast 2025 to 2035, By Form
    • Introduction / Key Findings
    • Historical Market Size Value (USD Billion) & Volume (Thousand Metric Tons) Analysis By Form, 2020 to 2024
    • Current and Future Market Size Value (USD Billion) & Volume (Thousand Metric Tons) Analysis and Forecast By Form, 2025 to 2035
      • Powder
      • Granules
      • Liquid
    • Y-o-Y Growth Trend Analysis By Form, 2020 to 2024
    • Absolute $ Opportunity Analysis By Form, 2025 to 2035
  11. Global Market Analysis 2020 to 2024 and Forecast 2025 to 2035, By Sales Channel
    • Introduction / Key Findings
    • Historical Market Size Value (USD Billion) & Volume (Thousand Metric Tons) Analysis By Sales Channel, 2020 to 2024
    • Current and Future Market Size Value (USD Billion) & Volume (Thousand Metric Tons) Analysis and Forecast By Sales Channel, 2025 to 2035
      • Direct/B2B
      • Distributors
      • Online Channels
    • Y-o-Y Growth Trend Analysis By Sales Channel, 2020 to 2024
    • Absolute $ Opportunity Analysis By Sales Channel, 2025 to 2035
  12. Global Market Analysis 2020 to 2024 and Forecast 2025 to 2035, By End-Use Industry
    • Introduction / Key Findings
    • Historical Market Size Value (USD Billion) & Volume (Thousand Metric Tons) Analysis By End-Use Industry, 2020 to 2024
    • Current and Future Market Size Value (USD Billion) & Volume (Thousand Metric Tons) Analysis and Forecast By End-Use Industry, 2025 to 2035
      • Animal Feed Industry
      • Biomass Fuel Industry
      • Fertilizer Industry
    • Y-o-Y Growth Trend Analysis By End-Use Industry, 2020 to 2024
    • Absolute $ Opportunity Analysis By End-Use Industry, 2025 to 2035
  13. Global Market Analysis 2020 to 2024 and Forecast 2025 to 2035, By Region
    • Introduction
    • Historical Market Size Value (USD Billion) & Volume (Thousand Metric Tons) Analysis By Region, 2020 to 2024
    • Current Market Size Value (USD Billion) & Volume (Thousand Metric Tons) Analysis and Forecast By Region, 2025 to 2035
      • North America
      • Latin America
      • Western Europe
      • Eastern Europe
      • East Asia
      • South Asia & Pacific
      • Middle East and Africa
    • Market Attractiveness Analysis By Region
  14. North America Market Analysis 2020 to 2024 and Forecast 2025 to 2035, By Country
    • Historical Market Size Value (USD Billion) & Volume (Thousand Metric Tons) Trend Analysis By Market Taxonomy, 2020 to 2024
    • Market Size Value (USD Billion) & Volume (Thousand Metric Tons) Forecast By Market Taxonomy, 2025 to 2035
      • By Country
        • U.S.
        • Canada
        • Mexico
      • By Product Type
      • By Source Type
      • By Application
      • By Functionality
      • By Form
      • By Sales Channel
      • By End-Use Industry
    • Market Attractiveness Analysis
      • By Country
      • By Product Type
      • By Source Type
      • By Application
      • By Functionality
      • By Form
      • By Sales Channel
      • By End-Use Industry
    • Key Takeaways
  15. Latin America Market Analysis 2020 to 2024 and Forecast 2025 to 2035, By Country
    • Historical Market Size Value (USD Billion) & Volume (Thousand Metric Tons) Trend Analysis By Market Taxonomy, 2020 to 2024
    • Market Size Value (USD Billion) & Volume (Thousand Metric Tons) Forecast By Market Taxonomy, 2025 to 2035
      • By Country
        • Brazil
        • Argentina
        • Rest of LATAM
      • By Product Type
      • By Source Type
      • By Application
      • By Functionality
      • By Form
      • By Sales Channel
      • By End-Use Industry
    • Market Attractiveness Analysis
      • By Country
      • By Product Type
      • By Source Type
      • By Application
      • By Functionality
      • By Form
      • By Sales Channel
      • By End-Use Industry
    • Key Takeaways
  16. Western Europe Market Analysis 2020 to 2024 and Forecast 2025 to 2035, By Country
    • Historical Market Size Value (USD Billion) & Volume (Thousand Metric Tons) Trend Analysis By Market Taxonomy, 2020 to 2024
    • Market Size Value (USD Billion) & Volume (Thousand Metric Tons) Forecast By Market Taxonomy, 2025 to 2035
      • By Country
        • Germany
        • Italy
        • France
        • UK
        • Spain
        • BENELUX
        • Nordic
        • Rest of W.Europe
      • By Product Type
      • By Source Type
      • By Application
      • By Functionality
      • By Form
      • By Sales Channel
      • By End-Use Industry
    • Market Attractiveness Analysis
      • By Country
      • By Product Type
      • By Source Type
      • By Application
      • By Functionality
      • By Form
      • By Sales Channel
      • By End-Use Industry
    • Key Takeaways
  17. Eastern Europe Market Analysis 2020 to 2024 and Forecast 2025 to 2035, By Country
    • Historical Market Size Value (USD Billion) & Volume (Thousand Metric Tons) Trend Analysis By Market Taxonomy, 2020 to 2024
    • Market Size Value (USD Billion) & Volume (Thousand Metric Tons) Forecast By Market Taxonomy, 2025 to 2035
      • By Country
        • Russia
        • Hungary
        • Poland
        • Balkan & Baltics
        • Rest of E. Europe
      • By Product Type
      • By Source Type
      • By Application
      • By Functionality
      • By Form
      • By Sales Channel
      • By End-Use Industry
    • Market Attractiveness Analysis
      • By Country
      • By Product Type
      • By Source Type
      • By Application
      • By Functionality
      • By Form
      • By Sales Channel
      • By End-Use Industry
    • Key Takeaways
  18. East Asia Market Analysis 2020 to 2024 and Forecast 2025 to 2035, By Country
    • Historical Market Size Value (USD Billion) & Volume (Thousand Metric Tons) Trend Analysis By Market Taxonomy, 2020 to 2024
    • Market Size Value (USD Billion) & Volume (Thousand Metric Tons) Forecast By Market Taxonomy, 2025 to 2035
      • By Country
        • China
        • Japan
        • South Korea
      • By Product Type
      • By Source Type
      • By Application
      • By Functionality
      • By Form
      • By Sales Channel
      • By End-Use Industry
    • Market Attractiveness Analysis
      • By Country
      • By Product Type
      • By Source Type
      • By Application
      • By Functionality
      • By Form
      • By Sales Channel
      • By End-Use Industry
    • Key Takeaways
  19. South Asia & Pacific Market Analysis 2020 to 2024 and Forecast 2025 to 2035, By Country
    • Historical Market Size Value (USD Billion) & Volume (Thousand Metric Tons) Trend Analysis By Market Taxonomy, 2020 to 2024
    • Market Size Value (USD Billion) & Volume (Thousand Metric Tons) Forecast By Market Taxonomy, 2025 to 2035
      • By Country
        • India
        • Australia & New Zealand
        • ASEAN
        • Rest of SAP
      • By Product Type
      • By Source Type
      • By Application
      • By Functionality
      • By Form
      • By Sales Channel
      • By End-Use Industry
    • Market Attractiveness Analysis
      • By Country
      • By Product Type
      • By Source Type
      • By Application
      • By Functionality
      • By Form
      • By Sales Channel
      • By End-Use Industry
    • Key Takeaways
  20. Middle East and Africa Market Analysis 2020 to 2024 and Forecast 2025 to 2035, By Country
    • Historical Market Size Value (USD Billion) & Volume (Thousand Metric Tons) Trend Analysis By Market Taxonomy, 2020 to 2024
    • Market Size Value (USD Billion) & Volume (Thousand Metric Tons) Forecast By Market Taxonomy, 2025 to 2035
      • By Country
        • GCC Countries
        • Northern Africa
        • South Africa
        • Turkiye
        • Rest of MEA
      • By Product Type
      • By Source Type
      • By Application
      • By Functionality
      • By Form
      • By Sales Channel
      • By End-Use Industry
    • Market Attractiveness Analysis
      • By Country
      • By Product Type
      • By Source Type
      • By Application
      • By Functionality
      • By Form
      • By Sales Channel
      • By End-Use Industry
    • Key Takeaways
  21. Key Countries Market Analysis
    • U.S.
      • Pricing Analysis
      • Market Share Analysis, 2024
        • By Product Type
        • By Source Type
        • By Application
        • By Functionality
        • By Form
        • By Sales Channel
        • By End-Use Industry
    • Canada
      • Pricing Analysis
      • Market Share Analysis, 2024
        • By Product Type
        • By Source Type
        • By Application
        • By Functionality
        • By Form
        • By Sales Channel
        • By End-Use Industry
    • Brazil
      • Pricing Analysis
      • Market Share Analysis, 2024
        • By Product Type
        • By Source Type
        • By Application
        • By Functionality
        • By Form
        • By Sales Channel
        • By End-Use Industry
    • Mexico
      • Pricing Analysis
      • Market Share Analysis, 2024
        • By Product Type
        • By Source Type
        • By Application
        • By Functionality
        • By Form
        • By Sales Channel
        • By End-Use Industry
    • Argentina
      • Pricing Analysis
      • Market Share Analysis, 2024
        • By Product Type
        • By Source Type
        • By Application
        • By Functionality
        • By Form
        • By Sales Channel
        • By End-Use Industry
  22. Market Structure Analysis
    • Competition Dashboard
    • Competition Benchmarking
    • Market Share Analysis of Top Players
      • By Regional
      • By Product Type
      • By Source Type
      • By Application
      • By Functionality
      • By Form
      • By Sales Channel
      • By End-Use Industry
  23. Competition Analysis
    • Competition Deep Dive
      • Borregaard (LignoTech)
        • Overview
        • Product Portfolio
        • Profitability by Market Segments (Product/Age /Sales Channel/Region)
        • Sales Footprint
        • Strategy Overview
          • Marketing Strategy
          • Product Strategy
          • Channel Strategy
      • Uniscope Inc.
        • Overview
        • Product Portfolio
        • Profitability by Market Segments (Product/Age /Sales Channel/Region)
        • Sales Footprint
        • Strategy Overview
          • Marketing Strategy
          • Product Strategy
          • Channel Strategy
      • FMC Corporation
        • Overview
        • Product Portfolio
        • Profitability by Market Segments (Product/Age /Sales Channel/Region)
        • Sales Footprint
        • Strategy Overview
          • Marketing Strategy
          • Product Strategy
          • Channel Strategy
      • Danisco (IFF - International Flavors & Fragrances)
        • Overview
        • Product Portfolio
        • Profitability by Market Segments (Product/Age /Sales Channel/Region)
        • Sales Footprint
        • Strategy Overview
          • Marketing Strategy
          • Product Strategy
          • Channel Strategy
      • Kemin Industries
        • Overview
        • Product Portfolio
        • Profitability by Market Segments (Product/Age /Sales Channel/Region)
        • Sales Footprint
        • Strategy Overview
          • Marketing Strategy
          • Product Strategy
          • Channel Strategy
  24. Assumptions & Acronyms Used
  25. Research Methodology

List of Tables

  • Table 1: Global Market Value (USD Billion) Forecast by Region, 2020-2035
  • Table 2: Global Market Volume (Thousand Metric Tons) Forecast by Region, 2020-2035
  • Table 3: Global Market Value (USD Billion) Forecast by Product Type, 2020-2035
  • Table 4: Global Market Volume (Thousand Metric Tons) Forecast by Product Type, 2020-2035
  • Table 5: Global Market Value (USD Billion) Forecast by Source Type, 2020-2035
  • Table 6: Global Market Volume (Thousand Metric Tons) Forecast by Source Type, 2020-2035
  • Table 7: Global Market Value (USD Billion) Forecast by Application, 2020-2035
  • Table 8: Global Market Volume (Thousand Metric Tons) Forecast by Application, 2020-2035
  • Table 9: Global Market Value (USD Billion) Forecast by Functionality, 2020-2035
  • Table 10: Global Market Volume (Thousand Metric Tons) Forecast by Functionality, 2020-2035
  • Table 11: Global Market Value (USD Billion) Forecast by Form, 2020-2035
  • Table 12: Global Market Volume (Thousand Metric Tons) Forecast by Form, 2020-2035
  • Table 13: Global Market Value (USD Billion) Forecast by Sales Channel, 2020-2035
  • Table 14: Global Market Volume (Thousand Metric Tons) Forecast by Sales Channel, 2020-2035
  • Table 15: Global Market Value (USD Billion) Forecast by End-Use Industry, 2020-2035
  • Table 16: Global Market Volume (Thousand Metric Tons) Forecast by End-Use Industry, 2020-2035
  • Table 17: North America Market Value (USD Billion) Forecast by Country, 2020-2035
  • Table 18: North America Market Volume (Thousand Metric Tons) Forecast by Country, 2020-2035
  • Table 19: North America Market Value (USD Billion) Forecast by Product Type, 2020-2035
  • Table 20: North America Market Volume (Thousand Metric Tons) Forecast by Product Type, 2020-2035
  • Table 21: North America Market Value (USD Billion) Forecast by Source Type, 2020-2035
  • Table 22: North America Market Volume (Thousand Metric Tons) Forecast by Source Type, 2020-2035
  • Table 23: North America Market Value (USD Billion) Forecast by Application, 2020-2035
  • Table 24: North America Market Volume (Thousand Metric Tons) Forecast by Application, 2020-2035
  • Table 25: North America Market Value (USD Billion) Forecast by Functionality, 2020-2035
  • Table 26: North America Market Volume (Thousand Metric Tons) Forecast by Functionality, 2020-2035
  • Table 27: North America Market Value (USD Billion) Forecast by Form, 2020-2035
  • Table 28: North America Market Volume (Thousand Metric Tons) Forecast by Form, 2020-2035
  • Table 29: North America Market Value (USD Billion) Forecast by Sales Channel, 2020-2035
  • Table 30: North America Market Volume (Thousand Metric Tons) Forecast by Sales Channel, 2020-2035
  • Table 31: North America Market Value (USD Billion) Forecast by End-Use Industry, 2020-2035
  • Table 32: North America Market Volume (Thousand Metric Tons) Forecast by End-Use Industry, 2020-2035
  • Table 33: Latin America Market Value (USD Billion) Forecast by Country, 2020-2035
  • Table 34: Latin America Market Volume (Thousand Metric Tons) Forecast by Country, 2020-2035
  • Table 35: Latin America Market Value (USD Billion) Forecast by Product Type, 2020-2035
  • Table 36: Latin America Market Volume (Thousand Metric Tons) Forecast by Product Type, 2020-2035
  • Table 37: Latin America Market Value (USD Billion) Forecast by Source Type, 2020-2035
  • Table 38: Latin America Market Volume (Thousand Metric Tons) Forecast by Source Type, 2020-2035
  • Table 39: Latin America Market Value (USD Billion) Forecast by Application, 2020-2035
  • Table 40: Latin America Market Volume (Thousand Metric Tons) Forecast by Application, 2020-2035
  • Table 41: Latin America Market Value (USD Billion) Forecast by Functionality, 2020-2035
  • Table 42: Latin America Market Volume (Thousand Metric Tons) Forecast by Functionality, 2020-2035
  • Table 43: Latin America Market Value (USD Billion) Forecast by Form, 2020-2035
  • Table 44: Latin America Market Volume (Thousand Metric Tons) Forecast by Form, 2020-2035
  • Table 45: Latin America Market Value (USD Billion) Forecast by Sales Channel, 2020-2035
  • Table 46: Latin America Market Volume (Thousand Metric Tons) Forecast by Sales Channel, 2020-2035
  • Table 47: Latin America Market Value (USD Billion) Forecast by End-Use Industry, 2020-2035
  • Table 48: Latin America Market Volume (Thousand Metric Tons) Forecast by End-Use Industry, 2020-2035
  • Table 49: Western Europe Market Value (USD Billion) Forecast by Country, 2020-2035
  • Table 50: Western Europe Market Volume (Thousand Metric Tons) Forecast by Country, 2020-2035
  • Table 51: Western Europe Market Value (USD Billion) Forecast by Product Type, 2020-2035
  • Table 52: Western Europe Market Volume (Thousand Metric Tons) Forecast by Product Type, 2020-2035
  • Table 53: Western Europe Market Value (USD Billion) Forecast by Source Type, 2020-2035
  • Table 54: Western Europe Market Volume (Thousand Metric Tons) Forecast by Source Type, 2020-2035
  • Table 55: Western Europe Market Value (USD Billion) Forecast by Application, 2020-2035
  • Table 56: Western Europe Market Volume (Thousand Metric Tons) Forecast by Application, 2020-2035
  • Table 57: Western Europe Market Value (USD Billion) Forecast by Functionality, 2020-2035
  • Table 58: Western Europe Market Volume (Thousand Metric Tons) Forecast by Functionality, 2020-2035
  • Table 59: Western Europe Market Value (USD Billion) Forecast by Form, 2020-2035
  • Table 60: Western Europe Market Volume (Thousand Metric Tons) Forecast by Form, 2020-2035
  • Table 61: Western Europe Market Value (USD Billion) Forecast by Sales Channel, 2020-2035
  • Table 62: Western Europe Market Volume (Thousand Metric Tons) Forecast by Sales Channel, 2020-2035
  • Table 63: Western Europe Market Value (USD Billion) Forecast by End-Use Industry, 2020-2035
  • Table 64: Western Europe Market Volume (Thousand Metric Tons) Forecast by End-Use Industry, 2020-2035
  • Table 65: Eastern Europe Market Value (USD Billion) Forecast by Country, 2020-2035
  • Table 66: Eastern Europe Market Volume (Thousand Metric Tons) Forecast by Country, 2020-2035
  • Table 67: Eastern Europe Market Value (USD Billion) Forecast by Product Type, 2020-2035
  • Table 68: Eastern Europe Market Volume (Thousand Metric Tons) Forecast by Product Type, 2020-2035
  • Table 69: Eastern Europe Market Value (USD Billion) Forecast by Source Type, 2020-2035
  • Table 70: Eastern Europe Market Volume (Thousand Metric Tons) Forecast by Source Type, 2020-2035
  • Table 71: Eastern Europe Market Value (USD Billion) Forecast by Application, 2020-2035
  • Table 72: Eastern Europe Market Volume (Thousand Metric Tons) Forecast by Application, 2020-2035
  • Table 73: Eastern Europe Market Value (USD Billion) Forecast by Functionality, 2020-2035
  • Table 74: Eastern Europe Market Volume (Thousand Metric Tons) Forecast by Functionality, 2020-2035
  • Table 75: Eastern Europe Market Value (USD Billion) Forecast by Form, 2020-2035
  • Table 76: Eastern Europe Market Volume (Thousand Metric Tons) Forecast by Form, 2020-2035
  • Table 77: Eastern Europe Market Value (USD Billion) Forecast by Sales Channel, 2020-2035
  • Table 78: Eastern Europe Market Volume (Thousand Metric Tons) Forecast by Sales Channel, 2020-2035
  • Table 79: Eastern Europe Market Value (USD Billion) Forecast by End-Use Industry, 2020-2035
  • Table 80: Eastern Europe Market Volume (Thousand Metric Tons) Forecast by End-Use Industry, 2020-2035
  • Table 81: East Asia Market Value (USD Billion) Forecast by Country, 2020-2035
  • Table 82: East Asia Market Volume (Thousand Metric Tons) Forecast by Country, 2020-2035
  • Table 83: East Asia Market Value (USD Billion) Forecast by Product Type, 2020-2035
  • Table 84: East Asia Market Volume (Thousand Metric Tons) Forecast by Product Type, 2020-2035
  • Table 85: East Asia Market Value (USD Billion) Forecast by Source Type, 2020-2035
  • Table 86: East Asia Market Volume (Thousand Metric Tons) Forecast by Source Type, 2020-2035
  • Table 87: East Asia Market Value (USD Billion) Forecast by Application, 2020-2035
  • Table 88: East Asia Market Volume (Thousand Metric Tons) Forecast by Application, 2020-2035
  • Table 89: East Asia Market Value (USD Billion) Forecast by Functionality, 2020-2035
  • Table 90: East Asia Market Volume (Thousand Metric Tons) Forecast by Functionality, 2020-2035
  • Table 91: East Asia Market Value (USD Billion) Forecast by Form, 2020-2035
  • Table 92: East Asia Market Volume (Thousand Metric Tons) Forecast by Form, 2020-2035
  • Table 93: East Asia Market Value (USD Billion) Forecast by Sales Channel, 2020-2035
  • Table 94: East Asia Market Volume (Thousand Metric Tons) Forecast by Sales Channel, 2020-2035
  • Table 95: East Asia Market Value (USD Billion) Forecast by End-Use Industry, 2020-2035
  • Table 96: East Asia Market Volume (Thousand Metric Tons) Forecast by End-Use Industry, 2020-2035
  • Table 97: South Asia & Pacific Market Value (USD Billion) Forecast by Country, 2020-2035
  • Table 98: South Asia & Pacific Market Volume (Thousand Metric Tons) Forecast by Country, 2020-2035
  • Table 99: South Asia & Pacific Market Value (USD Billion) Forecast by Product Type, 2020-2035
  • Table 100: South Asia & Pacific Market Volume (Thousand Metric Tons) Forecast by Product Type, 2020-2035
  • Table 101: South Asia & Pacific Market Value (USD Billion) Forecast by Source Type, 2020-2035
  • Table 102: South Asia & Pacific Market Volume (Thousand Metric Tons) Forecast by Source Type, 2020-2035
  • Table 103: South Asia & Pacific Market Value (USD Billion) Forecast by Application, 2020-2035
  • Table 104: South Asia & Pacific Market Volume (Thousand Metric Tons) Forecast by Application, 2020-2035
  • Table 105: South Asia & Pacific Market Value (USD Billion) Forecast by Functionality, 2020-2035
  • Table 106: South Asia & Pacific Market Volume (Thousand Metric Tons) Forecast by Functionality, 2020-2035
  • Table 107: South Asia & Pacific Market Value (USD Billion) Forecast by Form, 2020-2035
  • Table 108: South Asia & Pacific Market Volume (Thousand Metric Tons) Forecast by Form, 2020-2035
  • Table 109: South Asia & Pacific Market Value (USD Billion) Forecast by Sales Channel, 2020-2035
  • Table 110: South Asia & Pacific Market Volume (Thousand Metric Tons) Forecast by Sales Channel, 2020-2035
  • Table 111: South Asia & Pacific Market Value (USD Billion) Forecast by End-Use Industry, 2020-2035
  • Table 112: South Asia & Pacific Market Volume (Thousand Metric Tons) Forecast by End-Use Industry, 2020-2035
  • Table 113: Middle East and Africa Market Value (USD Billion) Forecast by Country, 2020-2035
  • Table 114: Middle East and Africa Market Volume (Thousand Metric Tons) Forecast by Country, 2020-2035
  • Table 115: Middle East and Africa Market Value (USD Billion) Forecast by Product Type, 2020-2035
  • Table 116: Middle East and Africa Market Volume (Thousand Metric Tons) Forecast by Product Type, 2020-2035
  • Table 117: Middle East and Africa Market Value (USD Billion) Forecast by Source Type, 2020-2035
  • Table 118: Middle East and Africa Market Volume (Thousand Metric Tons) Forecast by Source Type, 2020-2035
  • Table 119: Middle East and Africa Market Value (USD Billion) Forecast by Application, 2020-2035
  • Table 120: Middle East and Africa Market Volume (Thousand Metric Tons) Forecast by Application, 2020-2035
  • Table 121: Middle East and Africa Market Value (USD Billion) Forecast by Functionality, 2020-2035
  • Table 122: Middle East and Africa Market Volume (Thousand Metric Tons) Forecast by Functionality, 2020-2035
  • Table 123: Middle East and Africa Market Value (USD Billion) Forecast by Form, 2020-2035
  • Table 124: Middle East and Africa Market Volume (Thousand Metric Tons) Forecast by Form, 2020-2035
  • Table 125: Middle East and Africa Market Value (USD Billion) Forecast by Sales Channel, 2020-2035
  • Table 126: Middle East and Africa Market Volume (Thousand Metric Tons) Forecast by Sales Channel, 2020-2035
  • Table 127: Middle East and Africa Market Value (USD Billion) Forecast by End-Use Industry, 2020-2035
  • Table 128: Middle East and Africa Market Volume (Thousand Metric Tons) Forecast by End-Use Industry, 2020-2035

List of Figures

  • Figure 1: Global Market Volume (Thousand Metric Tons) Forecast 2020-2035
  • Figure 2: Global Market Pricing Analysis
  • Figure 3: Global Market Value (USD Billion) Forecast 2020-2035
  • Figure 4: Global Market Value Share and BPS Analysis by Product Type, 2025 and 2035
  • Figure 5: Global Market Y-o-Y Growth Comparison by Product Type, 2025-2035
  • Figure 6: Global Market Attractiveness Analysis by Product Type
  • Figure 7: Global Market Value Share and BPS Analysis by Source Type, 2025 and 2035
  • Figure 8: Global Market Y-o-Y Growth Comparison by Source Type, 2025-2035
  • Figure 9: Global Market Attractiveness Analysis by Source Type
  • Figure 10: Global Market Value Share and BPS Analysis by Application, 2025 and 2035
  • Figure 11: Global Market Y-o-Y Growth Comparison by Application, 2025-2035
  • Figure 12: Global Market Attractiveness Analysis by Application
  • Figure 13: Global Market Value Share and BPS Analysis by Functionality, 2025 and 2035
  • Figure 14: Global Market Y-o-Y Growth Comparison by Functionality, 2025-2035
  • Figure 15: Global Market Attractiveness Analysis by Functionality
  • Figure 16: Global Market Value Share and BPS Analysis by Form, 2025 and 2035
  • Figure 17: Global Market Y-o-Y Growth Comparison by Form, 2025-2035
  • Figure 18: Global Market Attractiveness Analysis by Form
  • Figure 19: Global Market Value Share and BPS Analysis by Sales Channel, 2025 and 2035
  • Figure 20: Global Market Y-o-Y Growth Comparison by Sales Channel, 2025-2035
  • Figure 21: Global Market Attractiveness Analysis by Sales Channel
  • Figure 22: Global Market Value Share and BPS Analysis by End-Use Industry, 2025 and 2035
  • Figure 23: Global Market Y-o-Y Growth Comparison by End-Use Industry, 2025-2035
  • Figure 24: Global Market Attractiveness Analysis by End-Use Industry
  • Figure 25: Global Market Value (USD Billion) Share and BPS Analysis by Region, 2025 and 2035
  • Figure 26: Global Market Y-o-Y Growth Comparison by Region, 2025-2035
  • Figure 27: Global Market Attractiveness Analysis by Region
  • Figure 28: North America Market Incremental $ Opportunity, 2025-2035
  • Figure 29: Latin America Market Incremental $ Opportunity, 2025-2035
  • Figure 30: Western Europe Market Incremental $ Opportunity, 2025-2035
  • Figure 31: Eastern Europe Market Incremental $ Opportunity, 2025-2035
  • Figure 32: East Asia Market Incremental $ Opportunity, 2025-2035
  • Figure 33: South Asia & Pacific Market Incremental $ Opportunity, 2025-2035
  • Figure 34: Middle East and Africa Market Incremental $ Opportunity, 2025-2035
  • Figure 35: North America Market Value Share and BPS Analysis by Country, 2025 and 2035
  • Figure 36: North America Market Value Share and BPS Analysis by Product Type, 2025 and 2035
  • Figure 37: North America Market Y-o-Y Growth Comparison by Product Type, 2025-2035
  • Figure 38: North America Market Attractiveness Analysis by Product Type
  • Figure 39: North America Market Value Share and BPS Analysis by Source Type, 2025 and 2035
  • Figure 40: North America Market Y-o-Y Growth Comparison by Source Type, 2025-2035
  • Figure 41: North America Market Attractiveness Analysis by Source Type
  • Figure 42: North America Market Value Share and BPS Analysis by Application, 2025 and 2035
  • Figure 43: North America Market Y-o-Y Growth Comparison by Application, 2025-2035
  • Figure 44: North America Market Attractiveness Analysis by Application
  • Figure 45: North America Market Value Share and BPS Analysis by Functionality, 2025 and 2035
  • Figure 46: North America Market Y-o-Y Growth Comparison by Functionality, 2025-2035
  • Figure 47: North America Market Attractiveness Analysis by Functionality
  • Figure 48: North America Market Value Share and BPS Analysis by Form, 2025 and 2035
  • Figure 49: North America Market Y-o-Y Growth Comparison by Form, 2025-2035
  • Figure 50: North America Market Attractiveness Analysis by Form
  • Figure 51: North America Market Value Share and BPS Analysis by Sales Channel, 2025 and 2035
  • Figure 52: North America Market Y-o-Y Growth Comparison by Sales Channel, 2025-2035
  • Figure 53: North America Market Attractiveness Analysis by Sales Channel
  • Figure 54: North America Market Value Share and BPS Analysis by End-Use Industry, 2025 and 2035
  • Figure 55: North America Market Y-o-Y Growth Comparison by End-Use Industry, 2025-2035
  • Figure 56: North America Market Attractiveness Analysis by End-Use Industry
  • Figure 57: Latin America Market Value Share and BPS Analysis by Country, 2025 and 2035
  • Figure 58: Latin America Market Value Share and BPS Analysis by Product Type, 2025 and 2035
  • Figure 59: Latin America Market Y-o-Y Growth Comparison by Product Type, 2025-2035
  • Figure 60: Latin America Market Attractiveness Analysis by Product Type
  • Figure 61: Latin America Market Value Share and BPS Analysis by Source Type, 2025 and 2035
  • Figure 62: Latin America Market Y-o-Y Growth Comparison by Source Type, 2025-2035
  • Figure 63: Latin America Market Attractiveness Analysis by Source Type
  • Figure 64: Latin America Market Value Share and BPS Analysis by Application, 2025 and 2035
  • Figure 65: Latin America Market Y-o-Y Growth Comparison by Application, 2025-2035
  • Figure 66: Latin America Market Attractiveness Analysis by Application
  • Figure 67: Latin America Market Value Share and BPS Analysis by Functionality, 2025 and 2035
  • Figure 68: Latin America Market Y-o-Y Growth Comparison by Functionality, 2025-2035
  • Figure 69: Latin America Market Attractiveness Analysis by Functionality
  • Figure 70: Latin America Market Value Share and BPS Analysis by Form, 2025 and 2035
  • Figure 71: Latin America Market Y-o-Y Growth Comparison by Form, 2025-2035
  • Figure 72: Latin America Market Attractiveness Analysis by Form
  • Figure 73: Latin America Market Value Share and BPS Analysis by Sales Channel, 2025 and 2035
  • Figure 74: Latin America Market Y-o-Y Growth Comparison by Sales Channel, 2025-2035
  • Figure 75: Latin America Market Attractiveness Analysis by Sales Channel
  • Figure 76: Latin America Market Value Share and BPS Analysis by End-Use Industry, 2025 and 2035
  • Figure 77: Latin America Market Y-o-Y Growth Comparison by End-Use Industry, 2025-2035
  • Figure 78: Latin America Market Attractiveness Analysis by End-Use Industry
  • Figure 79: Western Europe Market Value Share and BPS Analysis by Country, 2025 and 2035
  • Figure 80: Western Europe Market Value Share and BPS Analysis by Product Type, 2025 and 2035
  • Figure 81: Western Europe Market Y-o-Y Growth Comparison by Product Type, 2025-2035
  • Figure 82: Western Europe Market Attractiveness Analysis by Product Type
  • Figure 83: Western Europe Market Value Share and BPS Analysis by Source Type, 2025 and 2035
  • Figure 84: Western Europe Market Y-o-Y Growth Comparison by Source Type, 2025-2035
  • Figure 85: Western Europe Market Attractiveness Analysis by Source Type
  • Figure 86: Western Europe Market Value Share and BPS Analysis by Application, 2025 and 2035
  • Figure 87: Western Europe Market Y-o-Y Growth Comparison by Application, 2025-2035
  • Figure 88: Western Europe Market Attractiveness Analysis by Application
  • Figure 89: Western Europe Market Value Share and BPS Analysis by Functionality, 2025 and 2035
  • Figure 90: Western Europe Market Y-o-Y Growth Comparison by Functionality, 2025-2035
  • Figure 91: Western Europe Market Attractiveness Analysis by Functionality
  • Figure 92: Western Europe Market Value Share and BPS Analysis by Form, 2025 and 2035
  • Figure 93: Western Europe Market Y-o-Y Growth Comparison by Form, 2025-2035
  • Figure 94: Western Europe Market Attractiveness Analysis by Form
  • Figure 95: Western Europe Market Value Share and BPS Analysis by Sales Channel, 2025 and 2035
  • Figure 96: Western Europe Market Y-o-Y Growth Comparison by Sales Channel, 2025-2035
  • Figure 97: Western Europe Market Attractiveness Analysis by Sales Channel
  • Figure 98: Western Europe Market Value Share and BPS Analysis by End-Use Industry, 2025 and 2035
  • Figure 99: Western Europe Market Y-o-Y Growth Comparison by End-Use Industry, 2025-2035
  • Figure 100: Western Europe Market Attractiveness Analysis by End-Use Industry
  • Figure 101: Eastern Europe Market Value Share and BPS Analysis by Country, 2025 and 2035
  • Figure 102: Eastern Europe Market Value Share and BPS Analysis by Product Type, 2025 and 2035
  • Figure 103: Eastern Europe Market Y-o-Y Growth Comparison by Product Type, 2025-2035
  • Figure 104: Eastern Europe Market Attractiveness Analysis by Product Type
  • Figure 105: Eastern Europe Market Value Share and BPS Analysis by Source Type, 2025 and 2035
  • Figure 106: Eastern Europe Market Y-o-Y Growth Comparison by Source Type, 2025-2035
  • Figure 107: Eastern Europe Market Attractiveness Analysis by Source Type
  • Figure 108: Eastern Europe Market Value Share and BPS Analysis by Application, 2025 and 2035
  • Figure 109: Eastern Europe Market Y-o-Y Growth Comparison by Application, 2025-2035
  • Figure 110: Eastern Europe Market Attractiveness Analysis by Application
  • Figure 111: Eastern Europe Market Value Share and BPS Analysis by Functionality, 2025 and 2035
  • Figure 112: Eastern Europe Market Y-o-Y Growth Comparison by Functionality, 2025-2035
  • Figure 113: Eastern Europe Market Attractiveness Analysis by Functionality
  • Figure 114: Eastern Europe Market Value Share and BPS Analysis by Form, 2025 and 2035
  • Figure 115: Eastern Europe Market Y-o-Y Growth Comparison by Form, 2025-2035
  • Figure 116: Eastern Europe Market Attractiveness Analysis by Form
  • Figure 117: Eastern Europe Market Value Share and BPS Analysis by Sales Channel, 2025 and 2035
  • Figure 118: Eastern Europe Market Y-o-Y Growth Comparison by Sales Channel, 2025-2035
  • Figure 119: Eastern Europe Market Attractiveness Analysis by Sales Channel
  • Figure 120: Eastern Europe Market Value Share and BPS Analysis by End-Use Industry, 2025 and 2035
  • Figure 121: Eastern Europe Market Y-o-Y Growth Comparison by End-Use Industry, 2025-2035
  • Figure 122: Eastern Europe Market Attractiveness Analysis by End-Use Industry
  • Figure 123: East Asia Market Value Share and BPS Analysis by Country, 2025 and 2035
  • Figure 124: East Asia Market Value Share and BPS Analysis by Product Type, 2025 and 2035
  • Figure 125: East Asia Market Y-o-Y Growth Comparison by Product Type, 2025-2035
  • Figure 126: East Asia Market Attractiveness Analysis by Product Type
  • Figure 127: East Asia Market Value Share and BPS Analysis by Source Type, 2025 and 2035
  • Figure 128: East Asia Market Y-o-Y Growth Comparison by Source Type, 2025-2035
  • Figure 129: East Asia Market Attractiveness Analysis by Source Type
  • Figure 130: East Asia Market Value Share and BPS Analysis by Application, 2025 and 2035
  • Figure 131: East Asia Market Y-o-Y Growth Comparison by Application, 2025-2035
  • Figure 132: East Asia Market Attractiveness Analysis by Application
  • Figure 133: East Asia Market Value Share and BPS Analysis by Functionality, 2025 and 2035
  • Figure 134: East Asia Market Y-o-Y Growth Comparison by Functionality, 2025-2035
  • Figure 135: East Asia Market Attractiveness Analysis by Functionality
  • Figure 136: East Asia Market Value Share and BPS Analysis by Form, 2025 and 2035
  • Figure 137: East Asia Market Y-o-Y Growth Comparison by Form, 2025-2035
  • Figure 138: East Asia Market Attractiveness Analysis by Form
  • Figure 139: East Asia Market Value Share and BPS Analysis by Sales Channel, 2025 and 2035
  • Figure 140: East Asia Market Y-o-Y Growth Comparison by Sales Channel, 2025-2035
  • Figure 141: East Asia Market Attractiveness Analysis by Sales Channel
  • Figure 142: East Asia Market Value Share and BPS Analysis by End-Use Industry, 2025 and 2035
  • Figure 143: East Asia Market Y-o-Y Growth Comparison by End-Use Industry, 2025-2035
  • Figure 144: East Asia Market Attractiveness Analysis by End-Use Industry
  • Figure 145: South Asia & Pacific Market Value Share and BPS Analysis by Country, 2025 and 2035
  • Figure 146: South Asia & Pacific Market Value Share and BPS Analysis by Product Type, 2025 and 2035
  • Figure 147: South Asia & Pacific Market Y-o-Y Growth Comparison by Product Type, 2025-2035
  • Figure 148: South Asia & Pacific Market Attractiveness Analysis by Product Type
  • Figure 149: South Asia & Pacific Market Value Share and BPS Analysis by Source Type, 2025 and 2035
  • Figure 150: South Asia & Pacific Market Y-o-Y Growth Comparison by Source Type, 2025-2035
  • Figure 151: South Asia & Pacific Market Attractiveness Analysis by Source Type
  • Figure 152: South Asia & Pacific Market Value Share and BPS Analysis by Application, 2025 and 2035
  • Figure 153: South Asia & Pacific Market Y-o-Y Growth Comparison by Application, 2025-2035
  • Figure 154: South Asia & Pacific Market Attractiveness Analysis by Application
  • Figure 155: South Asia & Pacific Market Value Share and BPS Analysis by Functionality, 2025 and 2035
  • Figure 156: South Asia & Pacific Market Y-o-Y Growth Comparison by Functionality, 2025-2035
  • Figure 157: South Asia & Pacific Market Attractiveness Analysis by Functionality
  • Figure 158: South Asia & Pacific Market Value Share and BPS Analysis by Form, 2025 and 2035
  • Figure 159: South Asia & Pacific Market Y-o-Y Growth Comparison by Form, 2025-2035
  • Figure 160: South Asia & Pacific Market Attractiveness Analysis by Form
  • Figure 161: South Asia & Pacific Market Value Share and BPS Analysis by Sales Channel, 2025 and 2035
  • Figure 162: South Asia & Pacific Market Y-o-Y Growth Comparison by Sales Channel, 2025-2035
  • Figure 163: South Asia & Pacific Market Attractiveness Analysis by Sales Channel
  • Figure 164: South Asia & Pacific Market Value Share and BPS Analysis by End-Use Industry, 2025 and 2035
  • Figure 165: South Asia & Pacific Market Y-o-Y Growth Comparison by End-Use Industry, 2025-2035
  • Figure 166: South Asia & Pacific Market Attractiveness Analysis by End-Use Industry
  • Figure 167: Middle East and Africa Market Value Share and BPS Analysis by Country, 2025 and 2035
  • Figure 168: Middle East and Africa Market Value Share and BPS Analysis by Product Type, 2025 and 2035
  • Figure 169: Middle East and Africa Market Y-o-Y Growth Comparison by Product Type, 2025-2035
  • Figure 170: Middle East and Africa Market Attractiveness Analysis by Product Type
  • Figure 171: Middle East and Africa Market Value Share and BPS Analysis by Source Type, 2025 and 2035
  • Figure 172: Middle East and Africa Market Y-o-Y Growth Comparison by Source Type, 2025-2035
  • Figure 173: Middle East and Africa Market Attractiveness Analysis by Source Type
  • Figure 174: Middle East and Africa Market Value Share and BPS Analysis by Application, 2025 and 2035
  • Figure 175: Middle East and Africa Market Y-o-Y Growth Comparison by Application, 2025-2035
  • Figure 176: Middle East and Africa Market Attractiveness Analysis by Application
  • Figure 177: Middle East and Africa Market Value Share and BPS Analysis by Functionality, 2025 and 2035
  • Figure 178: Middle East and Africa Market Y-o-Y Growth Comparison by Functionality, 2025-2035
  • Figure 179: Middle East and Africa Market Attractiveness Analysis by Functionality
  • Figure 180: Middle East and Africa Market Value Share and BPS Analysis by Form, 2025 and 2035
  • Figure 181: Middle East and Africa Market Y-o-Y Growth Comparison by Form, 2025-2035
  • Figure 182: Middle East and Africa Market Attractiveness Analysis by Form
  • Figure 183: Middle East and Africa Market Value Share and BPS Analysis by Sales Channel, 2025 and 2035
  • Figure 184: Middle East and Africa Market Y-o-Y Growth Comparison by Sales Channel, 2025-2035
  • Figure 185: Middle East and Africa Market Attractiveness Analysis by Sales Channel
  • Figure 186: Middle East and Africa Market Value Share and BPS Analysis by End-Use Industry, 2025 and 2035
  • Figure 187: Middle East and Africa Market Y-o-Y Growth Comparison by End-Use Industry, 2025-2035
  • Figure 188: Middle East and Africa Market Attractiveness Analysis by End-Use Industry
  • Figure 189: Global Market - Tier Structure Analysis
  • Figure 190: Global Market - Company Share Analysis

Frequently Asked Questions

What is the projected industry value of the pellet binders market in 2025?

The industry is projected to reach USD 1.7 billion in 2025.

What is the expected global CAGR for the pellet binders market from 2025 to 2035?

The industry is expected to grow at a CAGR of 4.3% from 2025 to 2035.

Which segment is expected to dominate the pellet binders market in 2025?

Lignosulfonates are expected to capture 33% share in 2025.

Which region is forecasted to show significant growth in the pellet binders market by 2025?

The Asia Pacific region, particularly India and China, is projected to register a CAGR of 4.1% and 4.0% from 2025 to 2035.

What is the forecasted industry value of the pellet binders market by 2035?

The industry is projected to reach USD 2.5 billion by 2035.

Explore Similar Insights

Future Market Insights

Pellet binders Market