

- Market Size (2026)
- USD 8.5 Bn
- Forecast (2036)
- USD 18.9 Bn
- CAGR (2026 to 2036)
- 8.3%
How big is biodiversity conservation mining market size?
USD 8.5 billion in 2026 and USD 18.9 billion by 2036 at an 8.3% CAGR.
Sales of biodiversity conservation mining are estimated to rise at 8.3% CAGR through 2036, increasing valuation from USD 8.5 billion in 2026 to USD 18.9 billion by 2036. Mining companies conduct baseline environmental surveys and restore natural habitats to satisfy permit rules throughout the entire lifespan of a project. Taskforce on Nature-related Financial Disclosures recorded 620 organizations pursuing nature-related reporting during September 2025. This growing trend toward public disclosure drives a strong demand for verifiable monitoring records for banks and site planners being able to review before approving new mine designs.
Project teams across Australia and Canada prioritize site-closure standards and active Indigenous participation. Operations in Indonesia and Brazil focus primarily on restoring whole landscapes and supporting community-led conservation projects. The United Nations Environment Programme World Conservation Monitoring Centre published a report during October 2024 showing 32.0% of Key Biodiversity Areas having lacked formal legal protection. Such significant gaps around sensitive ecosystems force mining companies to produce hard evidence proving their operations avoid fragile habitats and prioritize nature restoration.
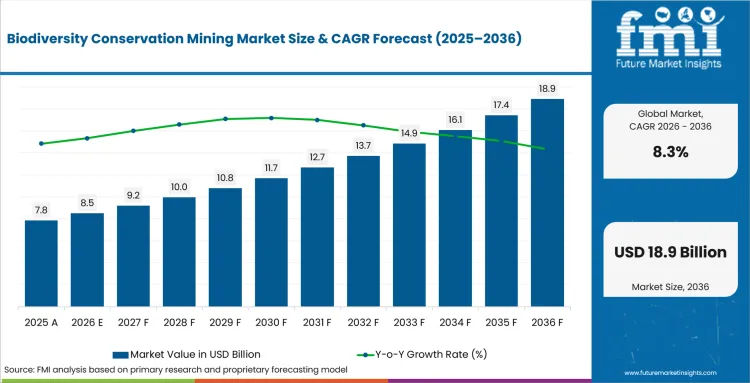
Key Takeaways for the Biodiversity Conservation Mining Market
- Demand for biodiversity conservation mining receives support from permit conditions requiring measurable habitat protection throughout development and closure programs.
- Mining companies are forecast to garner 48.0% share of end user in 2026, influenced by direct responsibility for operational impacts and closure obligations.
- On-site conservation programs are estimated to lead deployment model with 42.0% share in 2026, backed by continuous restoration control at mine properties.
- Uneven baseline data and lengthy ecological verification restrict purchasing confidence across restoration and offset programs.
- Competition focuses on Rio Tinto, BHP Group, Anglo American plc, Glencore plc, Newmont Corporation, Barrick Mining Corporation, Vale S.A., Teck Resources, Freeport-McMoRan, and South32, with programs differentiated based on field evidence and closure integration.
Analyst Perspective
“Biodiversity programs create commercial value only depending on measurable changes in mine design and restoration performance. Management teams review habitat evidence together with permit obligations and community responsibilities. Recurring conservation spending follows accepted field outcomes instead of isolated studies or unsupported commitments.”
- Anurag Sharma, Principal Analyst at Future Market Insights
How is Biodiversity Conservation Mining Market segmented?
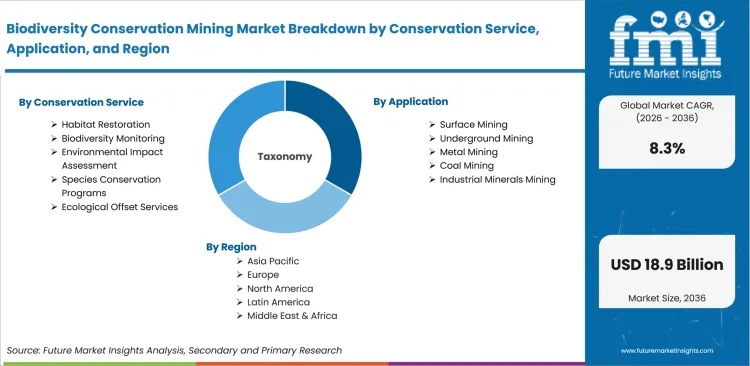
The biodiversity conservation mining industry is segmented by conservation service, application, end user, deployment model, technology, and region.
The biodiversity conservation mining sector is segmented by conservation service, application, end user, deployment model, technology, and region. Deployment model separates site-managed programs from external service arrangements. Technology coverage includes remote sensing and ecological field measurement. Regional coverage spans North America and Latin America together with Western Europe. Eastern Europe and East Asia extend analysis across mineral-producing economies. South Asia and Pacific with Middle East and Africa complete geographic assessment.
How does habitat restoration lead conservation service demand?
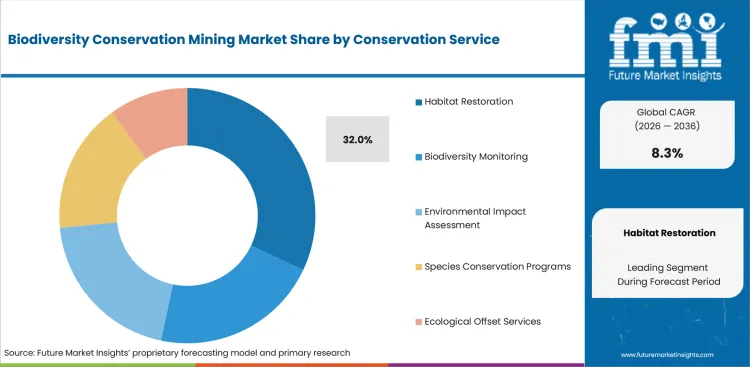
Habitat restoration converts closure plans into measurable land outcomes through revegetation and ecological performance checks. Rio Tinto reported rehabilitating 26 km² during 2025 in its February 2026 sustainability reporting. Recorded rehabilitation offers buyers a practical operating reference for program scale and consistent annual field delivery. Independent verification remains necessary for survival rates and agreed post-mining land use.
- Habitat restoration is predicted to represent 32.0% share of conservation service in 2026, backed by direct links between disturbed land and closure acceptance. Buyer reviews examine completion criteria and restoration survival throughout multi-year obligations covering progressive rehabilitation and final closure acceptance.
- Ecosystem rehabilitation and native vegetation restoration address distinct ecological conditions across disturbed landscapes and agreed post-mining land uses. Biodiversity monitoring supports later verification through species evidence and maintained field records covering seasonal ecological performance changes.
Why does surface mining lead application demand?
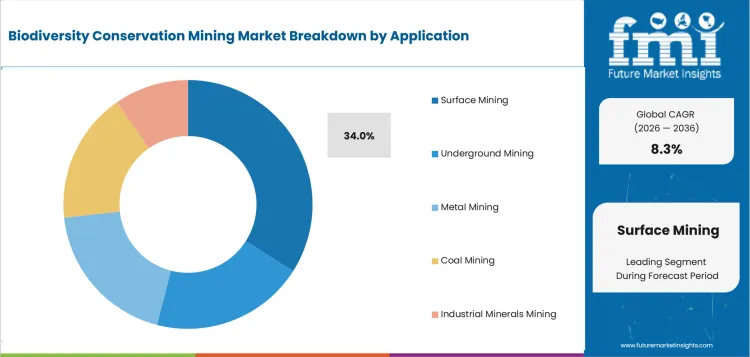
Surface mining creates extensive land interfaces requiring progressive rehabilitation and documented disturbance tracking throughout operations. Western Australia recorded 52,375 hectares under rehabilitation during 2025 in its November 2025 data release. Reported land coverage demonstrates sustained workloads for restoration planning and environmental monitoring. Purchasing scope expands through closure criteria and mine-plan sequencing.
- By application, surface mining is anticipated to account for 34.0% share in 2026 since being reflected by direct exposure across pits and supporting infrastructure. Field programs connect rehabilitation schedules with operational access and approved future land uses across progressive closure work packages.
- Underground mining concentrates conservation needs around portals and waste facilities instead of entire extraction footprints. Metal mining and coal mining require separate habitat controls suited to commodity-specific operating plans and local ecological sensitivities.
What supports mining companies across end user demand?
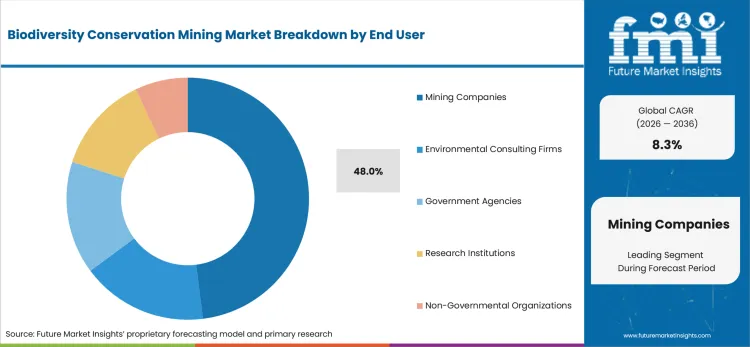
Mining companies retain direct accountability for permits and restoration commitments throughout project ownership. BHP reported an Arid Recovery reserve exceeding 123,000 hectares beside Olympic Dam in August 2025. Long-duration participation links operational funding with protected habitat management near active mining infrastructure. External consultants support studies without replacing owner responsibility for accepted results.
- In 2026, mining companies are likely to hold 48.0% share as it is influenced by direct control over land disturbance and closure budgets. Internal teams coordinate contractors and regulators throughout evidence review and field implementation across active operations and closure stages.
- Environmental Consulting Firms provide specialist surveys and restoration design during defined project stages requiring independent technical evidence. Government Agencies and Research Institutions concentrate on environmental testing and independent ecological knowledge supporting approval decisions.
What supports on-site conservation programs within deployment model?
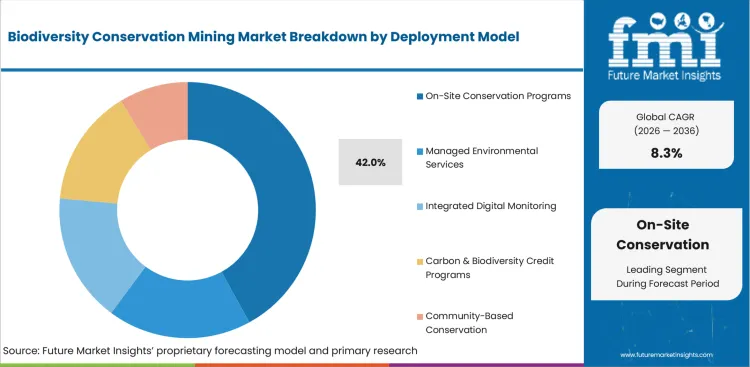
On-site conservation programs retain restoration teams and monitoring routines close to operating assets. PT Freeport Indonesia described a 10,000-hectare mangrove commitment in June 2025 through partnerships supporting coastal restoration. Local delivery allows rapid response to field conditions and community participation throughout program execution. Managed Environmental Services address specialist gaps under contracted scopes and defined performance measures.
- Based on deployment model, on-site conservation programs are projected to account for 42.0% share in 2026 due to direct access to operational schedules and field evidence. Site ownership improves coordination across restoration crews and environmental management systems supporting consistent field records and corrective actions.
- Integrated digital monitoring uses remote evidence to complement site inspections without replacing ecological judgment during seasonal performance review. Community-based conservation supports stewardship roles through locally agreed responsibilities and maintained participation records covering long-duration habitat management.
Why does remote sensing & GIS lead technology demand?
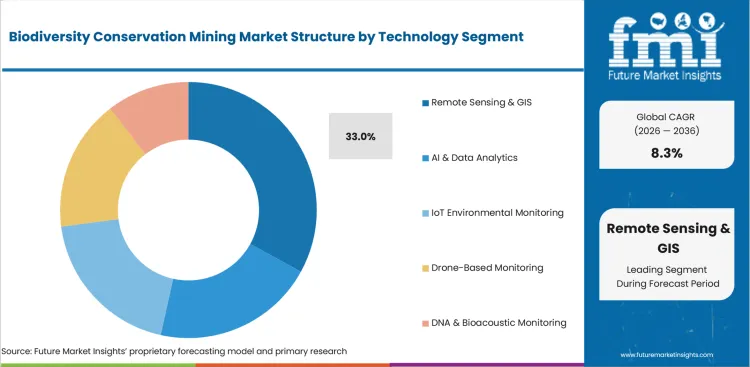
Remote sensing & GIS combines land-cover evidence with mine boundaries and habitat priorities across changing sites. South Africa released 3 protected-area geospatial datasets during June 2026 through its environmental geographic information system (GIS) portal. Structured map layers support AI in environmental sustainability through consistent screening across permits and restoration plans. Field verification preserves confidence across seasonal habitat conditions and species records.
- Remote sensing & GIS is estimated to represent 33.0% share in 2026, driven by repeatable mapping across large mining footprints. Buyers compare remote sensing services and geospatial analytics against field survey requirements covering habitat boundaries and restoration progress.
- IoT environmental monitoring supports continuous readings through each environmental sensor placed near operational exposures requiring rapid corrective review. Commercial drones and drone inspection and monitoring extend field coverage across inaccessible rehabilitation zones and fragmented habitat corridors.
What are drivers, restraints, and opportunities in Biodiversity Conservation Mining Market?
Permit and lender evidence requirements support recurring conservation work across mine development and closure. Incomplete ecological baselines delay approval for restoration claims and biodiversity offsets.
- Driver: Lenders and regulators require traceable biodiversity evidence across project approval and closure commitments. Verified records shorten lender review and support permit conditions across successive mine phases.
- Restraint: Weak baseline records limit confidence in restoration outcomes and offset additionality during technical review. Incomplete reference conditions trigger repeat fieldwork and extend assurance timelines for affected sites.
- Opportunity: Providers combine ecological services with long-duration monitoring connected to accepted mine-plan decisions and closure responsibilities. Ongoing evidence updates support revised restoration choices and strengthen accountability throughout multi-year programs.
Project-finance review creates a direct demand route for biodiversity studies and mitigation records. Equator Principles reporting recorded 2 mining advisory mandates for Société Générale during 2025. Mining mandates require environmental evidence suited to project risk classification and lender diligence. Service demand expands through documented avoidance measures and monitored restoration commitments.
Evidence quality restricts purchasing whenever impact pathways lack clear baselines or measurable outcomes. World Benchmarking Alliance reported only 5.0% of assessed companies completed nature-impact assessments in August 2024. Limited assessment depth increases corrective work across habitat plans and biodiversity offset claims. Buyers respond through additional surveys and independent review prior to program expansion.
Long-duration stewardship programs provide expansion potential through measurable conservation outcomes and shared local responsibilities. South Africa reported approximately 2.76 million hectares secured through biodiversity stewardship by May 2026. Established stewardship structures support landowner participation and durable management arrangements beyond individual mine tasks. Providers gain recurring work through field monitoring and transparent progress records.
How are country CAGRs aligned in Biodiversity Conservation Mining Market?
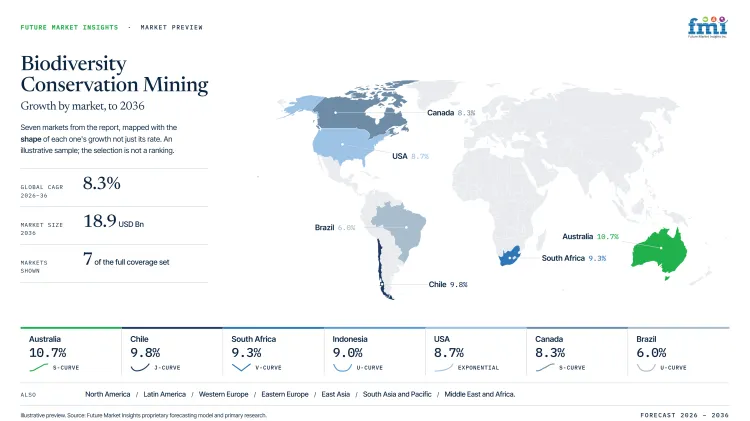
| Country or Market | CAGR |
|---|---|
| Australia | 10.7% |
| Chile | 9.8% |
| South Africa | 9.3% |
| Indonesia | 9.0% |
| USA | 8.7% |
| Canada | 8.3% |
| Brazil | 6.0% |
Source: Future Market Insights country forecast analysis, 2026.
How do country-level CAGRs compare in Biodiversity Conservation Mining Market?
Country comparison presents a measured step-down across seven profiled economies. Australia occupies the upper forecast position followed by Chile and South Africa. Indonesia and USA form the central rate band. Canada and Brazil complete the disclosed comparison under different closure and habitat conditions.
- Australia establishes South Asia and Pacific as the lead development cluster across profiled economies.
- Chile follows Australia through extensive mining activity and sensitive high-Andean habitat responsibilities.
- South Africa occupies the next position through conservation stewardship and rehabilitation policy coverage.
- Indonesia forms the central tier through mine-site restoration and landscape partnership programs.
- USA follows Indonesia through abandoned mine restoration and formal environmental review systems.
- Canada approaches the lower band through established assessment processes and Indigenous participation requirements.
- Brazil completes the comparison through forest restoration programs across mineral-producing territories.
- Full report coverage includes North America, Latin America, Europe, East Asia, South Asia and Pacific, Middle East and Africa.
Country-wise Analysis
- Biodiversity conservation mining market in Australia is forecast to expand at 10.7% CAGR between 2026 and 2036, led by formal closure criteria and extensive disturbed-land reporting. Western Australia extended exploration rehabilitation timing from 6 months to 12 months in March 2025, giving operators clearer delivery requirements under field constraints. Longer execution windows increase demand for scheduled restoration evidence and documented completion checks.
- Anglo American reported approximately 60 million tonnes of contained copper within the coordinated Los Bronces and Andina resource base during February 2025, paired with safeguards for high-Andean ecosystems. Project scale increases habitat planning needs across shared infrastructure and environmental commitments. Sales in Chile are anticipated to rise at 9.8% CAGR during the study period, guided by continuing mine development and biodiversity review.
- Demand in South African is estimated to record 9.3% CAGR by 2036 as conservation estate expansion strengthens stewardship routes near mining regions. National authorities reported more than 320,000 hectares added to the conservation estate during 2025/2026. Expanded conserved land increases spatial screening and partnership requirements around mineral projects and restoration programs.
- PT Freeport Indonesia reported planting 50,000 mangroves by February 2025 near its Gresik operations. Coastal restoration demonstrates direct mine-company participation through local environmental partnerships and field delivery. Adoption in Indonesia is projected to post 9.0% CAGR during 2026 to 2036 since site programs extend across operational and landscape priorities.
- Sector in the United States is set to rise at 8.7% CAGR during the assessment period, helped by extensive legacy mine restoration needs and formal agency review. United States Department of the Interior identified roughly 56,600 abandoned hardrock mine sites on federal land in its fiscal 2025 budget. Site volume supports continued assessment and rehabilitation work across federal and state programs.
- British Columbia granted an environmental assessment certificate extending Highland Valley Copper operations through 2043 in June 2025. Extended mine life requires maintained habitat evidence and updated closure planning throughout additional operating years. Industry in Canada is predicted to register 8.3% CAGR from 2026 to 2036, led by established assessment and Indigenous engagement processes.
- Sector in Brazil is expected to expand at 6.0% CAGR during the forecast period, driven by forest restoration and protected-area partnerships shape mine-company conservation spending. Vale recorded 225,457 hectares restored or protected by the end of 2025 in its April 2026 annual reporting. Large landscape commitments support recurring monitoring and partnership management across Amazon and Atlantic Forest territories.
Who are notable companies in Biodiversity Conservation Mining Market?
Rio Tinto, BHP Group, Anglo American plc, Glencore plc, Newmont Corporation, Barrick Mining Corporation, Vale S.A., Teck Resources, Freeport-McMoRan, and South32 are notable mining groups shaping conservation practice across operating portfolios.
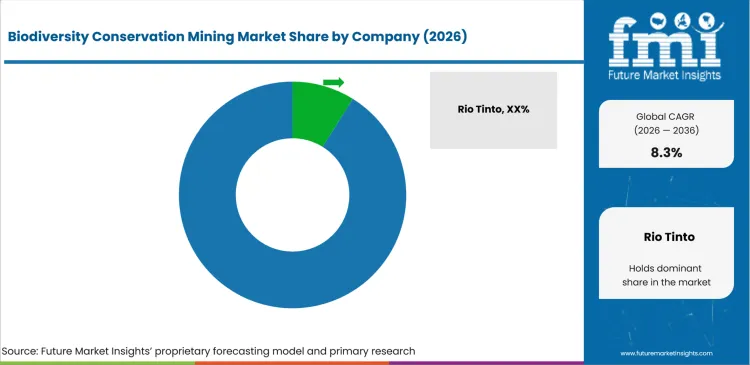
Competition reflects program depth and accepted ecological evidence instead of standalone conservation products or generic sustainability claims. Mining groups combine internal environmental teams with specialist consultants and community partners. Buyer review covers restoration survival and permit closure evidence across operating regions. Geographic reach supports learning transfer only through locally accepted field methods and land responsibilities.
- Rio Tinto and BHP Group compete based on portfolio-scale rehabilitation programs and Indigenous partnerships. Evaluation emphasizes repeatable field outcomes and integration with mine planning across several commodities.
- Anglo American plc and Glencore plc differentiate depending on biodiversity monitoring and site-specific restoration controls. Program review examines evidence quality and performance against approved land-use outcomes.
- Newmont Corporation and Vale S.A. operate extensive mine portfolios requiring maintained habitat plans. Purchasing teams examine governance and long-duration conservation responsibilities across regional operations.
- Teck Resources and South32 provide additional operating references across copper and diversified mining assets. Competitive separation reflects local partnerships and transparent restoration measurement.
Competitive Benchmarking: Biodiversity Conservation Mining Market
| Company | Program Depth | Mine Integration | Evidence Capability | Geographic Reach |
|---|---|---|---|---|
| Rio Tinto | High | High | High | Global |
| BHP Group | High | High | High | Global |
| Anglo American plc | High | High | High | Multi-country |
| Glencore plc | High | High | Medium | Global |
| Newmont Corporation | High | High | High | Multi-country |
| Barrick Mining Corporation | High | High | Medium | Multi-country |
| Vale S.A. | High | High | High | Multi-country |
| Teck Resources | Medium | High | High | Multi-country |
| Freeport-McMoRan | High | High | Medium | Multi-country |
| South32 | Medium | High | Medium | Multi-country |
Source: Future Market Insights competitive analysis, 2026.
Key Developments in Biodiversity Conservation Mining Market
- In January 2025, Rio Tinto and Indigital launched a three-year Caring for Country program across remote Queensland communities. AI analysis and LiDAR mapping strengthen community-led biodiversity monitoring near mining operations.
- In August 2025, BHP reported continued support for the Arid Recovery reserve beside its Olympic Dam operations. The predator-proof conservation area covers more than 123,000 hectares, with species monitoring strengthening mine-adjacent biodiversity recovery evidence.
- In January 2026, Anglo American introduced environmental DNA sampling across rehabilitated Bowen Basin mine sites. Laboratory matching improves species detection and strengthens independent evidence of ecological recovery.
Key Players in Biodiversity Conservation Mining Market
Global Diversified Mining Groups
- Rio Tinto
- BHP Group
- Anglo American plc
- Glencore plc
Gold and Copper Portfolio Operators
- Newmont Corporation
- Barrick Mining Corporation
- Vale S.A.
Regional and Multi-Commodity Operators
- Teck Resources
- Freeport-McMoRan
- South32
Biodiversity Conservation Mining Market Report Scope
| Coverage field | Report scope |
|---|---|
| Market breakdown | Biodiversity conservation mining market breakdown includes conservation service, application, end user, deployment model, technology, and region. |
| Market Definition | Biodiversity conservation mining covers baseline studies, impact avoidance, habitat restoration, species conservation, ecological offsets, field monitoring, geospatial tools, and long-term stewardship associated with mining projects. Generic corporate sustainability activity lacking a mine-linked ecological outcome is excluded. |
| Regions Covered | North America, Latin America, Western Europe, Eastern Europe, East Asia, South Asia and Pacific, Middle East and Africa. |
| Countries Covered | Australia, Chile, South Africa, Indonesia, USA, Canada, Brazil and additional countries included in full regional coverage. |
| Key Companies Profiled | Rio Tinto, BHP Group, Anglo American plc, Glencore plc, Newmont Corporation, Barrick Mining Corporation, Vale S.A., Teck Resources, Freeport-McMoRan, and South32. |
| Forecast Period | 2026 to 2036 |
| Approach | Hybrid bottom-up and top-down methodology uses segment shares and country CAGRs. Mine activity and ecological program evidence support final reconciliation. |
Source: Future Market Insights market scope analysis, 2026.
Biodiversity Conservation Mining Market - Research Methodology
| Method | Approach |
|---|---|
| Primary Research | FMI analysts gathered input from manufacturers, service providers, technology developers, distributors, end users, procurement teams, and subject-matter experts. Interviews examined purchasing decisions, product or service evaluation, adoption barriers, approval requirements, pricing considerations, and expectations for technical or commercial support. Respondents were also asked what evidence is required before a trial, pilot, or initial order develops into regular purchasing. |
| Desk Research | Desk research covered government statistics, regulatory publications, trade data, industry associations, technical literature, standards, company filings, product information, and official corporate announcements. Sources were reviewed for relevance, publication date, geographic coverage, and consistency with the defined market scope. Claims relating to performance, applications, approvals, capacity, investment, and commercial activity were retained only when supported by credible public evidence. |
| Market Sizing and Forecasting | The market model combined the baseline value with historical performance, segment structure, pricing and volume indicators, adoption levels, company participation, and country-level demand conditions. Forecast assumptions considered economic activity, investment trends, regulatory developments, technology adoption, purchasing cycles, supply availability, and barriers to wider market use. Segment and regional estimates were reconciled before the final market total was calculated. |
| Data Validation | Estimates were checked against multiple independent indicators, including public data, company activity, trade patterns, industry developments, and findings from primary interviews. Validation also tested whether products, services, applications, and company revenues fell within the defined market boundaries. Adjacent categories, unsupported claims, overlapping revenues, and activities without direct market relevance were excluded to reduce double counting and maintain consistency across segments and countries. |
Source: Future Market Insights research process, 2026.
Biodiversity Conservation Mining Market by Segments
Biodiversity Conservation Mining Market segmented by Conservation Service:
- Habitat Restoration
- Biodiversity Monitoring
- Environmental Impact Assessment
- Species Conservation Programs
- Ecological Offset Services
Biodiversity Conservation Mining Market segmented by Application:
- Surface Mining
- Underground Mining
- Metal Mining
- Coal Mining
- Industrial Minerals Mining
Biodiversity Conservation Mining Market segmented by End User:
- Mining Companies
- Environmental Consulting Firms
- Government Agencies
- Research Institutions
- Non-Governmental Organizations
Biodiversity Conservation Mining Market segmented by Deployment Model:
- On-Site Conservation Programs
- Managed Environmental Services
- Integrated Digital Monitoring
- Carbon & Biodiversity Credit Programs
- Community-Based Conservation
Biodiversity Conservation Mining Market segmented by Technology:
- Remote Sensing & GIS
- AI & Data Analytics
- IoT Environmental Monitoring
- Drone-Based Monitoring
- DNA & Bioacoustic Monitoring
Biodiversity Conservation Mining Market segmented by Region:
- North America
- United States
- Canada
- Latin America
- Brazil
- Mexico
- Argentina
- Chile
- Western Europe
- Germany
- France
- United Kingdom
- Italy
- Spain
- Benelux
- Nordics
- Eastern Europe
- Poland
- Czech Republic
- Romania
- Hungary
- East Asia
- China
- Japan
- South Korea
- South Asia and Pacific
- India
- ASEAN
- Australia and New Zealand
- Middle East and Africa
- GCC Countries
- South Africa
- Türkiye
- Israel
Research Sources and Bibliography
- Taskforce on Nature-related Financial Disclosures. (2025, September 25). Release of TNFD Status Report highlights significant market momentum on nature-related issues.
- United Nations Environment Programme World Conservation Monitoring Centre & International Union for Conservation of Nature. (2024, October 29). Protected Planet Report 2024.
- Rio Tinto. (2026, February 19). Sustainability reporting 2025.
- Department of Mines, Petroleum and Exploration. (2025, November 3). Mining Rehabilitation Fund 2025 Data Release.
- BHP Group. (2025, August 19). Protecting Australia’s unique fauna.
- PT Freeport Indonesia. (2025, June 2). Freeport and MoE Accelerate National Mangrove Rehabilitation Program in South Kalimantan.
- Department of Forestry, Fisheries and the Environment. (2026, May 8). Environmental Geographic Information Systems (EGIS).
- Société Générale. (2026, June 29). Equator Principles Report 2025.
- World Benchmarking Alliance. (2024, August 7). Research shows major companies around the world are failing to assess and measure their impact on nature.
- Department of Forestry, Fisheries and the Environment. (2026, May 13). South Africa to host first global flagship event for International Day for Biological Diversity 2026.
- Department of Energy, Mines, Industry Regulation and Safety. (2025, March 24). Programme of Work and rehabilitation guidance released.
- Anglo American plc. (2025, February 20). Anglo American and Codelco to unlock significant value from joint mine plan for Los Bronces and Andina copper mines.
- Department of Forestry, Fisheries and the Environment. (2026). Deputy Minister N. Singh: Speech on the 2026/2027 National Budget Vote of the department.
- PT Freeport Indonesia. (2025, February 26). PTFI Plants 50 Thousand Mangroves in Gresik, Supporting Coastal Ecosystem Conservation.
- USA Department of the Interior. (2024). FY25 DOI Budget.
- Government of British Columbia. (2025, June 17). Environmental assessment certificate granted for Highland Valley Copper mine expansion.
- Vale S.A. (2026, April 15). Vale Releases 2025 Annual Report highlighting progress in safety, sustainability, and value creation.
- Rio Tinto. (2025, January 22). Indigital and Rio Tinto launch Caring for Country program to combine Indigenous knowledge and technology for biodiversity conservation.
- Teck Resources Limited. (2025, July 23). Teck Announces Construction of Highland Valley Copper Mine Life Extension to Proceed.
- Anglo American Australia. (2026, January 12). Detecting nature’s fingerprint at rehabilitated mine sites.
This bibliography is provided for reader reference and is not exhaustive. The full report contains the complete reference list and detailed citations.
This Report Answers
- How do conservation service and application segments influence mine-linked biodiversity spending?
- What evidence supports restoration acceptance throughout active mining and closure programs?
- Why do country CAGRs differ across profiled mineral-producing economies?
- How do mining companies compare through conservation programs and field evidence?
- What limits confidence in biodiversity offsets and ecological outcome claims?
- How do on-site programs differ from managed environmental service arrangements?
- Why does remote sensing require field verification across restoration areas?
- How do community partnerships influence long-duration stewardship delivery?
- What company developments improve monitoring and mine rehabilitation capability?
- How are forecasts validated through segment shares and country indicators?
Frequently Asked Questions
How big is the Biodiversity Conservation Mining Market in 2026?
The biodiversity conservation mining market is valued at USD 8.5 billion in 2026 and is forecast to reach USD 18.9 billion by 2036, reflecting growing demand for verifiable habitat monitoring and restoration records driven by permit conditions and nature-related financial disclosure requirements across mining projects.
What is the CAGR of the Biodiversity Conservation Mining Market from 2026 to 2036?
The biodiversity conservation mining market is projected to grow at a CAGR of 8.3% between 2026 and 2036, supported by lender and regulatory requirements for traceable biodiversity evidence across project approval, progressive rehabilitation, and mine closure commitments.
Which conservation service leads the Biodiversity Conservation Mining Market?
Habitat restoration accounts for 32.0% of the biodiversity conservation mining market by conservation service in 2026, driven by direct links between disturbed land and closure acceptance that require measurable revegetation outcomes and multi-year restoration survival records across operating and closure programs.
Which country is growing fastest in the Biodiversity Conservation Mining Market?
The biodiversity conservation mining market in Australia is projected to expand at a CAGR of 10.7% through 2036, ahead of Chile at 9.8%, South Africa at 9.3%, Indonesia at 9.0%, the USA at 8.7%, Canada at 8.3%, and Brazil at 6.0%, reflecting formal closure criteria and extensive disturbed-land reporting obligations across major mining operations.
Who are the leading companies in the Biodiversity Conservation Mining Market?
Leading companies in the biodiversity conservation mining market include Rio Tinto, BHP Group, Anglo American plc, Glencore plc, Newmont Corporation, Barrick Mining Corporation, Vale S.A., Teck Resources, Freeport-McMoRan, and South32, competing across portfolio-scale rehabilitation programs, biodiversity monitoring, and long-duration conservation stewardship across global mining operations.
Preview the report firsthand - request a free sample
Get SampleGet the brochure for pricing and purchase details.
Get PDFTable of Content
- Key Takeaways
- Market Size and CAGR
- Top Growth Driver
- Fastest Growing Segment
- Leading Region
- Key Companies
- Emerging Opportunities
- Executive Summary
- Global Market Outlook
- Demand-side Trends
- Supply-side Trends
- Technology Roadmap Analysis
- Analysis and Recommendations
- Analyst Perspective (What is happening? Why now? What should investors know?)
- Key Questions Answered
- How large is the market?
- What is the CAGR?
- What are key trends?
- Which region dominates?
- Who are the leaders?
- Market Overview
- Market Coverage / Taxonomy
- Market Definition / Scope / Limitations
- Research Methodology
- Chapter Orientation
- Analytical Lens and Working Hypotheses
- Market Structure, Signals, and Trend Drivers
- Benchmarking and Cross-market Comparability
- Market Sizing, Forecasting, and Opportunity Mapping
- Research Design and Evidence Framework
- Desk Research Programme (Secondary Evidence)
- Expert Input and Fieldwork (Primary Evidence)
- Tooling, Models, and Reference Databases
- Data Engineering and Model Build
- Quality Assurance and Audit Trail
- Market Background
- Market Dynamics (Drivers, Restraints, Opportunity, Trends)
- Scenario Forecast (Optimistic, Likely, Conservative)
- Impact Analysis
- AI Impact
- Sustainability Impact
- Regulatory Impact
- Technology Impact
- Consumer / Buyer Analysis
- Purchase Drivers
- Adoption Barriers
- Buyer Journey
- Opportunity Map Analysis
- Product Life Cycle Analysis
- Supply Chain Analysis
- Investment Feasibility Matrix
- Value Chain Analysis
- PESTLE and Porter's Analysis
- Regulatory Landscape
- Regional Parent Market Outlook
- Production and Consumption Statistics
- Import and Export Statistics
- Global Market Analysis and Forecast, 2021 to 2036
- Historical Market Size Value (USD Billion) Analysis, 2021 to 2025
- Current and Future Market Size Value (USD Billion) Projections, 2026 to 2036
- Y-o-Y Growth Trend Analysis
- Absolute $ Opportunity Analysis
- Global Market Pricing Analysis, 2021 to 2036
- Global Market Analysis and Forecast, By Conservation Service, 2021 to 2036
- Introduction / Key Findings
- Historical Market Size Value (USD Billion) Analysis By Conservation Service, 2021 to 2025
- Current and Future Market Size Value (USD Billion) Analysis and Forecast By Conservation Service, 2026 to 2036
- Habitat Restoration
- Ecosystem Rehabilitation
- Native Vegetation Restoration
- Biodiversity Monitoring
- Flora Monitoring
- Fauna Monitoring
- Environmental Impact Assessment
- Baseline Biodiversity Studies
- Post-Mining Assessments
- Species Conservation Programs
- Endangered Species Protection
- Wildlife Corridor Development
- Ecological Offset Services
- Biodiversity Offsets
- Compensatory Conservation Projects
- Habitat Restoration
- Y-o-Y Growth Trend Analysis By Conservation Service, 2021 to 2025
- Absolute $ Opportunity Analysis By Conservation Service, 2026 to 2036
- Global Market Analysis and Forecast, By Application, 2021 to 2036
- Introduction / Key Findings
- Historical Market Size Value (USD Billion) Analysis By Application, 2021 to 2025
- Current and Future Market Size Value (USD Billion) Analysis and Forecast By Application, 2026 to 2036
- Surface Mining
- Open Pit Mining
- Strip Mining
- Underground Mining
- Hard Rock Mining
- Shaft Mining
- Metal Mining
- Precious Metals
- Base Metals
- Coal Mining
- Thermal Coal
- Metallurgical Coal
- Industrial Minerals Mining
- Limestone Mining
- Phosphate Mining
- Surface Mining
- Y-o-Y Growth Trend Analysis By Application, 2021 to 2025
- Absolute $ Opportunity Analysis By Application, 2026 to 2036
- Global Market Analysis and Forecast, By End User, 2021 to 2036
- Introduction / Key Findings
- Historical Market Size Value (USD Billion) Analysis By End User, 2021 to 2025
- Current and Future Market Size Value (USD Billion) Analysis and Forecast By End User, 2026 to 2036
- Mining Companies
- Major Mining Companies
- Mid-Tier Mining Companies
- Environmental Consulting Firms
- Ecological Consultants
- Environmental Engineering Firms
- Government Agencies
- Environmental Authorities
- Forest Departments
- Research Institutions
- Universities
- Environmental Research Centers
- Non-Governmental Organizations
- Conservation Organizations
- Biodiversity Foundations
- Mining Companies
- Y-o-Y Growth Trend Analysis By End User, 2021 to 2025
- Absolute $ Opportunity Analysis By End User, 2026 to 2036
- Global Market Analysis and Forecast, By Deployment Model, 2021 to 2036
- Introduction / Key Findings
- Historical Market Size Value (USD Billion) Analysis By Deployment Model, 2021 to 2025
- Current and Future Market Size Value (USD Billion) Analysis and Forecast By Deployment Model, 2026 to 2036
- On-Site Conservation Programs
- Mine Site Restoration
- Habitat Management
- Managed Environmental Services
- Third-Party Conservation Services
- Long-Term Ecological Management
- Integrated Digital Monitoring
- Remote Biodiversity Monitoring
- GIS-Based Monitoring
- Carbon & Biodiversity Credit Programs
- Nature Credit Projects
- Carbon Offset Integration
- Community-Based Conservation
- Indigenous Conservation Programs
- Local Community Partnerships
- On-Site Conservation Programs
- Y-o-Y Growth Trend Analysis By Deployment Model, 2021 to 2025
- Absolute $ Opportunity Analysis By Deployment Model, 2026 to 2036
- Global Market Analysis and Forecast, By Technology, 2021 to 2036
- Introduction / Key Findings
- Historical Market Size Value (USD Billion) Analysis By Technology, 2021 to 2025
- Current and Future Market Size Value (USD Billion) Analysis and Forecast By Technology, 2026 to 2036
- Remote Sensing & GIS
- Satellite Monitoring
- GIS Mapping
- AI & Data Analytics
- Predictive Biodiversity Analytics
- Automated Species Identification
- IoT Environmental Monitoring
- Sensor Networks
- Water Quality Monitoring
- Drone-Based Monitoring
- Aerial Habitat Surveys
- Wildlife Surveillance
- DNA & Bioacoustic Monitoring
- Environmental DNA (eDNA)
- Acoustic Biodiversity Monitoring
- Remote Sensing & GIS
- Y-o-Y Growth Trend Analysis By Technology, 2021 to 2025
- Absolute $ Opportunity Analysis By Technology, 2026 to 2036
- Global Market Analysis and Forecast, By Region, 2021 to 2036
- Introduction
- Historical Market Size Value (USD Billion) Analysis By Region, 2021 to 2025
- Current Market Size Value (USD Billion) Analysis and Forecast By Region, 2026 to 2036
- North America
- Latin America
- Western Europe
- Eastern Europe
- East Asia
- South Asia and Pacific
- Middle East & Africa
- Market Attractiveness Analysis By Region
- North America Market Analysis and Forecast, By Country, 2021 to 2036
- Historical Market Size Value (USD Billion) Trend Analysis By Market Taxonomy, 2021 to 2025
- Market Size Value (USD Billion) Forecast By Market Taxonomy, 2026 to 2036
- By Country
- USA
- Canada
- By Conservation Service
- By Application
- By End User
- By Deployment Model
- By Technology
- By Country
- Market Attractiveness Analysis
- By Country
- By Conservation Service
- By Application
- By End User
- By Deployment Model
- By Technology
- Key Takeaways
- Latin America Market Analysis and Forecast, By Country
- Historical Market Size Value (USD Billion) Trend Analysis By Market Taxonomy, 2021 to 2025
- Market Size Value (USD Billion) Forecast By Market Taxonomy, 2026 to 2036
- By Country
- Brazil
- Mexico
- Chile
- Rest of Latin America
- By Conservation Service
- By Application
- By End User
- By Deployment Model
- By Technology
- By Country
- Market Attractiveness Analysis
- By Country
- By Conservation Service
- By Application
- By End User
- By Deployment Model
- By Technology
- Key Takeaways
- Western Europe Market Analysis and Forecast, By Country
- Historical Market Size Value (USD Billion) Trend Analysis By Market Taxonomy, 2021 to 2025
- Market Size Value (USD Billion) Forecast By Market Taxonomy, 2026 to 2036
- By Country
- Germany
- UK
- Italy
- Spain
- France
- Nordic
- BENELUX
- Rest of Western Europe
- By Conservation Service
- By Application
- By End User
- By Deployment Model
- By Technology
- By Country
- Market Attractiveness Analysis
- By Country
- By Conservation Service
- By Application
- By End User
- By Deployment Model
- By Technology
- Key Takeaways
- Eastern Europe Market Analysis and Forecast, By Country
- Historical Market Size Value (USD Billion) Trend Analysis By Market Taxonomy, 2021 to 2025
- Market Size Value (USD Billion) Forecast By Market Taxonomy, 2026 to 2036
- By Country
- Russia
- Poland
- Hungary
- Balkan & Baltic
- Rest of Eastern Europe
- By Conservation Service
- By Application
- By End User
- By Deployment Model
- By Technology
- By Country
- Market Attractiveness Analysis
- By Country
- By Conservation Service
- By Application
- By End User
- By Deployment Model
- By Technology
- Key Takeaways
- East Asia Market Analysis and Forecast, By Country
- Historical Market Size Value (USD Billion) Trend Analysis By Market Taxonomy, 2021 to 2025
- Market Size Value (USD Billion) Forecast By Market Taxonomy, 2026 to 2036
- By Country
- China
- Japan
- South Korea
- By Conservation Service
- By Application
- By End User
- By Deployment Model
- By Technology
- By Country
- Market Attractiveness Analysis
- By Country
- By Conservation Service
- By Application
- By End User
- By Deployment Model
- By Technology
- Key Takeaways
- South Asia and Pacific Market Analysis and Forecast, By Country
- Historical Market Size Value (USD Billion) Trend Analysis By Market Taxonomy, 2021 to 2025
- Market Size Value (USD Billion) Forecast By Market Taxonomy, 2026 to 2036
- By Country
- India
- ASEAN
- Australia & New Zealand
- Rest of South Asia and Pacific
- By Conservation Service
- By Application
- By End User
- By Deployment Model
- By Technology
- By Country
- Market Attractiveness Analysis
- By Country
- By Conservation Service
- By Application
- By End User
- By Deployment Model
- By Technology
- Key Takeaways
- Middle East & Africa Market Analysis and Forecast, By Country
- Historical Market Size Value (USD Billion) Trend Analysis By Market Taxonomy, 2021 to 2025
- Market Size Value (USD Billion) Forecast By Market Taxonomy, 2026 to 2036
- By Country
- Kingdom of Saudi Arabia
- Other GCC Countries
- Türkiye
- South Africa
- Other African Union
- Rest of Middle East & Africa
- By Conservation Service
- By Application
- By End User
- By Deployment Model
- By Technology
- By Country
- Market Attractiveness Analysis
- By Country
- By Conservation Service
- By Application
- By End User
- By Deployment Model
- By Technology
- Key Takeaways
- Key Countries Market Analysis
- USA
- Pricing Analysis
- Market Share Analysis, 2025
- By Conservation Service
- By Application
- By End User
- By Deployment Model
- By Technology
- Canada
- Pricing Analysis
- Market Share Analysis, 2025
- By Conservation Service
- By Application
- By End User
- By Deployment Model
- By Technology
- Mexico
- Pricing Analysis
- Market Share Analysis, 2025
- By Conservation Service
- By Application
- By End User
- By Deployment Model
- By Technology
- Brazil
- Pricing Analysis
- Market Share Analysis, 2025
- By Conservation Service
- By Application
- By End User
- By Deployment Model
- By Technology
- Chile
- Pricing Analysis
- Market Share Analysis, 2025
- By Conservation Service
- By Application
- By End User
- By Deployment Model
- By Technology
- Germany
- Pricing Analysis
- Market Share Analysis, 2025
- By Conservation Service
- By Application
- By End User
- By Deployment Model
- By Technology
- UK
- Pricing Analysis
- Market Share Analysis, 2025
- By Conservation Service
- By Application
- By End User
- By Deployment Model
- By Technology
- Italy
- Pricing Analysis
- Market Share Analysis, 2025
- By Conservation Service
- By Application
- By End User
- By Deployment Model
- By Technology
- Spain
- Pricing Analysis
- Market Share Analysis, 2025
- By Conservation Service
- By Application
- By End User
- By Deployment Model
- By Technology
- France
- Pricing Analysis
- Market Share Analysis, 2025
- By Conservation Service
- By Application
- By End User
- By Deployment Model
- By Technology
- India
- Pricing Analysis
- Market Share Analysis, 2025
- By Conservation Service
- By Application
- By End User
- By Deployment Model
- By Technology
- ASEAN
- Pricing Analysis
- Market Share Analysis, 2025
- By Conservation Service
- By Application
- By End User
- By Deployment Model
- By Technology
- Australia & New Zealand
- Pricing Analysis
- Market Share Analysis, 2025
- By Conservation Service
- By Application
- By End User
- By Deployment Model
- By Technology
- China
- Pricing Analysis
- Market Share Analysis, 2025
- By Conservation Service
- By Application
- By End User
- By Deployment Model
- By Technology
- Japan
- Pricing Analysis
- Market Share Analysis, 2025
- By Conservation Service
- By Application
- By End User
- By Deployment Model
- By Technology
- South Korea
- Pricing Analysis
- Market Share Analysis, 2025
- By Conservation Service
- By Application
- By End User
- By Deployment Model
- By Technology
- Russia
- Pricing Analysis
- Market Share Analysis, 2025
- By Conservation Service
- By Application
- By End User
- By Deployment Model
- By Technology
- Poland
- Pricing Analysis
- Market Share Analysis, 2025
- By Conservation Service
- By Application
- By End User
- By Deployment Model
- By Technology
- Hungary
- Pricing Analysis
- Market Share Analysis, 2025
- By Conservation Service
- By Application
- By End User
- By Deployment Model
- By Technology
- Kingdom of Saudi Arabia
- Pricing Analysis
- Market Share Analysis, 2025
- By Conservation Service
- By Application
- By End User
- By Deployment Model
- By Technology
- Türkiye
- Pricing Analysis
- Market Share Analysis, 2025
- By Conservation Service
- By Application
- By End User
- By Deployment Model
- By Technology
- South Africa
- Pricing Analysis
- Market Share Analysis, 2025
- By Conservation Service
- By Application
- By End User
- By Deployment Model
- By Technology
- USA
- Market Structure Analysis
- Competition Dashboard
- Competition Benchmarking
- Market Share Analysis of Top Players
- By Regional
- By Conservation Service
- By Application
- By End User
- By Deployment Model
- By Technology
- Emerging Startups
- Innovation Benchmarking
- Competition Analysis
- Competition Deep Dive
- Rio Tinto
- Overview
- Product Portfolio
- Profitability by Market Segments
- Sales Footprint
- Strategy Overview
- Marketing Strategy
- Product Strategy
- Channel Strategy
- BHP Group
- Anglo American plc
- Glencore plc
- Newmont Corporation
- Barrick Mining Corporation
- Vale S.A.
- Teck Resources
- Freeport-McMoRan
- South32
- Rio Tinto
- Case Studies
- Success Stories
- Recent Developments
- Competition Deep Dive
- Assumptions & Acronyms Used


