
- Market Size (2026)
- USD 250.0 Mn
- Forecast (2036)
- USD 1826.2 Mn
- CAGR (2026 to 2036)
- 22.0%
How big is the Bioenergy with Carbon Capture and Storage (BECCS) Market in 2026?
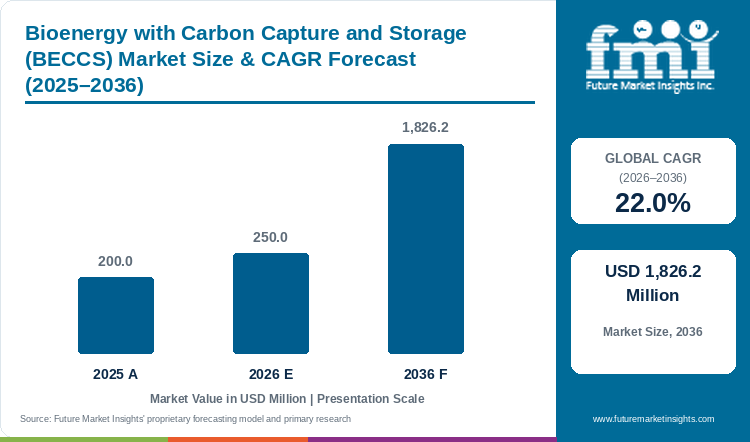
FMI projects the global BECCS market at USD 1,826.2 million in 2036, a 22.0% CAGR over 2026 to 2036. The market was valued at USD 200.0 million in 2025 and is estimated at USD 250.0 million in 2026.
Bioenergy with Carbon Capture and Storage (BECCS) Market Size and Forecast
Table 1: Bioenergy with Carbon Capture and Storage (BECCS) Market Size and Forecast
| Market size and forecast | Value |
|---|---|
| Market size in 2025 | USD 200.0 million |
| Estimated market size in 2026 | USD 250.0 million |
| Projected market size by 2036 | USD 1,826.2 million |
| CAGR from 2026 to 2036 | 22.0% |
Source: Future Market Insights analysis of the bioenergy with carbon capture and storage (BECCS) market, 2026.
Long-term removal purchases are helping selected projects secure construction finance, but demand remains concentrated among a limited number of credit buyers. Stockholm Exergi extended its Microsoft agreement to 5.1 million tonnes over ten years in May 2025. The European Investment Bank separately granted a EUR 260.0 million construction loan for the company's planned Stockholm facility. Those commitments support different parts of the financing package.
Stockholm Exergi said in May that its existing Microsoft agreement remained intact despite a pause in new purchases by that buyer. Drax's February results recorded a GBP 48.0 million UK BECCS impairment while retaining a long-term development option. BECCS growth depends on permitted storage and the timing of signed delivery obligations. Broader carbon capture and storage investment provides shared infrastructure, although fossil-source capture is outside this BECCS valuation.
Key Market Trends & Insights
- Pipeline access remains a material constraint on ethanol-linked expansion. Iowa's October 2026 procedural update describes Summit's revised route and separate future hearings for two laterals.
- Modular capture equipment is reaching large bioenergy projects. SLB Capturi reported installation of five sets of major capture components at Ørsted's Danish sites in February 2025. Installation provides a tangible delivery milestone while commissioning and permanent storage remain separate obligations.
- Storage providers are adding capacity against contracted customers. Northern Lights reported in March 2026 that its operating first phase had stored initial volumes in 2025 and that expansion was progressing toward more than 5.0 million tonnes of annual capacity by 2028. Only the biogenic portion of future throughput belongs in BECCS.
Regional Highlights
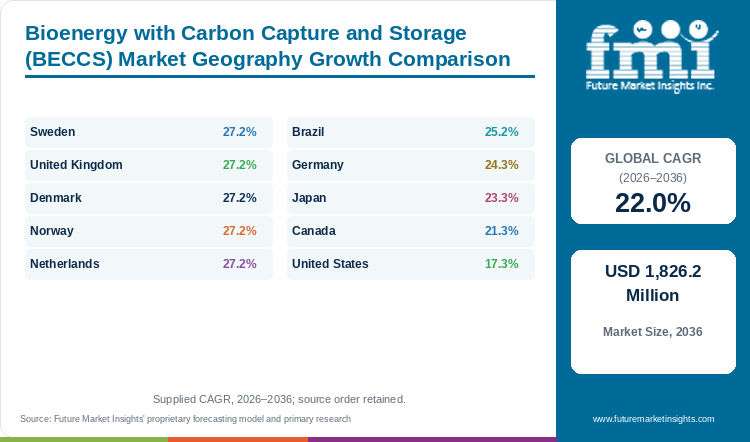
- Sweden, the United Kingdom, Denmark, Norway and the Netherlands share the fastest CAGR in the country outlook at 27.2% over 2026 to 2036, against 22.0% for the global market.
- The United States grows slowest at 17.3% across the same period, followed by Canada at 21.3%. Both sit under the global rate, while Japan at 23.3% is above it.
Analyst Perspective
“The strongest BECCS projects connect an identified biogenic stream with permitted storage and a buyer prepared to accept a specific delivery schedule. Capture equipment alone does not establish a removal business. Commercial advantage increasingly rests with developers that can coordinate credit quality, transport availability and storage performance without exposing customers to an unpriced break in the chain.”
- Nikhil Kaitwade, Principal Consultant, FMI
How is the Bioenergy with Carbon Capture and Storage (BECCS) Market segmented?
- By feedstock source: Ethanol and Biofuel Plants, Biomass Power and Heat, Waste-to-Energy, and Pulp and Other Biogenic.
- By capture technology: Post-Combustion Amine, Pre-Combustion and Fermentation Streams, and Other.
- By project stage: Operating Projects, Under Construction, and Planned and Announced Projects.
- By region: North America, Western Europe, East Asia, Latin America, and Rest of world.
Why does the Ethanol and Biofuel Plants segment lead by Feedstock Source in the Bioenergy with Carbon Capture and Storage (BECCS) Market in 2026?
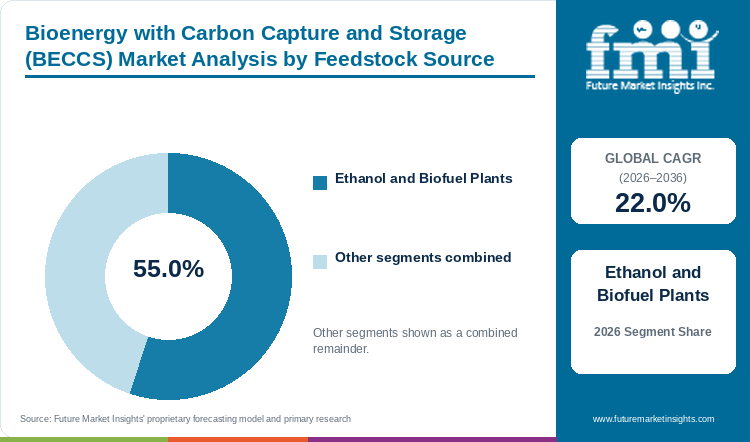
The Ethanol and Biofuel Plants segment holds 55.0% of the Bioenergy with Carbon Capture and Storage (BECCS) Market by feedstock source in 2026.
Ethanol offers an established industrial setting for carbon storage activity. ADM's Decatur operation provides a documented example, and its October 2025 non-binding Super6 memorandum proposed accepting additional captured CO2 for permanent storage.
The commercial attraction is a carbon stream linked to an existing production operation. However, proximity to usable storage and authorization to inject remain decisive. Summit's Iowa record shows that a regional network adds route-specific dependencies that a site-based operation avoids. The fuel business and the carbon business also retain separate customers and payment conditions.
The leading feedstock changes over the forecast horizon. FMI projects Ethanol and Biofuel Plants at USD 663.6 million by 2036, with a 17.1% CAGR and a 36.3% share. Biomass Power and Heat is forecast to reach 45.3% of the feedstock classification by that year. Ethanol remains a growing revenue source, but its initial lead narrows as larger heat-and-power projects enter the commercial base. Suppliers should distinguish the early installed opportunity from the later construction pipeline.
Biomass Power and Heat, Waste-to-Energy and Pulp and Other Biogenic together hold the remaining 45.0% by feedstock source.
Table 2: Feedstock Source, 2026 Share
| Leading Share | 2026 market share |
|---|---|
| Ethanol and Biofuel Plants | 55.0% |
| All Other Segments Combined Share | 45.0% |
Source: Future Market Insights analysis of the bioenergy with carbon capture and storage (BECCS) market, 2026.
Why does the Post-Combustion Amine segment lead by Capture Technology in the Bioenergy with Carbon Capture and Storage (BECCS) Market in 2026?
The Post-Combustion Amine segment holds 68.0% of the Bioenergy with Carbon Capture and Storage (BECCS) Market by capture technology in 2026.
Amine systems have concrete reference projects in biomass heat and waste incineration. SLB Capturi's Kalundborg project description identifies amine-based capture at Ørsted's woodchip and straw-fired stations. Hafslund Celsio describes the same broad solvent family for its planned Klemetsrud retrofit, where the existing waste-energy operation must continue during construction. These examples support a retrofit procurement argument.
Heat integration affects the commercial offer because the host facility has an existing electricity or district-heating obligation. A capture supplier must therefore explain the effect of its equipment on the host operation as well as its gross capture rate. Celsio's project description explicitly addresses steam use and heat recovery.
Alternative technologies remain commercially visible. The selected Capsol technology for the Stockholm project uses hot potassium carbonate, according to the technology provider's March 2025 announcement. It belongs outside the Post-Combustion Amine category. FMI forecasts the amine classification at 69.8% by 2036 and a 22.3% CAGR. This outlook accommodates competing processes while retaining amine capture as the leading revenue category. Feedstock and technology shares must be read independently, since fermentation streams and combustion exhaust follow different separation requirements.
Pre-Combustion and Fermentation Streams and Other together hold the remaining 32.0% by capture technology.
Table 3: Capture Technology, 2026 Share
| Leading Share | 2026 market share |
|---|---|
| Post-Combustion Amine | 68.0% |
| All Other Segments Combined Share | 32.0% |
Source: Future Market Insights analysis of the bioenergy with carbon capture and storage (BECCS) market, 2026.
Why does the Under Construction segment lead by Project Stage in the Bioenergy with Carbon Capture and Storage (BECCS) Market in 2026?
The Under Construction segment holds 46.0% of the Bioenergy with Carbon Capture and Storage (BECCS) Market by project stage in 2026.
Projects under construction lead because revenue in 2026 comes from capture-plant engineering, equipment and installation, billed during the build. The European Investment Bank granted a EUR 260.0 million construction loan for a planned Stockholm facility, and its operator extended a Microsoft agreement to 5.1 million tonnes over ten years in May 2025. Such commitments support the construction financing package.
Operating and announced projects carry different risks. A UK generator recorded a GBP 48.0 million BECCS impairment in February results while retaining a long-term development option, which shows that an announced plant can lose financial support before construction. Operating projects earn revenue through storage service and monitoring, and they depend on permitted storage and signed delivery obligations.
FMI's 2026 assessment values Under Construction at USD 115.0 million. The share should move towards Operating Projects as plants complete, shifting supplier revenue from equipment to storage and monitoring services. Suppliers should plan the mix of build and service revenue across the project life.
Operating Projects and Planned and Announced Projects together hold the remaining 54.0% by project stage.
Table 4: Project Stage, 2026 Share
| Leading Share | 2026 market share |
|---|---|
| Under Construction | 46.0% |
| All Other Segments Combined Share | 54.0% |
Source: Future Market Insights analysis of the bioenergy with carbon capture and storage (BECCS) market, 2026.
What are the key drivers restraints and opportunities?
Long-term removal purchases and access to shared storage support project finance. Permitting delays, uncertain delivery schedules and the cost of integrating capture with existing energy operations constrain investment. Opportunities depend on completing an entire removal chain.
Driver
Contracted demand for permanent removals gives selected developers a revenue commitment against which to arrange finance.
Restraint
A capture project can remain commercially stranded when its transport route, storage authorization or support arrangement is unresolved.
Opportunity
Existing bioenergy sites can add a carbon-removal service where capture integration and an independently deliverable storage route are commercially aligned.
How do purchasing rules and qualification affect bioenergy with carbon capture and storage (BECCS) market demand?
BECCS buyers are purchasing a future environmental service with a defined delivery obligation. The market therefore grows through transactions that can support investment. Stockholm's financing combines an EIB loan with removal-purchase commitments and public support. That combination illustrates why one revenue source rarely explains a large project on its own.
Shared storage changes the geography of participation. A biogenic emitter can use a reservoir it does not own when handling specifications and transport services connect the two sites. Northern Lights' operating phase and planned expansion provide evidence that such a service chain is developing. For capture suppliers, this enlarges the reachable customer base. For developers, it also creates counterparties whose availability and obligations must match the capture plant's commissioning schedule.
What limits reliable bioenergy with carbon capture and storage (BECCS) market supply and quality?
The most consequential risks occur at the interfaces between businesses. A buyer may have a removal agreement while the physical plant remains under construction. A host plant may capture CO2 before a storage connection is ready. A storage service may accept both fossil and biogenic streams. Each case affects what can be sold as a permanent removal and when revenue can be earned.
European certification work explicitly separates permanent removal methods from carbon farming and other activities. Waste-to-energy projects require particular care because only their biogenic fraction can support removal claims. EPA's ADM order provides a separate reminder that subsurface containment and permit compliance continue throughout the commercial life of a storage operation.
Where can suppliers win additional business in the bioenergy with carbon capture and storage (BECCS) market?
District-energy sites offer an opportunity where heat recovery and carbon capture can be designed together. Celsio describes maintaining waste-treatment operations and preserving heat supply during its Klemetsrud project. The commercial opening lies in delivering that integration reliably. Amine solvent capture, a common route for such plants, is covered in FMI's amine based carbon capture market.
The available biomass feedstock also remains subject to sustainability and competing-use constraints. Adjacent lignocellulosic biomass demand matters because the cost and traceability of the material supporting the host energy operation shape a removal project. A project with inexpensive capture but poorly supported biomass sourcing can face a narrower credit-buyer pool. Contracting must address both the physical service and the quality of the removal eventually delivered.
Bioenergy with Carbon Capture and Storage (BECCS) Market by Country (2026 to 2036)
Table 5: Bioenergy with Carbon Capture and Storage (BECCS) Market Country Growth Forecast
| Country | CAGR, 2026 to 2036 |
|---|---|
| Sweden | 27.2% |
| United Kingdom | 27.2% |
| Denmark | 27.2% |
| Norway | 27.2% |
| Netherlands | 27.2% |
| Brazil | 25.2% |
| Germany | 24.3% |
| Japan | 23.3% |
| Canada | 21.3% |
| United States | 17.3% |
Source: Future Market Insights analysis of the bioenergy with carbon capture and storage (BECCS) market, 2026.
Sweden
Stockholm's project makes Sweden a clear example of construction finance supported by future removal sales. The EIB's April 2025 loan announcement identified an expected 2028 start for a facility designed to capture up to 800.0 thousand tonnes annually. Its scale matters to the Swedish opportunity, but annual design capacity must remain separate from delivered and verified removals. Revenue during development can relate to commercial commitments and services before the physical storage chain reaches steady operation.
The Swedish outlook advances at a CAGR of 27.2% between 2026 and 2036, reaching USD 222.2 million by the end of the period. The commercial argument rests on a project with identifiable financing and counterparties. The extended Microsoft agreement for the Stockholm project specifies quality requirements covering biomass sourcing, conservative net-removal quantification and monitoring. These conditions influence the product being sold as well as the engineering needed to deliver it.
Buyer concentration remains a local financing consideration. In May 2026 the project operator said that Microsoft's existing agreement was unaffected by a pause in new purchases. That preserved commitment supports this project, while a pause by a major buyer can still affect the ability of later projects to secure equivalent contracts. Suppliers should distinguish Stockholm's funded construction programme from proposals still searching for customers. Sweden's forecast therefore represents a growing commercial chain whose expansion depends on delivery and repeatable financing.
United Kingdom
The UK opportunity is divided between smaller cluster-linked retrofits and larger options awaiting stronger commercial support. Evero's August 2025 announcement described selection to enter government negotiations for the Ince project within HyNet. Selection for negotiations is an early development stage, ahead of any operating capture service or investment decision.
Drax's February 2026 financial results provide a different signal. The group recorded a GBP 48.0 million UK BECCS impairment and retained a long-term option pending appropriate commercial and regulatory support. The full previously described proposal therefore sits outside current removal production. The market includes different developers facing different funding decisions, even when they use the same BECCS label.
FMI projects UK revenue growth of 27.2% CAGR over 2026 to 2036. The outlook depends on converting selected projects into deliverable contracts and then into operating services. Existing biomass generation offers potential host sites, while a capture retrofit changes steam demand, outage planning and the commercial use of the plant. MHI's earlier Ince announcement identifies a specific technology relationship, which is more informative for supplier positioning than a general statement about national ambition. For buyers of removals, the relevant comparison is between funded milestones and remaining conditions. For equipment providers, it is the point at which negotiations become a confirmed order with a workable transport-and-storage timetable.
Denmark
Denmark's commercial reference is the Kalundborg CO2 Hub, linking two existing biomass-fired energy sites with a shared capture and storage chain. The technology supplier reported installation of five sets of major components in February 2025, divided between Asnæs and Avedøre. The supplier's project description identifies a planned combined capture rate of 430.0 thousand tonnes annually.
The two-site structure creates a more specific procurement opportunity than a single generic capture-plant sale. Equipment delivery must work with two host operations and the handling arrangements connecting them to storage. Standardized capture modules can provide a common equipment platform, while each site retains its own installation and operating interfaces. Installed components reduce uncertainty about physical progress, and commissioning obligations remain open.
Within that setting, FMI forecasts 27.2% annual revenue growth for Denmark from 2026 to 2036. Revenue reaches USD 194.5 million by 2036. The outlook should be read alongside the difference between construction milestones and recurring capture, transport and storage services. Denmark's existing project also has a technology-specific character: the identified process uses amine capture on woodchip and straw combustion streams. Other biogenic sources may require different handling or separation arrangements. Commercial expansion therefore depends on completing the current chain and applying its experience selectively to further projects. A replication programme would still require suitable source plants, storage terms and finance for each additional site.
Norway
Norway earns a distinct position through storage services as well as domestic biogenic capture. Northern Lights reported in March 2026 that its first phase had received and stored initial CO2 in 2025. That is operating infrastructure evidence. The service accepts carbon from different industrial sources, and the relevant opportunity is the biogenic share of contracted transport and permanent storage activity.
Domestic waste-to-energy capture adds another commercial role. Hafslund describes the planned Klemetsrud facility and port terminal, with completion targeted for 2029 after a January 2025 investment decision. Waste treatment and district heating continue to shape the project. Capture must be integrated with those services, while the distinction between fossil and biogenic waste carbon affects removal accounting.
FMI's Norwegian BECCS revenue outlook grows at a 27.2% CAGR from 2026 to 2036. The country combines access to storage infrastructure with a domestic retrofit pipeline, but these activities have different timing and customer relationships. Storage operators need delivery specifications and committed volumes. A waste-energy project needs a plant retrofit that maintains its existing service obligations. The commercial interface between the two determines when removals can be delivered to buyers. Norway's opportunity is consequently broader than selling capture equipment at domestic sites, while its reported BECCS value remains narrower than the full Norwegian CCS industry. Suppliers and investors should keep that boundary visible when comparing contracts or project announcements.
Netherlands
The Dutch carbon-removal strategy gives particular weight to the use of scarce biogenic carbon. Its March 2025 roadmap distinguishes permanent removal from short-lived uses such as beverages and discusses competition between storage and alternative uses of non-fossil CO2. That creates a commercial question beyond identifying a nearby emitter. A capture stream may have an existing utilization outlet, and redirecting it to permanent storage changes both its buyer and its environmental claim.
The roadmap expects a limited role for large-scale biomass-burning BECCS because sustainable feedstock has competing higher-value uses. It identifies biorefinery-linked capture as a more promising route and leaves privately financed BECCS plants permitted. That qualification is central to FMI's 27.2% CAGR outlook for 2026 to 2036, which reaches USD 111.1 million by 2036. The forecast concerns selective commercial activity.
Selling carbon to a short-lived application and purchasing geological storage are different commercial choices. The former may offer an established product outlet, while the latter can support a permanent-removal claim subject to the applicable accounting requirements. Policy and certification therefore influence which route has value for a specific source. The Dutch opportunity is strongest where storage services and credible removal demand can compete with the alternative use of that carbon. Within a wider national CCS industry, only biogenic streams are available for removal sales.
Brazil
Brazil's ethanol industry offers a recognizable source for biogenic carbon, but the local BECCS proposition remains project-specific. FS's published 2030 goals include negative-carbon ethanol at one industrial unit through implementation of BECCS. The same page identifies a 2026 implementation target for Lucas do Rio Verde.
For a Brazilian ethanol producer, the commercial relationship between fuel and carbon is important. Lower-carbon fuel positioning and a sale of permanent removals are separate transactions. They depend on different accounting and contractual requirements, even when they originate at the same plant. The opportunity is to add a carbon service to an existing production business while retaining a clear boundary around what has been stored and what environmental attribute has been sold.
FMI forecasts 25.2% CAGR for Brazil's BECCS revenue from 2026 to 2036, reaching USD 47.5 million by 2036. The relatively small starting allocation reflects an emerging commercial base. In the bioenergy with carbon capture and storage market, Brazil accounts for 2.6% of global revenue by 2036. Brazil grows at 25.2% a year, 3.2 points faster than the global rate. Scale requires more than the availability of fermentation CO2. A storage formation must be assessed and authorized, and the plant's capture and injection schedule must align with buyer commitments. For suppliers, early work can include storage characterization and capture integration, ahead of a fully operating removal chain. FS provides a concrete local development reference for a market that is still emerging.
Germany
Germany's legal position changed before much of the infrastructure required for a larger market could be built. The federal government states that the amended carbon-storage legislation entered into force on 28 November 2025 and expanded the framework beyond research-scale use. That removed an important boundary on development. Capture and storage capacity at biogenic facilities has yet to follow.
The government's explanation also notes that transport and storage infrastructure can take seven to ten years to develop. This timing is relevant to the 2026 to 2036 outlook. A plant owner considering capture must assess the likely availability of a transport connection against the life and operating schedule of its existing facility. A capture proposal that advances faster than its storage route can still face delayed commercial operation.
FMI projects German BECCS revenue growth at a 24.3% CAGR between 2026 and 2036. The country reaches USD 65.7 million by the end of the period. Its growth argument is therefore the development of a newly enabled commercial chain. Biogenic and fossil streams must remain distinguished as broader industrial CCS develops. Waste treatment offers one potential host category, while only the eligible biogenic portion can support a removal claim. Supplier activity is likely to progress through project definition, connection planning and contracting before recurring storage revenue becomes the main measure of scale. A legal pathway is necessary, but the market value depends on infrastructure and customers following it.
Japan
Japan has a documented biomass-capture demonstration base at Mikawa, but capture capability must be separated from a complete permanent-removal service. The Ministry of the Environment describes a liquid-absorbent demonstration at the biomass-fired plant, with capacity to capture more than 600.0 tonnes per day. The programme description covers demonstration work through fiscal 2025.
The local commercial issue is the next connection in the chain. An equipment supplier can demonstrate separation performance at a host plant while the destination, timing and price of each captured tonne remain open. For a buyer seeking permanent removals, those downstream arrangements are central to the purchased service. Japan's capture-equipment experience therefore provides a foundation for future projects while remaining distinct from recurring storage and credit revenue.
FMI expects the Japanese BECCS market to grow at a 23.3% CAGR between 2026 and 2036, reaching USD 60.7 million by 2036. Expansion depends on applying that technical experience to commercially complete projects. The Mikawa description also identifies the use of steam from the power operation, highlighting the importance of evaluating capture together with the host energy plant. The relevant supplier advantage lies in evidence from integrated operation and an offer that accounts for the energy interface. Progress is measured through confirmed delivery arrangements and storage performance. In the bioenergy with carbon capture and storage market, Japan grows 23.3% a year, 1.3 points above the global rate.
Canada
Capital support is a more immediate commercial lever in Canada than an assumed nationwide market for BECCS credits. The Canada Revenue Agency's April 2026 explanation of Bill C-15 describes an extension of full CCUS investment-credit rates through 2035 and separate additions for eligible waste-biomass energy systems under the Clean Technology credit. These are different provisions.
A project must identify which expenditures belong to the energy operation and which belong to capture, transport or storage. It must also have a credible route to permanent storage before a carbon-removal business can be treated as deliverable. Fiscal support can improve the capital position of qualifying expenditure, while continuing operating costs and customer revenue remain separate commercial questions.
Canada's BECCS revenue is projected by FMI to expand at 21.3% CAGR from 2026 to 2036. The forecast reaches USD 68.8 million by 2036. Existing heat and electricity obligations affect whether capture can be integrated economically at a host site. For suppliers, the practical opening is to offer a clearly bounded project package whose expenditure and operating responsibilities can be assessed independently. The commercial case becomes stronger when support eligibility, a storage destination and an eventual removal purchaser reinforce the same project schedule. Canada reaches 3.8% of the global market by 2036. Canada grows at 21.3% a year, 0.7 points slower than the global rate.
United States
Permitted onshore storage gives the United States an existing commercial base, but access is uneven across ethanol producers. ADM's October 2025 Super6 memorandum proposed using the Decatur storage site for additional captured carbon. It was expressly non-binding and remained subject to definitive agreements. The relevant market signal is the proposed use of an established storage operation as a service platform.
FMI forecasts a 17.3% CAGR for the US BECCS market from 2026 to 2036. Revenue reaches USD 677.4 million by 2036, while the country's share declines from 55.0% to 37.1% as other markets expand. The market adds USD 539.9 million over the decade, which is 34.3% of the global increase. Revenue in the United States multiplies 4.9 times by 2036, compared with 7.3 times worldwide. The United States remains the largest single national allocation. New network development adds a different set of execution requirements. Iowa's October 2026 update records changes to Summit's route and separate lateral proceedings with hearings scheduled for 2027. Its 17.3% CAGR runs 4.7 percentage points below the 22.0% global rate.
Storage compliance is also a continuing cost. EPA's Decatur order required measures addressing an unauthorized subsurface release, reinforcing the importance of monitoring and corrective obligations. EPA also said drinking water was not threatened. It does show why an operating history must be assessed alongside current permit performance. For suppliers, the strongest opportunities combine a usable carbon stream with an available storage service.
Who are the notable companies in the Bioenergy with Carbon Capture and Storage (BECCS) Market?
Notable companies in the Bioenergy with Carbon Capture and Storage (BECCS) Market include Archer-Daniels-Midland, Orsted, Drax Group, Stockholm Exergi and SLB Capturi.
ADM, Orsted and Stockholm Exergi connect the market to identifiable bioenergy operations. ADM has a storage site at Decatur and proposed an additional carbon-delivery relationship with Super6 in 2025. Orsted, commonly styled Ørsted, is developing the Kalundborg capture chain at its Danish biomass-energy plants. Stockholm Exergi combines a district-energy host with construction finance and forward removal sales.
Drax Group has a different current investment position. Its 2026 results retain UK BECCS as a long-term option after an impairment, so the full proposed capture scheme remains a development option and not an operating plant. Summit Carbon Solutions is a network developer facing route and permitting proceedings. These two companies belong in the competitive discussion as developers whose portfolios have yet to become operating removal businesses.
SLB Capturi and Mitsubishi Heavy Industries supply capture technology and project capability. Their role differs from selling a removal generated at an owned biogenic source. A customer may contract with a technology supplier, a host-plant owner and a storage provider within one chain. Competitive analysis must therefore compare companies by the commercial function they perform.
Source and integrated project operators: Archer-Daniels-Midland, Orsted, Stockholm Exergi and Drax Group.
Capture technology providers: SLB Capturi and Mitsubishi Heavy Industries.
Carbon network development: Summit Carbon Solutions.
Key Developments in the Bioenergy with Carbon Capture and Storage (BECCS) Market
- In November 2026, Stockholm Exergi reported installing the first two pieces of process equipment at its Beccs Stockholm carbon capture facility. The step moves construction from groundwork and structures to the capture equipment itself.
Key Players in the Bioenergy with Carbon Capture and Storage (BECCS) Market
- Archer-Daniels-Midland
- Orsted
- Drax Group
- Stockholm Exergi
- SLB Capturi
- Mitsubishi Heavy Industries
- Summit Carbon Solutions
Bioenergy with Carbon Capture and Storage (BECCS) Market Report Scope
Table 6: Bioenergy with Carbon Capture and Storage (BECCS) Market Report Scope
| Coverage field | Report scope |
|---|---|
| Market definition | Commercial activity supporting permanent storage of biogenic CO2 from bioenergy and other covered biogenic sources. |
| Revenue coverage | Capture services, transport, permanent storage fees and carbon-removal credits sold. |
| Exclusions | Fossil-source CCS, direct air capture, biochar, temporary CO2 reuse and the underlying value of fuel, electricity or heat. |
| Quantitative Units | USD million |
| Volume basis | Annual million tonnes of CO2. Separate from nameplate capacity and multi-year purchase commitments. |
| Feedstock coverage | Ethanol and Biofuel Plants, Biomass Power and Heat, Waste-to-Energy, Pulp and Other Biogenic. |
| Technology coverage | Post-Combustion Amine, Pre-Combustion and Fermentation Streams, Other. |
| Project Stage coverage | Operating Projects, Under Construction, Planned and Announced Projects. |
| Geography | United States, Sweden, United Kingdom, Denmark, Norway, Netherlands, Canada, Japan, Germany, Brazil and Rest of world aggregate. |
| Companies covered | Archer-Daniels-Midland, Orsted, Drax Group, Stockholm Exergi, SLB Capturi, Mitsubishi Heavy Industries and Summit Carbon Solutions. |
Source: Future Market Insights analysis of the bioenergy with carbon capture and storage (BECCS) market, 2026.
Bioenergy with Carbon Capture and Storage (BECCS) Market Research Methodology
The assessment combines FMI's market outlook with a secondary review of original project, company, financing and government documents. Analysis distinguishes annual carbon activity from design capacity and multi-year removal commitments. Competitive positions reflect verified commercial functions and project status. Coverage isolates biogenic permanent-storage activity and excludes unrelated energy sales, fossil-source CCS and temporary carbon reuse.
Bioenergy with Carbon Capture and Storage (BECCS) Market by Segments
Bioenergy with Carbon Capture and Storage (BECCS) Market segmented by Feedstock Source:
- Ethanol and Biofuel Plants
- Biomass Power and Heat
- Waste-to-Energy
- Pulp and Other Biogenic
Bioenergy with Carbon Capture and Storage (BECCS) Market segmented by Capture Technology:
- Post-Combustion Amine
- Pre-Combustion and Fermentation Streams
- Other
Bioenergy with Carbon Capture and Storage (BECCS) Market segmented by Project Stage:
- Operating Projects
- Under Construction
- Planned and Announced Projects
Bioenergy with Carbon Capture and Storage (BECCS) Market by Region
- North America
- United States
- Canada
- Western Europe
- Sweden
- United Kingdom
- Denmark
- Norway
- Netherlands
- Germany
- East Asia
- Japan
- Latin America
- Brazil
- Rest of world
Research Sources and Bibliography
- ADM. (2025, October 30). ADM, Super6 Carbon Announce Plans to Produce CDR Credits in Decatur.
- Canada Revenue Agency. (2026, April 29). Budget 2025: What Bill C-15 means for the Clean Economy Investment Tax Credits.
- Capsol Technologies. (2025, March 27). FID: Stockholm Exergi moves ahead with first large-scale BECCS.
- Drax Group. (2026, February 26). Full year results for the twelve months ended 31 December 2025.
- European Commission. (n.d.). Certification methodologies: Permanent carbon removals. Accessed 9 November 2026. https://climate.ec.europa.eu/areas-action/carbon-removals-and-carbon-farming/certification-methodologies_en
- European Investment Bank. (2025, April 4). Sweden: EIB finances ground-breaking carbon capture plant in Stockholm. https://www.eib.org/en/press/all/2025-172-eib-finances-ground-breaking-carbon-capture-plant-in-stockholm
- Evero Energy. (2025, August 5). UK's First Bioenergy Carbon Capture and Storage Project Gets Green Light. https://evero.energy/news/Shortlisted
- Federal Government of Germany. (2025, November 28). Weg frei für die Speicherung von Kohlendioxid. https://www.bundesregierung.de/breg-de/suche/speicherung-von-kohlendioxid-2376946
- FS Fueling Sustainability. (n.d.). Metas 2030. Accessed 9 November 2026. https://www.fs.agr.br/investidores/informacoes-asg/metas-2030/
- Government of the Netherlands. (2025, March 14). Netherlands Carbon Dioxide Removal Roadmap. https://www.government.nl/documents/2025/03/14/netherlands-carbon-dioxide-removal-roadmap
- Hafslund. (n.d.). What is a carbon capture facility, and how does it work? Accessed 9 November 2026. https://www.hafslund.no/en/products-and-services/carbon-capture-and-storage/what-is-a-carbon-capture-facility-and-how-does-it-work
- Iowa Utilities Commission. (2026, October 7 update). Summit Carbon Solutions and SCS Carbon Transport: Applications to Construct Hazardous Liquid Pipelines. https://iuc.iowa.gov/customer-assistance/how-do-i-participate-iuc-proceeding/summit-carbon-solutionsscs-carbon
- Ministry of the Environment, Japan. (n.d.). Liquid absorbent separation and recovery technology demonstration project. Accessed 9 November 2026. https://www.env.go.jp/earth/ccs/ccs-liquid.html
- Mitsubishi Heavy Industries. (2023, November 9). Evero partners with Mitsubishi Heavy Industries on Carbon Capture technology for BECCS project in UK's North-West. https://www.mhi.com/news/23110903.html
- Northern Lights. (2026, March 17). Northern Lights Phase 2: Expanding Europe's CO2 Storage Capacity. https://norlights.com/news/northern-lights-phase-2-expanding-europes-co%E2%82%82-storage-capacity/
- SLB Capturi. (2025, February 26). Major SLB Capturi's carbon capture plant components installed at Ørsted Kalundborg CO2 Hub. https://capturi.slb.com/resources/news/2025/major-slb-capturis-carbon-capture-plant-components-installed-at-orsted-kalundborg-co2-hub
- SLB Capturi. (n.d.). Ørsted Kalundborg CO2 Hub: Project overview. Accessed 9 November 2026. https://capturi.slb.com/projects/%C3%B8rsted-kalundborg-co%E2%82%82-hub
- Stockholm Exergi. (2025, May 6). Stockholm Exergi extends landmark carbon removal agreement with Microsoft. https://www.stockholmexergi.se/en/nyheter/stockholm-exergi-extends-landmark-carbon-removal-agreement-with-microsoft/
- Stockholm Exergi. (2026, May 5). Avtalet med Microsoft ligger fast. https://www.stockholmexergi.se/nyheter/avtalet-med-microsoft-ligger-fast/
- Stockholm Exergi. (2026). First process equipment installed at Beccs Stockholm. https://www.stockholmexergi.se/en/nyheter/first-process-equipment-installed-at-beccs-stockholm/
- US Environmental Protection Agency. (2025, August 12). EPA Orders Archer Daniels Midland to Ensure Environmental Compliance of Carbon Sequestration Well in Decatur, Illinois. https://www.epa.gov/newsreleases/epa-orders-archer-daniels-midland-ensure-environmental-compliance-carbon-sequestration
Table of Content
- Key Takeaways
- Market Size and CAGR
- Top Growth Driver
- Fastest Growing Segment
- Leading Region
- Key Companies
- Emerging Opportunities
- Executive Summary
- Global Market Outlook
- Demand-side Trends
- Supply-side Trends
- Technology Roadmap Analysis
- Analysis and Recommendations
- Analyst Perspective (What is happening? Why now? What should investors know?)
- Key Questions Answered
- How large is the market?
- What is the CAGR?
- What are key trends?
- Which region dominates?
- Who are the leaders?
Read More...
- Market Overview
- Market Coverage / Taxonomy
- Market Definition / Scope / Limitations
- Research Methodology
- Chapter Orientation
- Analytical Lens and Working Hypotheses
- Market Structure, Signals, and Trend Drivers
- Benchmarking and Cross-market Comparability
- Market Sizing, Forecasting, and Opportunity Mapping
- Research Design and Evidence Framework
- Desk Research Programme (Secondary Evidence)
- Expert Input and Fieldwork (Primary Evidence)
- Tooling, Models, and Reference Databases
- Data Engineering and Model Build
- Quality Assurance and Audit Trail
- Market Background
- Market Dynamics (Drivers, Restraints, Opportunity, Trends)
- Scenario Forecast (Optimistic, Likely, Conservative)
- Impact Analysis
- AI Impact
- Sustainability Impact
- Regulatory Impact
- Technology Impact
- Consumer / Buyer Analysis
- Purchase Drivers
- Adoption Barriers
- Buyer Journey
- Opportunity Map Analysis
- Product Life Cycle Analysis
- Supply Chain Analysis
- Investment Feasibility Matrix
- Value Chain Analysis
- PESTLE and Porter's Analysis
- Regulatory Landscape
- Regional Parent Market Outlook
- Production and Consumption Statistics
- Import and Export Statistics
- Global Market Analysis and Forecast, 2021 to 2036
- Historical Market Size Value (USD Million) Analysis, 2021 to 2025
- Current and Future Market Size Value (USD Million) Projections, 2026 to 2036
- Y-o-Y Growth Trend Analysis
- Absolute $ Opportunity Analysis
- Global Market Pricing Analysis, 2021 to 2036
- Global Market Analysis and Forecast, By Feedstock Source, 2021 to 2036
- Introduction / Key Findings
- Historical Market Size Value (USD Million) Analysis By Feedstock Source, 2021 to 2025
- Current and Future Market Size Value (USD Million) Analysis and Forecast By Feedstock Source, 2026 to 2036
- Ethanol and Biofuel Plants
- Biomass Power and Heat
- Waste-to-Energy
- Pulp and Other Biogenic
- Y-o-Y Growth Trend Analysis By Feedstock Source, 2021 to 2025
- Absolute $ Opportunity Analysis By Feedstock Source, 2026 to 2036
- Global Market Analysis and Forecast, By Capture Technology, 2021 to 2036
- Introduction / Key Findings
- Historical Market Size Value (USD Million) Analysis By Capture Technology, 2021 to 2025
- Current and Future Market Size Value (USD Million) Analysis and Forecast By Capture Technology, 2026 to 2036
- Post-Combustion Amine
- Pre-Combustion and Fermentation Streams
- Other
- Y-o-Y Growth Trend Analysis By Capture Technology, 2021 to 2025
- Absolute $ Opportunity Analysis By Capture Technology, 2026 to 2036
- Global Market Analysis and Forecast, By Project Stage, 2021 to 2036
- Introduction / Key Findings
- Historical Market Size Value (USD Million) Analysis By Project Stage, 2021 to 2025
- Current and Future Market Size Value (USD Million) Analysis and Forecast By Project Stage, 2026 to 2036
- Operating Projects
- Under Construction
- Planned and Announced Projects
- Y-o-Y Growth Trend Analysis By Project Stage, 2021 to 2025
- Absolute $ Opportunity Analysis By Project Stage, 2026 to 2036
- Global Market Analysis and Forecast, By Region, 2021 to 2036
- Introduction
- Historical Market Size Value (USD Million) Analysis By Region, 2021 to 2025
- Current Market Size Value (USD Million) Analysis and Forecast By Region, 2026 to 2036
- North America
- Western Europe
- East Asia
- Latin America
- Market Attractiveness Analysis By Region
- North America Market Analysis and Forecast, By Country, 2021 to 2036
- Historical Market Size Value (USD Million) Trend Analysis By Market Taxonomy, 2021 to 2025
- Market Size Value (USD Million) Forecast By Market Taxonomy, 2026 to 2036
- By Country
- United States
- Canada
- By Feedstock Source
- By Capture Technology
- By Project Stage
- By Country
- Market Attractiveness Analysis
- By Country
- By Feedstock Source
- By Capture Technology
- By Project Stage
- Key Takeaways
- Western Europe Market Analysis and Forecast, By Country
- Historical Market Size Value (USD Million) Trend Analysis By Market Taxonomy, 2021 to 2025
- Market Size Value (USD Million) Forecast By Market Taxonomy, 2026 to 2036
- By Country
- Sweden
- United Kingdom
- Denmark
- Norway
- Netherlands
- Germany
- By Feedstock Source
- By Capture Technology
- By Project Stage
- By Country
- Market Attractiveness Analysis
- By Country
- By Feedstock Source
- By Capture Technology
- By Project Stage
- Key Takeaways
- East Asia Market Analysis and Forecast, By Country
- Historical Market Size Value (USD Million) Trend Analysis By Market Taxonomy, 2021 to 2025
- Market Size Value (USD Million) Forecast By Market Taxonomy, 2026 to 2036
- By Country
- Japan
- By Feedstock Source
- By Capture Technology
- By Project Stage
- By Country
- Market Attractiveness Analysis
- By Country
- By Feedstock Source
- By Capture Technology
- By Project Stage
- Key Takeaways
- Latin America Market Analysis and Forecast, By Country
- Historical Market Size Value (USD Million) Trend Analysis By Market Taxonomy, 2021 to 2025
- Market Size Value (USD Million) Forecast By Market Taxonomy, 2026 to 2036
- By Country
- Brazil
- Rest of world
- By Feedstock Source
- By Capture Technology
- By Project Stage
- By Country
- Market Attractiveness Analysis
- By Country
- By Feedstock Source
- By Capture Technology
- By Project Stage
- Key Takeaways
- Key Countries Market Analysis
- United States
- Pricing Analysis
- Market Share Analysis, 2025
- By Feedstock Source
- By Capture Technology
- By Project Stage
- Canada
- Pricing Analysis
- Market Share Analysis, 2025
- By Feedstock Source
- By Capture Technology
- By Project Stage
- Brazil
- Pricing Analysis
- Market Share Analysis, 2025
- By Feedstock Source
- By Capture Technology
- By Project Stage
- Germany
- Pricing Analysis
- Market Share Analysis, 2025
- By Feedstock Source
- By Capture Technology
- By Project Stage
- United Kingdom
- Pricing Analysis
- Market Share Analysis, 2025
- By Feedstock Source
- By Capture Technology
- By Project Stage
- Japan
- Pricing Analysis
- Market Share Analysis, 2025
- By Feedstock Source
- By Capture Technology
- By Project Stage
- Sweden
- Pricing Analysis
- Market Share Analysis, 2025
- By Feedstock Source
- By Capture Technology
- By Project Stage
- Denmark
- Pricing Analysis
- Market Share Analysis, 2025
- By Feedstock Source
- By Capture Technology
- By Project Stage
- Norway
- Pricing Analysis
- Market Share Analysis, 2025
- By Feedstock Source
- By Capture Technology
- By Project Stage
- Netherlands
- Pricing Analysis
- Market Share Analysis, 2025
- By Feedstock Source
- By Capture Technology
- By Project Stage
- United States
- Market Structure Analysis
- Competition Dashboard
- Competition Benchmarking
- Market Share Analysis of Top Players
- By Regional
- By Feedstock Source
- By Capture Technology
- By Project Stage
- Emerging Startups
- Innovation Benchmarking
- Competition Analysis
- Competition Deep Dive
- Archer-Daniels-Midland
- Overview
- Product Portfolio
- Profitability by Market Segments
- Sales Footprint
- Strategy Overview
- Marketing Strategy
- Product Strategy
- Channel Strategy
- Orsted
- Drax Group
- Stockholm Exergi
- SLB Capturi
- Mitsubishi Heavy Industries
- Summit Carbon Solutions
- Archer-Daniels-Midland
- Case Studies
- Success Stories
- Recent Developments
- Competition Deep Dive
- Assumptions & Acronyms Used
List of Tables
- Table 1: Global Market Value (USD Million) Forecast by Region, 2021 to 2036
- Table 2: Global Market Value (USD Million) Forecast by Feedstock Source, 2021 to 2036
- Table 3: Global Market Value (USD Million) Forecast by Capture Technology, 2021 to 2036
- Table 4: Global Market Value (USD Million) Forecast by Project Stage, 2021 to 2036
- Table 5: North America Market Value (USD Million) Forecast by Country, 2021 to 2036
- Table 6: North America Market Value (USD Million) Forecast by Feedstock Source, 2021 to 2036
- Table 7: North America Market Value (USD Million) Forecast by Capture Technology, 2021 to 2036
- Table 8: North America Market Value (USD Million) Forecast by Project Stage, 2021 to 2036
- Table 9: Western Europe Market Value (USD Million) Forecast by Country, 2021 to 2036
- Table 10: Western Europe Market Value (USD Million) Forecast by Feedstock Source, 2021 to 2036
- Table 11: Western Europe Market Value (USD Million) Forecast by Capture Technology, 2021 to 2036
- Table 12: Western Europe Market Value (USD Million) Forecast by Project Stage, 2021 to 2036
- Table 13: East Asia Market Value (USD Million) Forecast by Country, 2021 to 2036
- Table 14: East Asia Market Value (USD Million) Forecast by Feedstock Source, 2021 to 2036
- Table 15: East Asia Market Value (USD Million) Forecast by Capture Technology, 2021 to 2036
- Table 16: East Asia Market Value (USD Million) Forecast by Project Stage, 2021 to 2036
- Table 17: Latin America Market Value (USD Million) Forecast by Country, 2021 to 2036
- Table 18: Latin America Market Value (USD Million) Forecast by Feedstock Source, 2021 to 2036
- Table 19: Latin America Market Value (USD Million) Forecast by Capture Technology, 2021 to 2036
- Table 20: Latin America Market Value (USD Million) Forecast by Project Stage, 2021 to 2036
List of Figures
- Figure 1: Global Market Pricing Analysis
- Figure 2: Global Market Value (USD Million) Forecast 2021-2036
- Figure 3: Global Market Value Share and BPS Analysis by Feedstock Source, 2026 and 2036
- Figure 4: Global Market Y-o-Y Growth Comparison by Feedstock Source, 2026-2036
- Figure 5: Global Market Attractiveness Analysis by Feedstock Source
- Figure 6: Global Market Value Share and BPS Analysis by Capture Technology, 2026 and 2036
- Figure 7: Global Market Y-o-Y Growth Comparison by Capture Technology, 2026-2036
- Figure 8: Global Market Attractiveness Analysis by Capture Technology
- Figure 9: Global Market Value Share and BPS Analysis by Project Stage, 2026 and 2036
- Figure 10: Global Market Y-o-Y Growth Comparison by Project Stage, 2026-2036
- Figure 11: Global Market Attractiveness Analysis by Project Stage
- Figure 12: Global Market Value (USD Million) Share and BPS Analysis by Region, 2026 and 2036
- Figure 13: Global Market Y-o-Y Growth Comparison by Region, 2026-2036
- Figure 14: Global Market Attractiveness Analysis by Region
- Figure 15: North America Market Incremental Dollar Opportunity, 2026-2036
- Figure 16: Western Europe Market Incremental Dollar Opportunity, 2026-2036
- Figure 17: East Asia Market Incremental Dollar Opportunity, 2026-2036
- Figure 18: Latin America Market Incremental Dollar Opportunity, 2026-2036
- Figure 19: North America Market Value Share and BPS Analysis by Country, 2026 and 2036
- Figure 20: North America Market Value Share and BPS Analysis by Feedstock Source, 2026 and 2036
- Figure 21: North America Market Y-o-Y Growth Comparison by Feedstock Source, 2026-2036
- Figure 22: North America Market Attractiveness Analysis by Feedstock Source
- Figure 23: North America Market Value Share and BPS Analysis by Capture Technology, 2026 and 2036
- Figure 24: North America Market Y-o-Y Growth Comparison by Capture Technology, 2026-2036
- Figure 25: North America Market Attractiveness Analysis by Capture Technology
- Figure 26: North America Market Value Share and BPS Analysis by Project Stage, 2026 and 2036
- Figure 27: North America Market Y-o-Y Growth Comparison by Project Stage, 2026-2036
- Figure 28: North America Market Attractiveness Analysis by Project Stage
- Figure 29: Western Europe Market Value Share and BPS Analysis by Country, 2026 and 2036
- Figure 30: Western Europe Market Value Share and BPS Analysis by Feedstock Source, 2026 and 2036
- Figure 31: Western Europe Market Y-o-Y Growth Comparison by Feedstock Source, 2026-2036
- Figure 32: Western Europe Market Attractiveness Analysis by Feedstock Source
- Figure 33: Western Europe Market Value Share and BPS Analysis by Capture Technology, 2026 and 2036
- Figure 34: Western Europe Market Y-o-Y Growth Comparison by Capture Technology, 2026-2036
- Figure 35: Western Europe Market Attractiveness Analysis by Capture Technology
- Figure 36: Western Europe Market Value Share and BPS Analysis by Project Stage, 2026 and 2036
- Figure 37: Western Europe Market Y-o-Y Growth Comparison by Project Stage, 2026-2036
- Figure 38: Western Europe Market Attractiveness Analysis by Project Stage
- Figure 39: East Asia Market Value Share and BPS Analysis by Country, 2026 and 2036
- Figure 40: East Asia Market Value Share and BPS Analysis by Feedstock Source, 2026 and 2036
- Figure 41: East Asia Market Y-o-Y Growth Comparison by Feedstock Source, 2026-2036
- Figure 42: East Asia Market Attractiveness Analysis by Feedstock Source
- Figure 43: East Asia Market Value Share and BPS Analysis by Capture Technology, 2026 and 2036
- Figure 44: East Asia Market Y-o-Y Growth Comparison by Capture Technology, 2026-2036
- Figure 45: East Asia Market Attractiveness Analysis by Capture Technology
- Figure 46: East Asia Market Value Share and BPS Analysis by Project Stage, 2026 and 2036
- Figure 47: East Asia Market Y-o-Y Growth Comparison by Project Stage, 2026-2036
- Figure 48: East Asia Market Attractiveness Analysis by Project Stage
- Figure 49: Latin America Market Value Share and BPS Analysis by Country, 2026 and 2036
- Figure 50: Latin America Market Value Share and BPS Analysis by Feedstock Source, 2026 and 2036
- Figure 51: Latin America Market Y-o-Y Growth Comparison by Feedstock Source, 2026-2036
- Figure 52: Latin America Market Attractiveness Analysis by Feedstock Source
- Figure 53: Latin America Market Value Share and BPS Analysis by Capture Technology, 2026 and 2036
- Figure 54: Latin America Market Y-o-Y Growth Comparison by Capture Technology, 2026-2036
- Figure 55: Latin America Market Attractiveness Analysis by Capture Technology
- Figure 56: Latin America Market Value Share and BPS Analysis by Project Stage, 2026 and 2036
- Figure 57: Latin America Market Y-o-Y Growth Comparison by Project Stage, 2026-2036
- Figure 58: Latin America Market Attractiveness Analysis by Project Stage
- Figure 59: Global Market - Tier Structure Analysis
- Figure 60: Global Market - Company Share Analysis
Frequently Asked Questions
How big is the bioenergy with carbon capture and storage (BECCS) market in 2026?
FMI estimates the market at USD 250.0 million in 2026, up from USD 200.0 million in 2025. It is forecast to reach USD 1,826.2 million by 2036 at a 22.0% CAGR.
Which feedstock source leads the bioenergy with carbon capture and storage (BECCS) market in 2026?
Ethanol and Biofuel Plants leads by feedstock source with 55.0% in 2026. All other segments together hold 45.0%.
Which capture technology and project stage lead in 2026?
Post-Combustion Amine holds 68.0% by capture technology and Under Construction holds 46.0% by project stage in FMI's 2026 assessment.
Which market is forecast to grow fastest through 2036?
Sweden, United Kingdom, Denmark, Norway and Netherlands tie for the highest forecast CAGR at 27.2% during 2026 to 2036, followed by Brazil at 25.2%.
Does signing a removal purchase mean the carbon has already been stored?
No. A forward purchase can help finance future delivery. Stockholm's construction financing and planned 2028 operation illustrate why a signed commitment must be distinguished from physically delivered removals.[1][2]
Preview the report firsthand - request a free sample
Get SampleGet the brochure for pricing and purchase details.
Get PDF
