

- Market Size (2026)
- USD 2.6 Bn
- Forecast (2036)
- USD 5.6 Bn
- CAGR (2026 to 2036)
- 8.0%
Blended Hydraulic-Regenerative Brake Systems Market Size, Market Forecast and Outlook By FMI
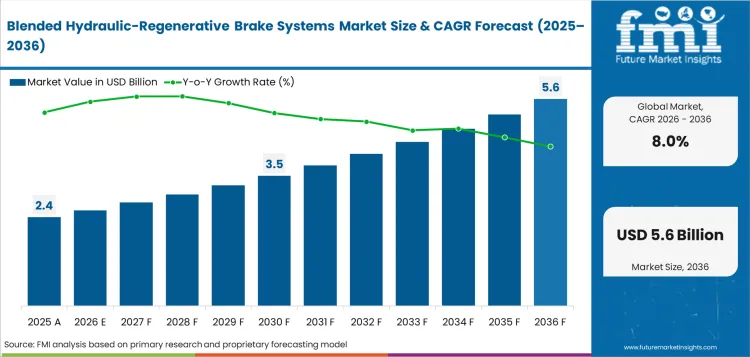
The blended hydraulic-regenerative brake systems market was valued at USD 2.4 billion in 2025. Industry revenue is expected to surpass USD 2.6 billion in 2026 and rise to USD 5.6 billion by 2036 at 8.0% CAGR. OEM line-fit is set to represent 79.3% share of sales channel in 2026. Electro-hydraulic brake systems are forecast to account for 57.1% share of system architecture in 2026.
Summary of Blended Hydraulic-Regenerative Brake Systems Market
- Demand and Growth Drivers
- EV platform growth creates steady need for hydraulic backup paired with energy recovery control.
- Automatic emergency braking rules raise validation needs for pressure control and fail-safe response.
- Brake particle regulation increases interest in regenerative braking lowering friction-brake use.
- Product and Segment View
- OEM line-fit is projected to account for 79.3% share in 2026 since brake blending is approved during vehicle launch.
- Electro-hydraulic brake systems are forecast to capture 57.1% share in 2026 as existing hydraulic circuits reduce platform risk.
- Passenger electric vehicles are expected to represent 68.4% share in 2026 due to higher EV model flow.
- Geography and Competitive Outlook
- China is projected to record 9.4% CAGR by 2036 through high electric car penetration and local supplier depth.
- India is expected to expand at 8.8% CAGR by 2036 as domestic EV assembly gains policy support.
- Bosch and ZF anchor supply through hydraulic brake-by-wire work and electro-hydraulic control experience.
- Analyst Opinion
- Nikhil Kaitwade, Principal Analyst for Automotive at FMI, observes, “Brake blending has moved from a hidden calibration task into a sourcing filter for electric vehicle platforms. Vehicle makers need systems that are able to recover energy without changing pedal feel. Suppliers combining hydraulic fallback with software control will have a clear advantage during platform nomination.”
- Blended Hydraulic-Regenerative Brake Systems Market Value Analysis
- Market value is tied to automotive regenerative braking in which friction braking and motor recovery must share control smoothly.
- Supplier pricing reflects actuators and control software required to clear vehicle-level validation.
- Replacement value stays limited since most systems are factory integrated and tied to vehicle safety approvals.
- Premium demand comes from EV platforms requiring stable pedal feel during automatic emergency braking events.
Key Takeaways, Market Size, and Forecast
- The blended hydraulic-regenerative brake systems market stood at USD 2.4 billion in 2025.
- Industry value is expected to reach USD 5.6 billion by 2036 as electrified platforms need smoother brake blending.
- From 2026 to 2036, the sector is set to expand at 8.0% CAGR.
- Industry revenue is forecast to create incremental opportunity of USD 3.0 billion from 2026 to 2036.
- OEM line-fit is expected to account for 79.3% share of sales channel in 2026.
- Electro-hydraulic brake systems are forecast to capture 57.1% share of system architecture in 2026.
- China is projected to expand at 9.4% CAGR, followed by India at 8.8% CAGR by 2036.
Brake blending is shifting from a comfort feature to a core requirement for electric vehicles. May 2026 International Energy Agency data showed global electric car sales exceeded 20 million in 2025 and reached 25.0% of new car sales. Vehicle makers are required to ensure a consistent pedal feel by integrating regenerative braking and stability control under a single system.
Safety rules are raising the value of controlled pressure build-up during emergency events. In April 2024, the United States National Highway Traffic Safety Administration finalized Federal Motor Vehicle Safety Standard No. 127 for automatic emergency braking on cars and light trucks by September 2029. European Union Euro 7 rules adopted in 2024 brought brake particle limits into vehicle type approval. Combined safety and emissions pressure provide suppliers a clearer route for advanced brake control systems.
Blended Hydraulic-Regenerative Brake Systems Market Definition
Blended hydraulic-regenerative brake systems combine hydraulic pressure control with regenerative torque control in electric and hybrid vehicles. Scope covers electro-hydraulic brake units, brake-by-wire control modules and calibration software managing the shift between motor braking and friction braking. Revenue includes factory-fitted systems, control modules and service calibration tied to vehicle programs. Pure mechanical brakes and standalone friction parts are excluded unless sold as part of the blending architecture.
Blended Hydraulic-Regenerative Brake Systems Market Inclusions
Scope includes electro-hydraulic brake systems supplied to passenger electric vehicles and hybrid passenger cars. Scope includes vacuum eBooster systems, pedal simulators and powertrain domain integrated brake controls. EV regenerative braking control systems are counted if hydraulic pressure support remains part of the safety architecture. Factory calibration and service replacement modules are included if tied to a specific brake blending platform.
Blended Hydraulic-Regenerative Brake Systems Market Exclusions
Scope excludes conventional hydraulic brakes sold without regenerative control. Scope excludes standalone brake pads, rotors and friction consumables. Purely mechanical parking brakes and unrelated chassis sensors are outside scope. Software tools are excluded unless sold with certified braking calibration support for a named vehicle platform.
Blended Hydraulic-Regenerative Brake Systems Market Research Methodology
- Primary Research: FMI analysts reviewed sourcing needs across automakers, brake module suppliers and vehicle calibration teams.
- Desk Research: Official safety rules and electric vehicle sales data supported demand checks across major vehicle markets.
- Market Sizing and Forecasting: Forecast values used blended brake system anchors and cross-checks against regenerative braking adoption.
- Data Validation: Checks compared 2026 value with 2036 value and tested country rates against EV sales signals.
Why is the Blended Hydraulic-Regenerative Brake Systems Market Growing?
- Electrified vehicle programs are expanding the need for factory-calibrated brake blending.
- Safety and emissions rules are making brake control validation more important.
- Automakers need stable pedal feel with lower friction-brake use in city driving.
Growth should strengthen as electrified vehicle programs move brake blending into platform approval instead of service replacement. European Automobile Manufacturers’ Association reported 1,880,370 EU battery-electric registrations and 3,733,325 hybrid-electric registrations in 2025. Such volumes show a clear fitment pool for systems shifting between motor recovery and hydraulic pressure during everyday stops. Safety validation gives the market a second growth route since the United States National Highway Traffic Safety Administration projects Federal Motor Vehicle Safety Standard No. 127 will prevent at least 24,000 injuries each year. Euro 7 adds a demand signal by setting brake particle limits at 3 mg/km for pure electric vehicles and 7 mg/km for most other light-vehicle powertrains until the end of 2029. Automakers will therefore assess blended brake systems on recovery control and friction-wear reduction.
Market Segmentation Analysis
- Electro-hydraulic brake systems are forecast to capture 57.1% share in 2026, led by hydraulics protecting fallback response during EV platform changeover.
- Passenger electric vehicles are projected to account for 68.4% share in 2026 since high EV output makes factory brake blending routine.
- Brake-by-wire integrated systems are expected to represent 46.8% share in 2026 through stronger control over pedal feel and pressure timing.
- OEM line-fit is projected to hold 79.3% share in 2026 as vehicle makers approve safety-critical braking before production release.
Segmentation is divided into four parent groups based on how automakers specify the system. System architecture separates hydraulic backup from electric actuation. Vehicle type shows how electrified vehicle programs drive fitment. Integration level captures control depth inside chassis software. Sales channel reflects the safety-critical nature of brake blending and its limited aftermarket exposure.
Insights into Blended Hydraulic-Regenerative Brake Systems Market by System Architecture
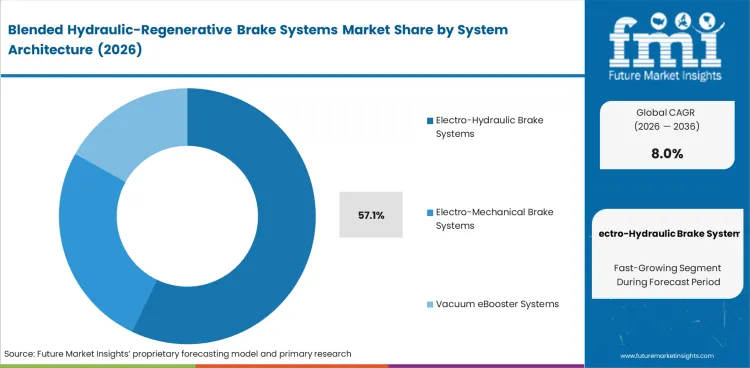
- Electro-hydraulic brake systems are projected to account for 57.1% share in 2026, driven by hydraulic pressure remaining trusted during fault fallback and emergency stops.
- Electro-mechanical brake systems gain attention in premium programs as suppliers test dry actuation with fewer fluid circuits.
Insights into Blended Hydraulic-Regenerative Brake Systems Market by Vehicle Type
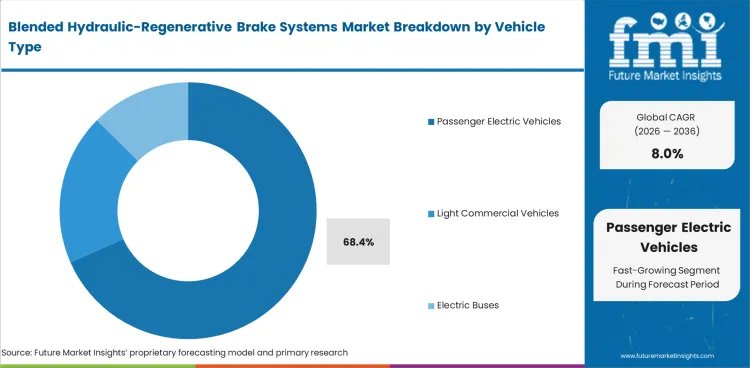
- Passenger electric vehicles are expected to represent 68.4% share in 2026 due to global electric car sales creating the broadest factory-fit pool.
- Light commercial vehicles adopt brake blending more slowly led by durability checks and payload use requiring longer validation cycles.
Insights into Blended Hydraulic-Regenerative Brake Systems Market by Integration Level
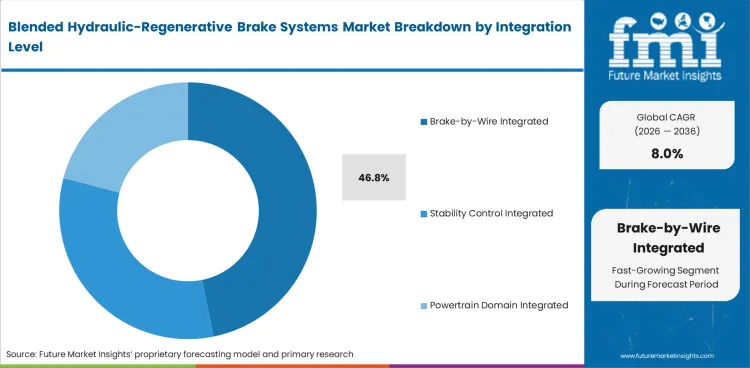
- Brake-by-wire integrated systems are projected to account for 46.8% share in 2026 as pedal request and pressure command can be separated cleanly.
- Stability control integrated systems keep relevance in mass vehicles linking brake pressure with anti-lock and skid control.
Insights into Blended Hydraulic-Regenerative Brake Systems Market by Sales Channel
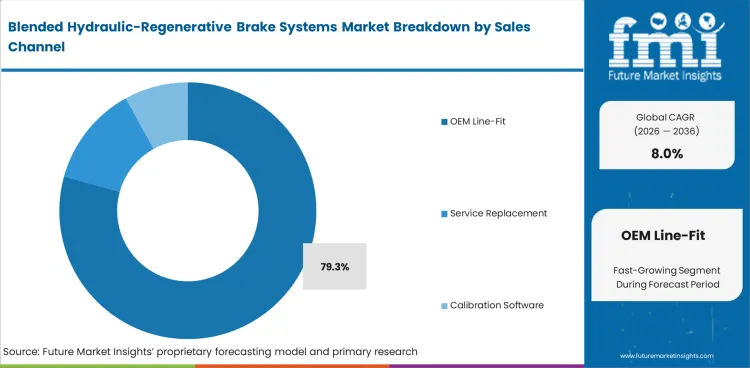
- OEM line-fit is forecast to account for 79.3% share in 2026 since safety approval and software calibration happen before vehicle launch.
- Service replacement demand stays tied to certified modules since unofficial parts can disturb brake feel and fault response.
Blended Hydraulic-Regenerative Brake Systems Market Drivers, Restraints and Opportunities
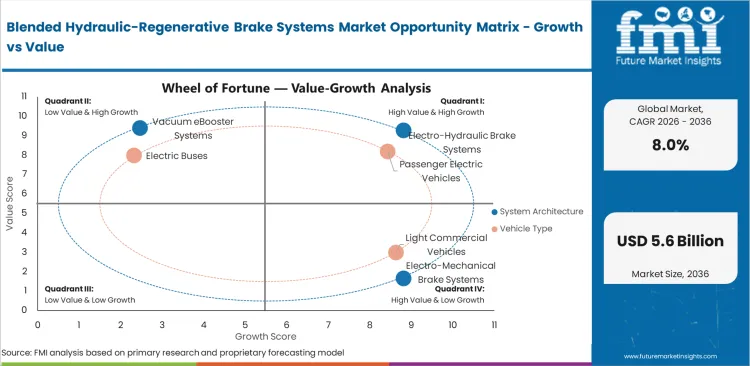
- EV brake control needs smoother torque handover between motor recovery and hydraulic backup.
- Safety validation raises entry cost for suppliers without vehicle-level brake software depth.
- Brake-by-wire architectures open software gains in wear control and EV range support.
Growth is expected to move toward factory vehicle programs as brake blending becomes part of chassis software validation. Nexteer launched its Electro-Mechanical Brake system in April 2025 and positioned it as a brake-by-wire solution for software-defined chassis integration. The system uses high-precision braking powered by actuators at each wheel, directly supporting EV programs requiring steady pedal feel and controlled pressure response. Validation remains the main restraint since safety bodies are widening test coverage. Euro NCAP said in November 2025, its 2026 protocols will assess four safety stages, with each scored out of 100 points. Crash-avoidance testing will cover broader real-world scenarios, including automated braking and urban road users. Smaller suppliers may face higher test and software costs. Suppliers with proven brake-by-wire controls are positioned to win as automakers seek lower wear and more flexible chassis software.
Application-wise Equipment Deployment Analysis
Factory placement should stay centered on passenger EV platforms since brake blending has to be calibrated with the e-axle and stability controls before vehicle release. Driver assistance functions add another validation layer as automated braking has to share control with regeneration and hydraulic pressure. Toyota’s March 2026 C-HR+ launch note identifies a dedicated eTNGA battery electric platform, four selectable regenerative braking levels and coasting deceleration of up to 0.15 G. Toyota also states the system can compensate for up to 80.0% of deceleration during driving, supporting a shift toward platform-level braking software. Electric buses can add value in stop-start routes, and passenger EV programs will keep the main volume path.
Import Dependence and Trade Flow Analysis
Import dependence should be read through vehicle electronics and not only finished brake modules. S&P Global Mobility reported in October 2025, Nexperia parts are used in nearly every electronic control unit in modern vehicles. It also stated that about 80.0% of Nexperia’s end-product capacity was in mainland China by mid-2025, with 70.0% from Dongguan. Brake blending relies on stable electronic control unit supply for pressure commands and fault monitoring. Any disruption in chips can therefore slow brake module qualification before final vehicle assembly. Suppliers with local electronics sourcing and second-source qualification will be better placed during EV platform launches.
Analysis of Blended Hydraulic-Regenerative Brake Systems Market by Key Countries
.webp "Top Country Growth Comparison Blended Hydraulic Regenerative Brake Systems Market Cagr (2026 2036)")
| Country | CAGR |
|---|---|
| China | 9.4% |
| India | 8.8% |
| South Korea | 8.3% |
| Germany | 7.7% |
| United States | 7.5% |
| United Kingdom | 7.1% |
| Japan | 6.6% |
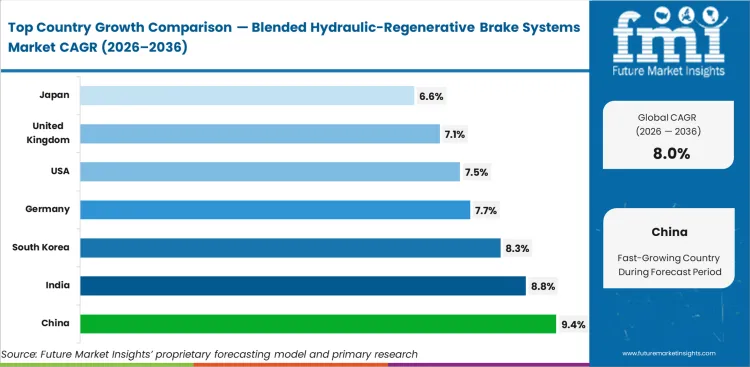
Source: Future Market Insights, 2026.
Blended Hydraulic-Regenerative Brake Systems Market CAGR Analysis by Country
- China is projected to record 9.4% CAGR by 2036, led by high EV penetration lifting demand for integrated brake blending.
- India is expected to expand at 8.8% CAGR by 2036, reflecting domestic EV programs adding local brake control needs.
- South Korea is forecast to grow at 8.3% CAGR by 2036 due to supplier testing depth and faster EV uptake.
- Germany is expected to advance at 7.7% CAGR by 2036 through premium EV platforms and brake-by-wire validation.
- United States is projected to rise at 7.5% CAGR by 2036 as automatic emergency braking rules shape brake system design.
- United Kingdom is forecast at 7.1% CAGR by 2036 since zero-emission vehicle targets influence brake electronics sourcing.
- Japan is expected to post 6.6% CAGR by 2036 with hybrid platforms and cooperative regenerative braking launches.
Country performance differs by EV penetration and safety-rule timing. China and India track above the global rate led by electric car growth expanding the factory-fit pool. Japan stays below the global rate since its EV share remains modest, although hybrid platforms keep cooperative regenerative braking relevant. South Korea and Germany hold stronger readiness due to braking supplier capability and winter validation depth.
Demand Outlook for Blended Hydraulic-Regenerative Brake Systems in China
Demand in China is projected to record 9.4% CAGR by 2036, driven by EV penetration giving brake blending a large factory-fit route. International Energy Agency data published in May 2026 showed China sold more than 13 million electric cars in 2025 and reached almost 55.0% sales share. High EV penetration makes pedal feel and energy recovery part of mass vehicle engineering instead of a premium-only feature.
- High electric car volume supports repeated sourcing of electro-hydraulic control units.
- Domestic platform scale gives local suppliers a route to improve calibration experience.
- City driving cycles favor regenerative braking cutting friction-brake use during frequent stops.
Demand Analysis of Blended Hydraulic-Regenerative Brake Systems in India
Industry in India is expected to expand at 8.8% CAGR by 2036, led by domestic EV assembly integrating into a broader model cycle. May 2026 International Energy Agency data showed Indian electric car sales rose 75.0% in 2025 to 165 thousand units. Model availability rose from 33 to 45 between 2024 and 2025, which widens the engineering pool for brake blending.
- Domestic assembly encourages local validation of hydraulic backup and software maps.
- Compact EV programs need cost-controlled systems keeping pedal feel acceptable.
- Service networks will need certified calibration tools as electric models spread beyond major cities.
Growth Outlook for Blended Hydraulic-Regenerative Brake Systems in South Korea
The sector in South Korea is forecast to grow at 8.3% CAGR by 2036 due to fast EV uptake and supplier testing depth. Electric car sales in Korea grew by around 65.0% year on year in 2025 and passed 200,000 units. Braking suppliers can use local automaker programs to test cold-weather response and high-speed stability before export nomination.
- Local automakers make South Korea important for integrated brake control release work.
- Winter and highway validation support software tuning for brake-by-wire and hydraulic fallback.
- Supplier gains will depend on meeting automaker targets for pedal feel during regeneration.
Industry Outlook for Blended Hydraulic-Regenerative Brake Systems in Germany
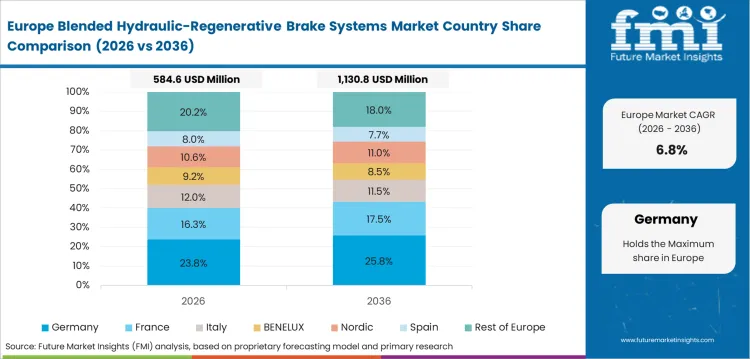
The market in Germany is expected to advance at 7.7% CAGR by 2036 through premium EV platforms and brake-by-wire work. International Energy Agency data showed Germany sold about 850,000 electric cars in 2025 with roughly 30.0% sales share. Premium vehicle programs make Germany a key engineering center for brake-by-wire validation and hydraulic fallback design.
- Premium EV platforms support higher value brake blending systems with stronger redundancy needs.
- Supplier engineering depth supports pressure actuator testing and safety-case documentation.
- Euro 7 brake particle limits give regenerative control a clearer role in type-approval planning.
Demand Outlook for Blended Hydraulic-Regenerative Brake Systems in the United States
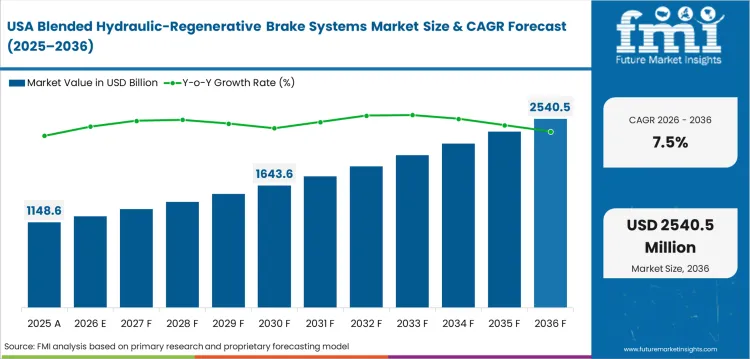
United States demand is projected to rise at 7.5% CAGR by 2036 as safety rules shape future brake control. United States safety regulators finalized a rule in April 2024 requiring automatic emergency braking on cars and light trucks by September 2029. Brake blending suppliers must support quick pressure response during software-triggered braking events.
- Automatic emergency braking rules raise the value of reliable pressure build-up under sensor command.
- EV demand remains selective but the platform mix keeps brake blending important in premium models.
- Supplier screening will favor validated systems supporting both driver braking and automated intervention.
Demand Analysis of Blended Hydraulic-Regenerative Brake Systems in the United Kingdom
Demand in the United Kingdom is forecast at 7.1% CAGR by 2036 since zero-emission vehicle targets shape platform planning. International Energy Agency data showed United Kingdom BEV sales grew by more than 25.0% in 2025 and approached half a million units. Fleet electrification keeps brake blending significant for passenger cars and light commercial vehicles.
- Zero-emission vehicle compliance encourages automakers to fit integrated brake electronics early.
- Fleet channels value predictable pedal response across urban stop-start use.
- Service demand will center on certified replacement modules instead of open aftermarket parts.
Sales Analysis of Blended Hydraulic-Regenerative Brake Systems in Japan
Sales in Japan are expected to post 6.6% CAGR by 2036, reflecting hybrid platforms and cooperative regenerative braking launches. International Energy Agency data showed Japanese electric car sales sat just above 100,000 units in 2025 with less than 3.0% sales share. Hybrid vehicle depth keeps cooperative regenerative braking important even as battery-electric penetration rises slowly.
- Hybrid programs support brake blending balancing motor recovery with hydraulic pressure.
- Quality-focused automakers favor mature electro-hydraulic systems before broader dry braking moves.
- Supplier activity from ADVICS keeps Japan important for cooperative regenerative braking design.
Competitive Landscape and Strategic Positioning
- Electro-hydraulic suppliers hold an advantage by combining actuator hardware with brake software validation.
- Brake-by-wire specialists compete by proving stable brake feel and reliable fallback response across vehicle platforms.
- Calibration partners gain value by helping automakers shorten release timelines for EV model variants.
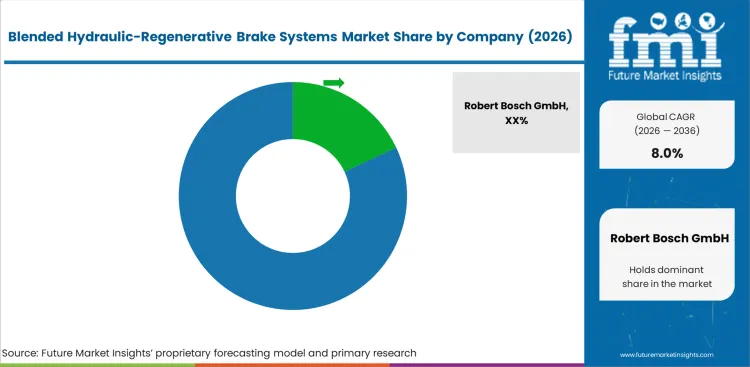
Competition is led by suppliers that combine brake control hardware, vehicle safety records, and software release experience. Bosch and ZF hold strong positions in hydraulic brake-by-wire and integrated brake control. Continental adds electronic brake control depth, while ADVICS brings cooperative regenerative braking experience from Japanese EV programs. Brembo strengthens its position through Sensify production and software-defined braking capability.
Supplier selection will depend on proven pressure control and disciplined software release work. Hyundai Mobis supports its position through winter testing and integrated chassis demonstrations for global automakers. Hitachi Astemo and Continental remain relevant through electronic control depth across chassis systems. Companies that can prove brake feel and platform readiness are best placed to win EV brake system awards.
Key Companies in the Blended Hydraulic-Regenerative Brake Systems Market
Competitive structure is grouped by integrated brake control suppliers, cooperative regenerative braking specialists and chassis software firms.
- Integrated Brake Control Suppliers: Robert Bosch GmbH, ZF Friedrichshafen AG and Continental AG supply brake control platforms with global automaker reach.
- Cooperative Regenerative Specialists: ADVICS Co. Ltd. and Hitachi Astemo Ltd. support regenerative braking control for Japanese and Asian vehicle programs.
- Software-Defined Braking Firms: Brembo S.p.A. and Hyundai Mobis Co. Ltd. focus on advanced chassis control and by-wire program readiness.
Competitive Benchmarking: Blended Hydraulic-Regenerative Brake Systems Market
| Company | Hydraulic Actuator Depth | Regenerative Blend Software | Safety Validation Support | Geographic Footprint |
|---|---|---|---|---|
| Robert Bosch GmbH | High | Strong | Strong | Europe and global |
| ZF Friedrichshafen AG | High | Strong | Strong | Europe and global |
| Continental AG | Medium | Strong | Strong | Europe and global |
| ADVICS Co. Ltd. | High | Strong | Medium | Japan and Asia |
| Brembo S.p.A. | Medium | Strong | Strong | Europe and North America |
| Hyundai Mobis Co. Ltd. | Medium | Medium | Strong | South Korea and global |
| Hitachi Astemo Ltd. | Medium | Medium | Medium | Japan and global |
Source: Future Market Insights competitive analysis 2026. Ratings reflect relative positioning based on hydraulic control depth and regenerative braking integration.
Key Developments in Blended Hydraulic-Regenerative Brake Systems Market
- In January 2025, ZF secured a global OEM award for brake-by-wire technology covering nearly 5 million light vehicles over the contract period.
- In February 2025, Bosch completed a 3,300 km public-road test for its hydraulic brake-by-wire system before planned market launch from fall 2025.
- In April 2025, ADVICS said its cooperative regenerative braking system was adopted for Suzuki’s first battery EV e VITARA.
Key Players in the Blended Hydraulic-Regenerative Brake Systems Market
Major Global Players:
- Robert Bosch GmbH
- ZF Friedrichshafen AG
- Continental AG
- Brembo S.p.A.
- Hyundai Mobis Co. Ltd.
Specialist and Regional Players:
- ADVICS Co. Ltd.
- Hitachi Astemo Ltd.
Market Report Scope
| Parameter | Details |
|---|---|
| Quantitative units | USD 2.6 billion to USD 5.6 billion, at 8.0% CAGR |
| Market definition | Hydraulic pressure control paired with regenerative torque control in electric and hybrid vehicles |
| System architecture | Electro-hydraulic brake systems, electro-mechanical brake systems, vacuum eBooster systems, other systems |
| Vehicle type | Passenger electric vehicles, light commercial vehicles, electric buses, hybrid passenger cars |
| Integration level | Brake-by-wire integrated, stability control integrated, powertrain domain integrated, pedal simulator integrated |
| Sales channel | OEM line-fit, service replacement, calibration software, aftermarket support |
| Regions covered | North America, Europe, East Asia, South Asia and Pacific, Rest of World |
| Countries covered | China, India, South Korea, Germany, United States, United Kingdom, Japan |
| Key companies profiled | Bosch, ZF Friedrichshafen, Continental, ADVICS, Brembo, Hyundai Mobis, Hitachi Astemo |
| Forecast period | 2026 to 2036 |
| Approach | Hybrid top-down and bottom-up sizing with EV platform and brake-control cross-checks |
Source: Future Market Insights, 2026.
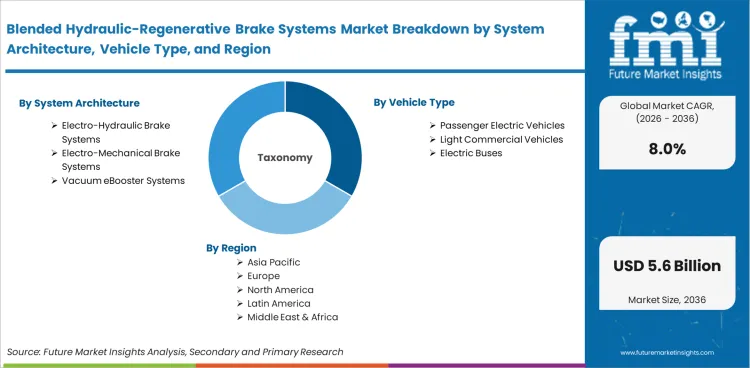
Blended Hydraulic-Regenerative Brake Systems Market Breakdown by System Architecture, Vehicle Type, Integration Level, Sales Channel and Region
By System Architecture:
- Electro-Hydraulic Brake Systems
- Electro-Mechanical Brake Systems
- Vacuum eBooster Systems
- Other Systems
By Vehicle Type:
- Passenger Electric Vehicles
- Light Commercial Vehicles
- Electric Buses
- Hybrid Passenger Cars
By Integration Level:
- Brake-by-Wire Integrated
- Stability Control Integrated
- Powertrain Domain Integrated
- Pedal Simulator Integrated
By Sales Channel:
- OEM Line-Fit
- Service Replacement
- Calibration Software
- Aftermarket Support
By Region:
- North America
- United States
- Europe
- Germany
- United Kingdom
- East Asia
- China
- Japan
- South Asia and Pacific
- India
- South Korea
- Rest of World
Research Sources and Bibliography
- European Automobile Manufacturers’ Association. (2026, January 27). New car registrations: +1.8% in 2025; battery-electric 17.4% market share.
- International Energy Agency. (2026, May 20). Global EV Outlook 2026.
- National Highway Traffic Safety Administration. (2024, April 29). NHTSA finalizes key safety rule to reduce crashes and save lives.
- European Union. (2024, May 8). Regulation (EU) 2024/1257 of the European Parliament and of the Council of 24 April 2024 on type-approval of motor vehicles and engines and of systems, components and separate technical units intended for such vehicles, with respect to their emissions and battery durability (Euro 7). EUR-Lex.
- ZF Friedrichshafen AG. (2025, January 6). ZF secures substantial brake-by-wire technology business for light vehicles.
- Robert Bosch GmbH. (2025, February 20). With brake-by-wire from Bosch to the Arctic Circle. Bosch Media Service.
- Toyota Motor Europe. (2026, March 19). The all-new Toyota C-HR+: Stand-out design and superior BEV credentials.
- ADVICS Co., Ltd. (2025, April 22). ADVICS brake products adopted for Suzuki’s first battery EV “e VITARA”.
- Nexteer Automotive. (2025, April 15). Nexteer launches brake-by-wire system.
- Euro NCAP. (2025, November 26). Euro NCAP announces 2026 protocol changes to tackle modern driving risks.
- German Association of the Automotive Industry. (2025, October 20). VDA President Hildegard Müller regarding Nexperia.
- Hyundai Motor Group. (2026, March 3). Hyundai Mobis invites 10 global customers to Swedish winter testing ground to showcase core technologies in extreme cold conditions.
- Brembo. (2026, May 4). The new standard begins: SENSIFY™ by Brembo enters production.
Bibliography uses government sources, official company evidence and non-commercial trade data relevant to market demand signals.
This Report Answers
- What is the expected value of blended hydraulic-regenerative brake systems market by 2036?
- What CAGR is forecast for blended hydraulic-regenerative brake systems market from 2026 to 2036?
- Which system architecture is projected to account for a leading share in 2026?
- Which vehicle type is expected to hold a strong share of blended brake system demand?
- How do automatic emergency braking rules affect blended brake control supplier selection?
- Which countries are forecast to record stronger growth by 2036?
- Which companies compete in blended hydraulic-regenerative brake systems market?
- How do electric vehicle platforms and brake particle rules affect market value?
- What methodology supports the blended hydraulic-regenerative brake systems market forecast?
Frequently Asked Questions
What is the blended hydraulic-regenerative brake systems market value in 2026?
The blended hydraulic-regenerative brake systems market size is expected to cross USD 2.6 billion in 2026.
What is the expected value of blended hydraulic-regenerative brake systems market by 2036?
The blended hydraulic-regenerative brake systems industry revenue is forecast to reach USD 5.6 billion by 2036 as electrified platforms need smoother brake blending.
What CAGR is expected for blended hydraulic-regenerative brake systems market?
The blended hydraulic-regenerative brake systems sector is projected to expand at 8.0% CAGR from 2026 to 2036 with factory-fit EV adoption.
Which system architecture holds a strong share in blended hydraulic-regenerative brake systems market?
Electro-hydraulic brake systems are forecast to account for 57.1% share in 2026 due to trusted hydraulic fallback performance.
Which vehicle type is prominent in blended hydraulic-regenerative brake systems market?
Passenger electric vehicles are projected to account for 68.4% share in 2026 as EV platforms adopt factory brake blending.
Which country grows faster in blended hydraulic-regenerative brake systems market?
China is projected to record 9.4% CAGR by 2036 as high electric car penetration supports integrated brake blending.
What are blended hydraulic-regenerative brake systems?
Blended hydraulic-regenerative brake systems combine hydraulic braking with motor energy recovery so electric vehicles slow smoothly and recover usable energy.
How is blended hydraulic-regenerative brake systems market forecast prepared?
Forecasting uses market values and segment shares. Country rates and EV platform checks refine brake architecture and factory-fit exposure.
Why do blended brake systems need validation?
Blended brake systems need validation since motor braking and hydraulic pressure must work together during normal stops and emergency braking.
Do blended hydraulic-regenerative brake systems reduce brake wear?
Blended systems can reduce friction-brake work by using motor braking during many stops. Actual savings depend on vehicle calibration and use cycle.
Who uses blended hydraulic-regenerative brake systems?
Automakers use blended systems in electric and hybrid vehicles. Brake module suppliers provide actuators and software for vehicle programs.
How long do blended hydraulic-regenerative brake systems last?
System life depends on vehicle design and certified service parts. Factory systems usually follow the vehicle safety service plan.
Are blended hydraulic-regenerative brake systems better than conventional brakes?
Blended systems are useful for electric vehicles as they recover energy and keep hydraulic fallback. Conventional brakes remain simpler for non-electrified cars.
Preview the report firsthand - request a free sample
Get SampleGet the brochure for pricing and purchase details.
Get PDFTable of Content
- Executive Summary
- Global Market Outlook
- Demand-side Trends
- Supply-side Trends
- Technology Roadmap Analysis
- Analysis and Recommendations
- Market Overview
- Market Coverage / Taxonomy
- Market Definition / Scope / Limitations
- Research Methodology
- Chapter Orientation
- Analytical Lens and Working Hypotheses
- Market Structure, Signals, and Trend Drivers
- Benchmarking and Cross-market Comparability
- Market Sizing, Forecasting, and Opportunity Mapping
- Research Design and Evidence Framework
- Desk Research Programme (Secondary Evidence)
- Company Annual and Sustainability Reports
- Peer-reviewed Journals and Academic Literature
- Corporate Websites, Product Literature, and Technical Notes
- Earnings Decks and Investor Briefings
- Statutory Filings and Regulatory Disclosures
- Technical White Papers and Standards Notes
- Trade Journals, Industry Magazines, and Analyst Briefs
- Conference Proceedings, Webinars, and Seminar Materials
- Government Statistics Portals and Public Data Releases
- Press Releases and Reputable Media Coverage
- Specialist Newsletters and Curated Briefings
- Sector Databases and Reference Repositories
- FMI Internal Proprietary Databases and Historical Market Datasets
- Subscription Datasets and Paid Sources
- Social Channels, Communities, and Digital Listening Inputs
- Additional Desk Sources
- Expert Input and Fieldwork (Primary Evidence)
- Primary Modes
- Qualitative Interviews and Expert Elicitation
- Quantitative Surveys and Structured Data Capture
- Blended Approach
- Why Primary Evidence is Used
- Observational and In-context Research
- Social and Community Interactions
- Primary Modes
- Stakeholder Universe Engaged
- C-suite Leaders
- Board Members
- Presidents and Vice Presidents
- R&D and Innovation Heads
- Technical Specialists
- Domain Subject-matter Experts
- Scientists
- Physicians and Other Healthcare Professionals
- Governance, Ethics, and Data Stewardship
- Research Ethics
- Data Integrity and Handling
- Desk Research Programme (Secondary Evidence)
- Tooling, Models, and Reference Databases
- Data Engineering and Model Build
- Data Acquisition and Ingestion
- Cleaning, Normalisation, and Verification
- Synthesis, Triangulation, and Analysis
- Quality Assurance and Audit Trail
- Market Background
- Market Dynamics
- Drivers
- Restraints
- Opportunity
- Trends
- Scenario Forecast
- Demand in Optimistic Scenario
- Demand in Likely Scenario
- Demand in Conservative Scenario
- Opportunity Map Analysis
- Product Life Cycle Analysis
- Supply Chain Analysis
- Investment Feasibility Matrix
- Value Chain Analysis
- PESTLE and Porter’s Analysis
- Regulatory Landscape
- Regional Parent Market Outlook
- Production and Consumption Statistics
- Import and Export Statistics
- Market Dynamics
- Global Market Analysis 2021 to 2025 and Forecast, 2026 to 2036
- Historical Market Size Value (USD Million) Analysis, 2021 to 2025
- Current and Future Market Size Value (USD Million) Projections, 2026 to 2036
- Y-o-Y Growth Trend Analysis
- Absolute $ Opportunity Analysis
- Global Market Pricing Analysis 2021 to 2025 and Forecast 2026 to 2036
- Global Market Analysis 2021 to 2025 and Forecast 2026 to 2036, By System Architecture
- Introduction / Key Findings
- Historical Market Size Value (USD Million) Analysis By System Architecture , 2021 to 2025
- Current and Future Market Size Value (USD Million) Analysis and Forecast By System Architecture , 2026 to 2036
- Electro-Hydraulic Brake Systems
- Electro-Mechanical Brake Systems
- Vacuum eBooster Systems
- Electro-Hydraulic Brake Systems
- Y-o-Y Growth Trend Analysis By System Architecture , 2021 to 2025
- Absolute $ Opportunity Analysis By System Architecture , 2026 to 2036
- Global Market Analysis 2021 to 2025 and Forecast 2026 to 2036, By Vehicle Type
- Introduction / Key Findings
- Historical Market Size Value (USD Million) Analysis By Vehicle Type, 2021 to 2025
- Current and Future Market Size Value (USD Million) Analysis and Forecast By Vehicle Type, 2026 to 2036
- Passenger Electric Vehicles
- Light Commercial Vehicles
- Electric Buses
- Passenger Electric Vehicles
- Y-o-Y Growth Trend Analysis By Vehicle Type, 2021 to 2025
- Absolute $ Opportunity Analysis By Vehicle Type, 2026 to 2036
- Global Market Analysis 2021 to 2025 and Forecast 2026 to 2036, By Integration Level
- Introduction / Key Findings
- Historical Market Size Value (USD Million) Analysis By Integration Level, 2021 to 2025
- Current and Future Market Size Value (USD Million) Analysis and Forecast By Integration Level, 2026 to 2036
- Brake-by-Wire Integrated
- Stability Control Integrated
- Powertrain Domain Integrated
- Brake-by-Wire Integrated
- Y-o-Y Growth Trend Analysis By Integration Level, 2021 to 2025
- Absolute $ Opportunity Analysis By Integration Level, 2026 to 2036
- Global Market Analysis 2021 to 2025 and Forecast 2026 to 2036, By Sales Channel
- Introduction / Key Findings
- Historical Market Size Value (USD Million) Analysis By Sales Channel, 2021 to 2025
- Current and Future Market Size Value (USD Million) Analysis and Forecast By Sales Channel, 2026 to 2036
- OEM Line-Fit
- Service Replacement
- Calibration Software
- OEM Line-Fit
- Y-o-Y Growth Trend Analysis By Sales Channel, 2021 to 2025
- Absolute $ Opportunity Analysis By Sales Channel, 2026 to 2036
- Global Market Analysis 2021 to 2025 and Forecast 2026 to 2036, By Region
- Introduction
- Historical Market Size Value (USD Million) Analysis By Region, 2021 to 2025
- Current Market Size Value (USD Million) Analysis and Forecast By Region, 2026 to 2036
- North America
- Latin America
- Western Europe
- Eastern Europe
- East Asia
- South Asia and Pacific
- Middle East & Africa
- Market Attractiveness Analysis By Region
- North America Market Analysis 2021 to 2025 and Forecast 2026 to 2036, By Country
- Historical Market Size Value (USD Million) Trend Analysis By Market Taxonomy, 2021 to 2025
- Market Size Value (USD Million) Forecast By Market Taxonomy, 2026 to 2036
- By Country
- USA
- Canada
- Mexico
- By System Architecture
- By Vehicle Type
- By Integration Level
- By Sales Channel
- By Country
- Market Attractiveness Analysis
- By Country
- By System Architecture
- By Vehicle Type
- By Integration Level
- By Sales Channel
- Key Takeaways
- Latin America Market Analysis 2021 to 2025 and Forecast 2026 to 2036, By Country
- Historical Market Size Value (USD Million) Trend Analysis By Market Taxonomy, 2021 to 2025
- Market Size Value (USD Million) Forecast By Market Taxonomy, 2026 to 2036
- By Country
- Brazil
- Chile
- Rest of Latin America
- By System Architecture
- By Vehicle Type
- By Integration Level
- By Sales Channel
- By Country
- Market Attractiveness Analysis
- By Country
- By System Architecture
- By Vehicle Type
- By Integration Level
- By Sales Channel
- Key Takeaways
- Western Europe Market Analysis 2021 to 2025 and Forecast 2026 to 2036, By Country
- Historical Market Size Value (USD Million) Trend Analysis By Market Taxonomy, 2021 to 2025
- Market Size Value (USD Million) Forecast By Market Taxonomy, 2026 to 2036
- By Country
- Germany
- UK
- Italy
- Spain
- France
- Nordic
- BENELUX
- Rest of Western Europe
- By System Architecture
- By Vehicle Type
- By Integration Level
- By Sales Channel
- By Country
- Market Attractiveness Analysis
- By Country
- By System Architecture
- By Vehicle Type
- By Integration Level
- By Sales Channel
- Key Takeaways
- Eastern Europe Market Analysis 2021 to 2025 and Forecast 2026 to 2036, By Country
- Historical Market Size Value (USD Million) Trend Analysis By Market Taxonomy, 2021 to 2025
- Market Size Value (USD Million) Forecast By Market Taxonomy, 2026 to 2036
- By Country
- Russia
- Poland
- Hungary
- Balkan & Baltic
- Rest of Eastern Europe
- By System Architecture
- By Vehicle Type
- By Integration Level
- By Sales Channel
- By Country
- Market Attractiveness Analysis
- By Country
- By System Architecture
- By Vehicle Type
- By Integration Level
- By Sales Channel
- Key Takeaways
- East Asia Market Analysis 2021 to 2025 and Forecast 2026 to 2036, By Country
- Historical Market Size Value (USD Million) Trend Analysis By Market Taxonomy, 2021 to 2025
- Market Size Value (USD Million) Forecast By Market Taxonomy, 2026 to 2036
- By Country
- China
- Japan
- South Korea
- By System Architecture
- By Vehicle Type
- By Integration Level
- By Sales Channel
- By Country
- Market Attractiveness Analysis
- By Country
- By System Architecture
- By Vehicle Type
- By Integration Level
- By Sales Channel
- Key Takeaways
- South Asia and Pacific Market Analysis 2021 to 2025 and Forecast 2026 to 2036, By Country
- Historical Market Size Value (USD Million) Trend Analysis By Market Taxonomy, 2021 to 2025
- Market Size Value (USD Million) Forecast By Market Taxonomy, 2026 to 2036
- By Country
- India
- ASEAN
- Australia & New Zealand
- Rest of South Asia and Pacific
- By System Architecture
- By Vehicle Type
- By Integration Level
- By Sales Channel
- By Country
- Market Attractiveness Analysis
- By Country
- By System Architecture
- By Vehicle Type
- By Integration Level
- By Sales Channel
- Key Takeaways
- Middle East & Africa Market Analysis 2021 to 2025 and Forecast 2026 to 2036, By Country
- Historical Market Size Value (USD Million) Trend Analysis By Market Taxonomy, 2021 to 2025
- Market Size Value (USD Million) Forecast By Market Taxonomy, 2026 to 2036
- By Country
- Kingdom of Saudi Arabia
- Other GCC Countries
- Turkiye
- South Africa
- Other African Union
- Rest of Middle East & Africa
- By System Architecture
- By Vehicle Type
- By Integration Level
- By Sales Channel
- By Country
- Market Attractiveness Analysis
- By Country
- By System Architecture
- By Vehicle Type
- By Integration Level
- By Sales Channel
- Key Takeaways
- Key Countries Market Analysis
- USA
- Pricing Analysis
- Market Share Analysis, 2025
- By System Architecture
- By Vehicle Type
- By Integration Level
- By Sales Channel
- Canada
- Pricing Analysis
- Market Share Analysis, 2025
- By System Architecture
- By Vehicle Type
- By Integration Level
- By Sales Channel
- Mexico
- Pricing Analysis
- Market Share Analysis, 2025
- By System Architecture
- By Vehicle Type
- By Integration Level
- By Sales Channel
- Brazil
- Pricing Analysis
- Market Share Analysis, 2025
- By System Architecture
- By Vehicle Type
- By Integration Level
- By Sales Channel
- Chile
- Pricing Analysis
- Market Share Analysis, 2025
- By System Architecture
- By Vehicle Type
- By Integration Level
- By Sales Channel
- Germany
- Pricing Analysis
- Market Share Analysis, 2025
- By System Architecture
- By Vehicle Type
- By Integration Level
- By Sales Channel
- UK
- Pricing Analysis
- Market Share Analysis, 2025
- By System Architecture
- By Vehicle Type
- By Integration Level
- By Sales Channel
- Italy
- Pricing Analysis
- Market Share Analysis, 2025
- By System Architecture
- By Vehicle Type
- By Integration Level
- By Sales Channel
- Spain
- Pricing Analysis
- Market Share Analysis, 2025
- By System Architecture
- By Vehicle Type
- By Integration Level
- By Sales Channel
- France
- Pricing Analysis
- Market Share Analysis, 2025
- By System Architecture
- By Vehicle Type
- By Integration Level
- By Sales Channel
- India
- Pricing Analysis
- Market Share Analysis, 2025
- By System Architecture
- By Vehicle Type
- By Integration Level
- By Sales Channel
- ASEAN
- Pricing Analysis
- Market Share Analysis, 2025
- By System Architecture
- By Vehicle Type
- By Integration Level
- By Sales Channel
- Australia & New Zealand
- Pricing Analysis
- Market Share Analysis, 2025
- By System Architecture
- By Vehicle Type
- By Integration Level
- By Sales Channel
- China
- Pricing Analysis
- Market Share Analysis, 2025
- By System Architecture
- By Vehicle Type
- By Integration Level
- By Sales Channel
- Japan
- Pricing Analysis
- Market Share Analysis, 2025
- By System Architecture
- By Vehicle Type
- By Integration Level
- By Sales Channel
- South Korea
- Pricing Analysis
- Market Share Analysis, 2025
- By System Architecture
- By Vehicle Type
- By Integration Level
- By Sales Channel
- Russia
- Pricing Analysis
- Market Share Analysis, 2025
- By System Architecture
- By Vehicle Type
- By Integration Level
- By Sales Channel
- Poland
- Pricing Analysis
- Market Share Analysis, 2025
- By System Architecture
- By Vehicle Type
- By Integration Level
- By Sales Channel
- Hungary
- Pricing Analysis
- Market Share Analysis, 2025
- By System Architecture
- By Vehicle Type
- By Integration Level
- By Sales Channel
- Kingdom of Saudi Arabia
- Pricing Analysis
- Market Share Analysis, 2025
- By System Architecture
- By Vehicle Type
- By Integration Level
- By Sales Channel
- Turkiye
- Pricing Analysis
- Market Share Analysis, 2025
- By System Architecture
- By Vehicle Type
- By Integration Level
- By Sales Channel
- South Africa
- Pricing Analysis
- Market Share Analysis, 2025
- By System Architecture
- By Vehicle Type
- By Integration Level
- By Sales Channel
- USA
- Market Structure Analysis
- Competition Dashboard
- Competition Benchmarking
- Market Share Analysis of Top Players
- By Regional
- By System Architecture
- By Vehicle Type
- By Integration Level
- By Sales Channel
- Competition Analysis
- Competition Deep Dive
- Robert Bosch GmbH
- Overview
- Product Portfolio
- Profitability by Market Segments (Product/Age /Sales Channel/Region)
- Sales Footprint
- Strategy Overview
- Marketing Strategy
- Product Strategy
- Channel Strategy
- ZF Friedrichshafen AG
- Continental AG
- Brembo S.p.A.
- Hyundai Mobis Co. Ltd.
- Robert Bosch GmbH
- Competition Deep Dive
- Assumptions & Acronyms Used


