The bonding honeycomb vibration isolation platform market is valued at USD 468.7 million in 2025 and is anticipated to reach USD 714.1 million by 2035, with a CAGR of 4.3%. From 2021 to 2025, the market is expected to grow steadily from USD 379.8 million to USD 468.7 million, passing through intermediate values of USD 396.1 million, USD 413.1 million, USD 430.9 million, and USD 449.4 million. This early growth is driven by increasing demand for vibration isolation solutions in aerospace, automotive, and industrial applications, where minimizing vibrations is crucial for product performance and reliability. The market experiences moderate, but consistent growth as companies and industries increasingly adopt honeycomb-based platforms for enhanced vibration damping.
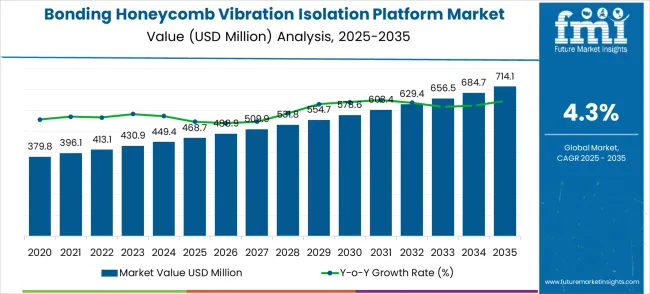
Between 2026 and 2030, the market is expected to continue its expansion, growing from USD 468.7 million to USD 578.6 million, with intermediate values of USD 488.9 million, USD 509.9 million, and USD 531.8 million. This growth is supported by rising applications in more advanced and precision-sensitive industries, such as defense and high-end electronics, where vibration isolation is critical for the durability and operation of sensitive components. By 2030, the market will reach USD 603.4 million, continuing its upward trend. From 2031 to 2035, the market is projected to reach USD 714.1 million, passing through USD 629.4 million, USD 656.5 million, and USD 684.7 million. The growth rate volatility index exhibits stability in the early stages, followed by steady increases, driven by technological advancements and broader adoption across various sectors that require high precision and vibration control.
| Metric | Value |
|---|---|
| Estimated Value in (2025E) | USD 468.7 million |
| Forecast Value in (2035F) | USD 714.1 million |
| Forecast CAGR (2025 to 2035) | 4.3% |
The vibration isolation market contributes about 30-35%, driven by the increasing need for effective vibration damping in sensitive environments such as laboratories, research facilities, and precision machinery. Bonding honeycomb vibration isolation platforms are valued for their ability to provide superior vibration damping and stability. The aerospace and defense market adds roughly 25-30%, as these platforms are critical for isolating vibrations in sensitive equipment used in aircraft, spacecraft, and military vehicles, where minimizing vibrations is essential for both safety and performance.
The electronics and semiconductor market contributes around 15-18%, driven by the growing use of vibration isolation platforms in manufacturing environments, especially for semiconductor fabrication and high-precision electronics testing, where vibration-free conditions are essential. The automotive market accounts for approximately 10-12%, as vibration isolation platforms are increasingly used in automotive testing, production, and assembly lines to ensure the quality and durability of vehicle components. The industrial equipment market contributes about 8-10%, as these platforms are used to isolate vibrations in heavy machinery and industrial equipment to improve performance and reduce wear and tear.
Market expansion is being supported by the increasing sophistication of precision measurement equipment and the corresponding need for ultra-stable platforms that can eliminate environmental vibrations and mechanical disturbances affecting measurement accuracy. Modern scientific instruments, manufacturing equipment, and testing systems require stable operating environments free from external vibrations that can compromise measurement precision and operational reliability. Bonding honeycomb vibration isolation platforms provide the necessary stability, damping characteristics, and environmental isolation to ensure optimal performance of sensitive equipment across diverse applications.
The growing complexity of research and development activities and increasing focus on measurement accuracy are driving demand for advanced vibration isolation solutions that can support next-generation instrumentation and emerging technologies. Advanced research facilities require comprehensive vibration control systems that can accommodate diverse equipment types while maintaining optimal environmental conditions for precision measurements. Industry standards and quality requirements are establishing stringent vibration control protocols that require specialized platform technologies with validated performance characteristics and comprehensive environmental stability.
The bonding honeycomb vibration isolation platform market is positioned for steady expansion — from USD 469 million in 2025 to USD 714 million by 2035 (CAGR 4.3%). Demand for ultra-stable work surfaces, tighter measurement tolerances, and lifecycle-cost optimization unlocks USD 230–260 million in incremental revenue opportunities by 2035.
Pathway A – Precision Instrumentation & Metrology. High-precision laboratories and metrology centers require ultra-low vibration platforms for interferometry, optical benches, and precision CNC calibration. The largest near-term pool worth USD 65–69 million.
Pathway B – Medical Research & Clinical Experiments. Clinical labs, medical-imaging research, and bioinstrumentation facilities need isolation for microscopy, MRI-adjacent instruments, and diagnostic testbeds. Pool: USD 48–51 million.
Pathway C – Aerospace & Defense Testbeds. Aerospace vibration testing, sensor qualification, and satellite/avionics component test stands demand high-performance honeycomb isolation. Incremental pool: USD 32–38 million.
Pathway D – Semiconductor / Cleanroom Instrument Platforms. Planar, contamination-controlled isolation platforms for wafer inspection, probe stations, and MEMS testing fit cleanroom constraints and tight throughput windows. Expected pool: USD 22–28 million.
Pathway E – Retrofit, Service & Lifecycle Programs. Field retrofits of existing optical benches, scheduled replacement programs, and long-term service contracts that extend useful life provide recurring revenue. Opportunity: USD 20–23 million.
Pathway F – Active / Smart Isolation Systems. Combining passive honeycomb plates with low-profile active damping, embedded sensors and feedback control (AI-tuned) opens premium system sales and software subscriptions. Pool: USD 13–16 million.
Pathway G – Emerging Market Adoption (China & India). Growing instrument manufacturing and testing capacity in China and India create demand for lower-cost certified isolation solutions and local assembly. Represents USD 18–20 million.
Pathway H – OEM Integration & Turnkey Test Stations. OEMs of microscopes, interferometers, and automated test systems can bundle bonded honeycomb platforms into turnkey stations (higher ASPs, faster adoption). Smaller but strategic pool: USD 12–15 million.
The market is segmented by isolation type, end-use industry, and region. By isolation type, the market is divided into air spring vibration isolation and vibration isolation rubber. Based on end-use industry, the market is categorized into precision instrument production and testing, medical experiments, biotechnology, and aerospace experiments. Regionally, the market is divided into North America, Europe, East Asia, South Asia & Pacific, Latin America, and Middle East & Africa.
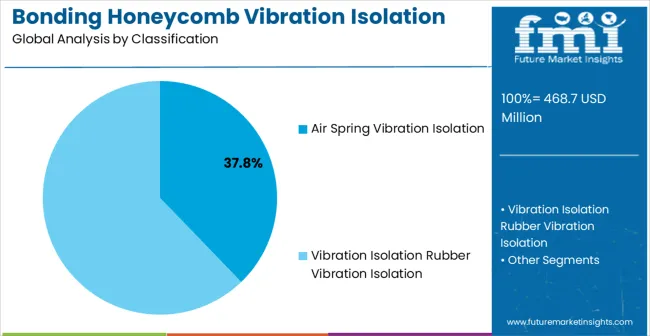
Air spring vibration isolation systems are projected to account for 37.8% of the bonding honeycomb vibration isolation platform market in 2025. This leading share is supported by the superior vibration damping characteristics and adjustable performance features of pneumatic isolation systems in demanding precision applications. Air spring systems provide excellent low-frequency vibration isolation, adjustable height control, and consistent performance characteristics that make them ideal for sensitive instrumentation and precision measurement applications. The segment benefits from established technology platforms, comprehensive performance validation, and extensive application databases that facilitate adoption across diverse technical applications requiring superior vibration control.
Air spring vibration isolation technology continues advancing through integration of sophisticated control systems, enhanced monitoring capabilities, and improved reliability features that support advanced laboratory and manufacturing environments. The segment growth reflects increasing demand for adjustable isolation solutions that can accommodate varying load conditions, environmental requirements, and performance specifications while maintaining optimal vibration control characteristics. Manufacturers are developing next-generation air spring systems with integrated sensors, automated leveling capabilities, and comprehensive diagnostic features that support predictive maintenance and operational optimization in critical applications.
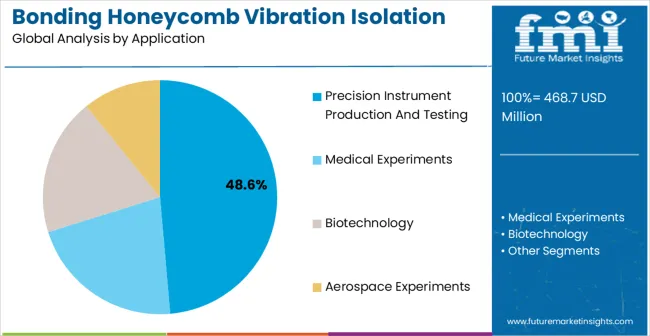
Precision instrument production and testing applications are expected to represent 48.6% of bonding honeycomb vibration isolation platform demand in 2025. This dominant share reflects the critical importance of vibration control in manufacturing and testing precision instruments, measurement equipment, and scientific apparatus that require ultra-stable operating environments. Modern precision instrument production involves sophisticated manufacturing processes, quality control procedures, and performance validation protocols that depend on vibration-free environments to achieve optimal accuracy and reliability. The segment benefits from ongoing technological advancement in precision manufacturing and increasing quality standards that require comprehensive vibration isolation solutions.
Precision instrument industry transformation toward higher accuracy requirements and advanced manufacturing technologies is driving significant vibration isolation platform demand as manufacturers implement more stringent environmental control requirements and sophisticated quality assurance protocols. The segment expansion reflects increasing focus on measurement traceability, operational reliability, and product quality that depend on superior vibration isolation performance and environmental stability. Advanced precision manufacturing applications are incorporating real-time monitoring systems, automated quality control, and comprehensive process validation that require sophisticated vibration isolation technologies with enhanced performance characteristics and diagnostic capabilities.
The bonding honeycomb vibration isolation platform market is advancing steadily due to increasing precision measurement requirements and growing focus on environmental control in sensitive applications. The market faces challenges including high system costs, complex installation requirements, and need for specialized maintenance expertise. Technological advancement efforts and application standardization programs continue to influence product development and market expansion patterns.
The growing implementation of intelligent monitoring systems and automated control capabilities in vibration isolation platforms is enabling real-time performance optimization, predictive maintenance scheduling, and comprehensive environmental monitoring that enhance overall system effectiveness. Smart platform technologies provide continuous vibration analysis, automated adjustment capabilities, and integrated connectivity that support advanced laboratory management and process control strategies. These technological advances enable users to achieve higher levels of measurement accuracy and operational reliability while reducing maintenance costs and minimizing system downtime.
Platform manufacturers are developing modular system designs and customizable configurations that enable flexible installation, easy expansion, and cost-effective implementation across diverse application requirements. Modular isolation platforms provide enhanced flexibility for research and manufacturing applications while supporting efficient scaling for changing operational needs. This trend supports broader market adoption by reducing initial investment requirements and providing upgrade pathways that accommodate evolving technical requirements and emerging application needs.
| Country | CAGR (2025-2035) |
|---|---|
| China | 5.8% |
| India | 5.4% |
| Germany | 4.9% |
| Brazil | 4.5% |
| United States | 4.1% |
| United Kingdom | 3.7% |
| Japan | 3.2% |
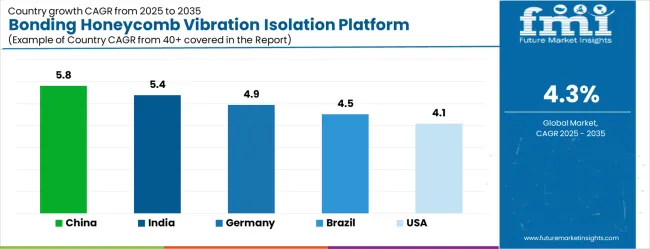
The bonding honeycomb vibration isolation platform market demonstrates varied growth patterns across key countries, with China leading at a 5.8% CAGR through 2035, driven by expanding research infrastructure, growing precision manufacturing capabilities, and increasing government investments in scientific research and development programs. India follows at 5.4%, supported by increasing research facility construction, expanding pharmaceutical sector, and growing foreign investment in high-technology research and manufacturing applications. Germany records 4.9% growth, emphasizing precision engineering excellence, advanced manufacturing technologies, and comprehensive research infrastructure development. Brazil shows steady growth at 4.5%, developing scientific research capabilities and expanding precision manufacturing infrastructure. The United States maintains 4.1% growth, focusing on advanced research programs and precision manufacturing technology leadership. The United Kingdom demonstrates 3.7% expansion, supported by research institution development and advanced manufacturing initiatives. Japan records 3.2% growth, leveraging technological leadership and precision manufacturing expertise.
The report covers an in-depth analysis of 40+ countries with top-performing countries highlighted below.
Revenue from bonding honeycomb vibration isolation platforms in China is projected to grow at the highest growth rate, with a CAGR of 5.8% through 2035, driven by massive research infrastructure development, government support for scientific research programs, and growing precision manufacturing capabilities across diverse industrial sectors. The country's comprehensive research and development strategy includes significant investments in advanced research facilities, precision instrument manufacturing, and supporting infrastructure that require sophisticated vibration isolation solutions for optimal performance. Major universities and research institutions are establishing state-of-the-art laboratories that require comprehensive vibration control systems for sensitive measurement and testing applications. Government initiatives promoting scientific research excellence are driving demand for advanced vibration isolation platforms across academic, industrial, and government research facilities.
The bonding honeycomb vibration isolation platform market in India is projected to expand at a CAGR of 5.4%, supported by increasing research facility development, expanding pharmaceutical sector capabilities, and growing foreign direct investment in high-technology research and manufacturing applications. The country's focus on scientific research advancement and precision manufacturing development is driving demand for vibration isolation solutions that support laboratory operations, manufacturing processes, and testing applications requiring environmental stability. Government programs promoting research infrastructure development are creating favorable conditions for vibration isolation platform adoption across academic and industrial research facilities. Major international companies are establishing research facilities that require comprehensive environmental control systems and technical support services.
Demand for bonding honeycomb vibration isolation platforms in Germany is projected to grow at a CAGR of 4.9%, supported by the country's leadership in precision engineering, advanced manufacturing technologies, and comprehensive research infrastructure development capabilities. German manufacturers and research institutions are implementing sophisticated vibration isolation solutions that meet stringent performance standards while supporting advanced research and manufacturing operations across diverse technical applications. The country's extensive automotive and aerospace industries are driving significant vibration isolation platform demand for precision manufacturing and testing applications. Advanced manufacturing partnerships are facilitating technology development and knowledge sharing across diverse industrial and research sectors.
Revenue from bonding honeycomb vibration isolation platforms in Brazil is projected to expand at a CAGR of 4.5%, driven by expanding scientific research capabilities, growing precision manufacturing sector development, and increasing focus on research infrastructure modernization initiatives. Brazilian research institutions and manufacturers are investing in vibration isolation solutions to enhance research capabilities and meet international quality standards while supporting domestic scientific advancement and industrial development. Government programs supporting research infrastructure development are facilitating access to advanced technologies and technical expertise. Regional research centers are developing specialized capabilities that support diverse vibration isolation applications across academic research, pharmaceutical development, and precision manufacturing industries.
Demand for bonding honeycomb vibration isolation platforms in the United States is projected to grow at a CAGR of 4.1%, driven by advanced research program development, precision manufacturing technology leadership, and ongoing innovation initiatives across diverse scientific and industrial sectors. American research institutions and manufacturers are implementing sophisticated vibration isolation solutions to maintain global competitiveness while supporting cutting-edge research and development programs. The biotechnology and pharmaceutical sectors are driving significant vibration isolation platform demand for specialized research applications including drug development, medical device testing, and advanced therapeutic research requiring ultra-stable environments. Government initiatives supporting domestic research infrastructure are creating substantial demand for comprehensive environmental control systems and technical support services.
The bonding honeycomb vibration isolation platform market in the United Kingdom is projected to expand at a CAGR of 3.7%, supported by research institution modernization, advanced manufacturing development, and increasing focus on scientific research infrastructure improvement initiatives. British research facilities and manufacturers are investing in vibration isolation solutions to support advanced research programs, precision manufacturing operations, and specialized testing applications. The country's strong academic research base is facilitating technology development and application innovation across diverse vibration isolation requirements. Government initiatives supporting research infrastructure development are creating favorable conditions for vibration isolation platform adoption and technology advancement.
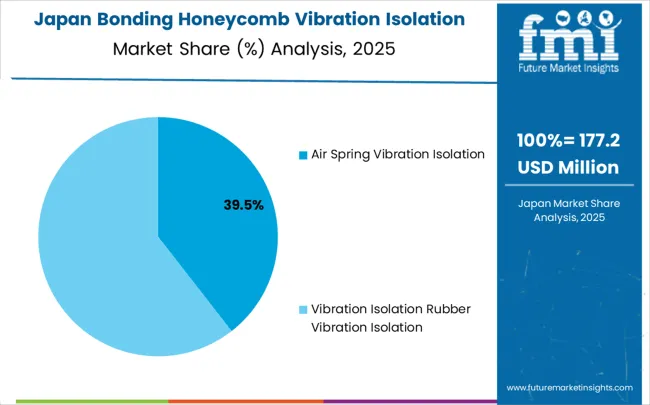
Revenue from bonding honeycomb vibration isolation platforms in Japan is projected to expand at a CAGR of 3.2%, supported by advanced precision manufacturing capabilities, comprehensive research infrastructure, and focus on technological innovation principles across diverse scientific and industrial applications. Japanese manufacturers and research institutions are implementing sophisticated vibration isolation solutions that demonstrate superior performance characteristics while supporting advanced research and precision manufacturing operations. The country's electronics and precision instrument industries are driving demand for advanced vibration isolation technologies that support precision manufacturing processes and stringent quality control requirements. Collaborative research programs between industry and academic institutions are developing innovative vibration isolation technologies that maintain Japan's competitive advantage in global precision manufacturing markets.
The bonding honeycomb vibration isolation platform market is characterized by competition among specialized vibration control manufacturers, precision equipment providers, and advanced engineering companies. Companies are investing in advanced damping technologies, modular platform designs, comprehensive testing capabilities, and technical support services to deliver stable, reliable, and high-performance vibration isolation solutions. Strategic partnerships, technological innovation, and application expertise development are central to strengthening product portfolios and market presence.
Thorlabs, USA-based, offers comprehensive vibration isolation platforms with focus on optical applications, modular designs, and precision engineering capabilities. Daeil System, South Korea, provides specialized vibration isolation solutions emphasizing research applications, customizable configurations, and comprehensive technical support. TMC (Technical Manufacturing Corporation), USA, delivers advanced vibration isolation technologies with focus on precision manufacturing, laboratory applications, and integrated monitoring systems.
OptoSigma, Japan, emphasizes optical and precision measurement applications with specialized platform offerings for research and manufacturing environments. Kinetic System, USA, focuses on high-performance isolation solutions with comprehensive damping technologies and modular architectures. Other key players including OptoSigma SEA, ZK Optics, Oeabt, Dimension Labs, Daheng Optics, Rympo, Feinixs, JC Zolix, and Ultrablue contribute specialized expertise and technical capabilities across global and regional markets, providing diverse solution portfolios for specific application requirements.
| Item | Value |
|---|---|
| Quantitative Units (2025) | USD 468.7 million |
| Isolation Type | Air Spring Vibration Isolation and Vibration Isolation Rubber |
| End-Use Industry | Precision Instrument Production And Testing, Medical Experiments, Biotechnology, and Aerospace Experiments |
| Regions Covered | North America, Europe, East Asia, South Asia & Pacific, Latin America, Middle East & Africa |
| Countries Covered | United States, Canada, United Kingdom, Germany, France, China, Japan, South Korea, India, Brazil, Australia and 40+ countries |
| Key Companies Profiled | Thorlabs, Daeil System, TMC, OptoSigma, Kinetic System, OptoSigma SEA, Zolix (Zolix Instruments) |
| Additional Attributes | Dollar sales by isolation type and end-use industry segments, regional demand trends across North America, Europe, and Asia-Pacific, competitive landscape with established vibration control manufacturers and specialized precision equipment providers, buyer preferences for air spring versus rubber isolation solutions, integration with precision manufacturing processes and research facility operations |
The global heavy-duty truck AMT transmission market is estimated to be valued at USD 2,694.5 million in 2025.
The market size for the heavy-duty truck AMT transmission market is projected to reach USD 6,148.7 million by 2035.
The heavy-duty truck AMT transmission market is expected to grow at a 8.6% CAGR between 2025 and 2035.
The key product types in heavy-duty truck AMT transmission market are 6-8 gears, 10-12 gears and 16 gears and above.
In terms of application, logistics heavy trucks segment to command 58.7% share in the heavy-duty truck AMT transmission market in 2025.


Our Research Products

The "Full Research Suite" delivers actionable market intel, deep dives on markets or technologies, so clients act faster, cut risk, and unlock growth.

The Leaderboard benchmarks and ranks top vendors, classifying them as Established Leaders, Leading Challengers, or Disruptors & Challengers.

Locates where complements amplify value and substitutes erode it, forecasting net impact by horizon

We deliver granular, decision-grade intel: market sizing, 5-year forecasts, pricing, adoption, usage, revenue, and operational KPIs—plus competitor tracking, regulation, and value chains—across 60 countries broadly.

Spot the shifts before they hit your P&L. We track inflection points, adoption curves, pricing moves, and ecosystem plays to show where demand is heading, why it is changing, and what to do next across high-growth markets and disruptive tech

Real-time reads of user behavior. We track shifting priorities, perceptions of today’s and next-gen services, and provider experience, then pace how fast tech moves from trial to adoption, blending buyer, consumer, and channel inputs with social signals (#WhySwitch, #UX).

Partner with our analyst team to build a custom report designed around your business priorities. From analysing market trends to assessing competitors or crafting bespoke datasets, we tailor insights to your needs.
Supplier Intelligence
Discovery & Profiling
Capacity & Footprint
Performance & Risk
Compliance & Governance
Commercial Readiness
Who Supplies Whom
Scorecards & Shortlists
Playbooks & Docs
Category Intelligence
Definition & Scope
Demand & Use Cases
Cost Drivers
Market Structure
Supply Chain Map
Trade & Policy
Operating Norms
Deliverables
Buyer Intelligence
Account Basics
Spend & Scope
Procurement Model
Vendor Requirements
Terms & Policies
Entry Strategy
Pain Points & Triggers
Outputs
Pricing Analysis
Benchmarks
Trends
Should-Cost
Indexation
Landed Cost
Commercial Terms
Deliverables
Brand Analysis
Positioning & Value Prop
Share & Presence
Customer Evidence
Go-to-Market
Digital & Reputation
Compliance & Trust
KPIs & Gaps
Outputs
Full Research Suite comprises of:
Market outlook & trends analysis
Interviews & case studies
Strategic recommendations
Vendor profiles & capabilities analysis
5-year forecasts
8 regions and 60+ country-level data splits
Market segment data splits
12 months of continuous data updates
DELIVERED AS:
PDF EXCEL ONLINE
Bonding Sheet Market Forecast and Outlook 2025 to 2035
Glass Bonding Adhesive Market Size and Share Forecast Outlook 2025 to 2035
Metal Bonding Adhesives Market
Concrete Bonding Agents Market Size and Share Forecast Outlook 2025 to 2035
Temporary Bonding Adhesives Market Size and Share Forecast Outlook 2025 to 2035
Semiconductor Bonding Equipment Market Size and Share Forecast Outlook 2025 to 2035
Semiconductor Bonding Market Size and Share Forecast Outlook 2025 to 2035
Gold-plated Palladium Bonding Wire Market Size and Share Forecast Outlook 2025 to 2035
Agricultural Films And Bonding Market
Chopped Strand Mat Stitch Bonding Machine Market Size and Share Forecast Outlook 2025 to 2035
Honeycomb Aluminum Foil Market Size and Share Forecast Outlook 2025 to 2035
Honeycomb Core Materials Market Size and Share Forecast Outlook 2025 to 2035
Competitive Overview of Honeycomb Packaging Market Share
Honeycomb Packing Paper Market Analysis – Growth & Trends 2024-2034
Paper Honeycomb Market Size and Share Forecast Outlook 2025 to 2035
Aramid Honeycomb Core Material Market Size and Share Forecast Outlook 2025 to 2035
Aluminum Honeycomb Panels Market Size and Share Forecast Outlook 2025 to 2035
Platform Lifts Market Size and Share Forecast Outlook 2025 to 2035
Platform Architecture Market Size and Share Forecast Outlook 2025 to 2035
Platform Boots Market Trends - Growth & Industry Outlook to 2025 to 2035

Thank you!
You will receive an email from our Business Development Manager. Please be sure to check your SPAM/JUNK folder too.
Chat With
MaRIA