

- Market Size (2026)
- USD 416.9 Mn
- Forecast (2036)
- USD 1042.7 Mn
- CAGR (2026 to 2036)
- 9.6%
How big is Breast Cancer Nutrition Product Market in 2026?
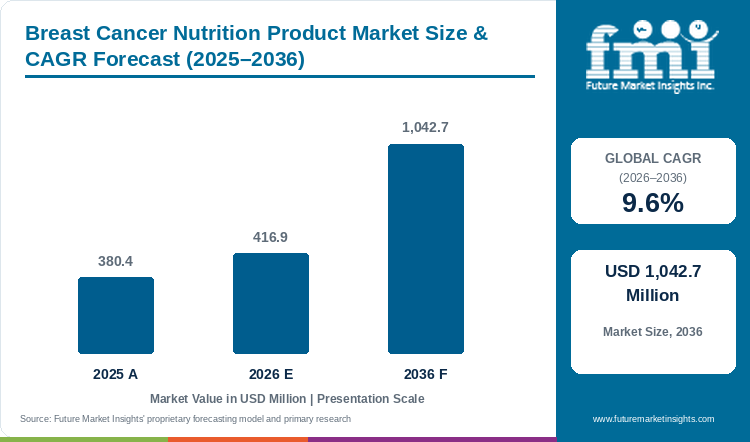
The breast cancer nutrition product market is estimated at USD 380.4 million in 2025 and is likely to reach USD 416.9 million in 2026. Sales of breast cancer nutrition products are expected to grow at a 9.6% CAGR and reach USD 1,042.7 million by 2036.
Key trends in the breast cancer nutrition product market point to oncology teams writing nutrition into treatment plans and patients refilling products at home. For 2025, sales of breast cancer nutrition products are estimated at USD 380.4 million. From that base, the breast cancer nutrition product market is forecast at USD 416.9 million in 2026 and USD 1,042.7 million by 2036, on a 9.6% CAGR. Within that, FMI analysis shows the steepest gains in protein drinks taken during chemotherapy, when appetite and taste change most. Treatment cycles repeat every few weeks, so a tolerated product becomes a standing order for months.
Recent shelf moves change the buying choice for patients. For example, Kate Farms said retail distribution of the High Protein Nutrition Shake grew over sevenfold after the Walmart launch in Q4 2025, and expected availability in over 6,800 Walmart and CVS stores by August 2026.[1] Shelf presence on that scale puts a medical shake in front of patients who never see a dietitian. The company also said products are eligible for coverage through Medicare, Medicaid and private insurance.[1] As a result, patients now weigh a self-pay shelf purchase against a covered prescription, and oncology dietitians will need to name the product and the route at each visit.
Key Market Trends & Insights
- High-protein ONS is forecast to remain the largest product type in 2026, with 48.1% of sales, against about 19.6% for symptom-adapted supplements, as oncology dietitians usually start with complete protein drinks.
- Sales during chemotherapy and targeted therapy are likely to reach 47.4% of treatment phase demand in 2026. Appetite loss is most severe during systemic treatment, and the patient pool is large. To gauge the pool, CDC counted 279,731 new breast cancer cases among US women in 2022.[2] Each new case starting chemotherapy adds weeks of daily supplement use.
- Ready-to-drink packs suit patients too tired to mix powder, and are projected to make up 44.3% of form sales in 2026.
- Within care settings, home care will hold 51% in 2026, with cancer centers near 32.6%.
- Self-pay online buying is forecast at 38.4% of access route sales in 2026. Physical retail is opening up as well. On the retail side, Kate Farms added a CVS launch to Walmart shelves for the High Protein Nutrition Shake in July 2026.[1] Drugstore listings give patients a same-day refill option beside online subscriptions.
Regional Highlights
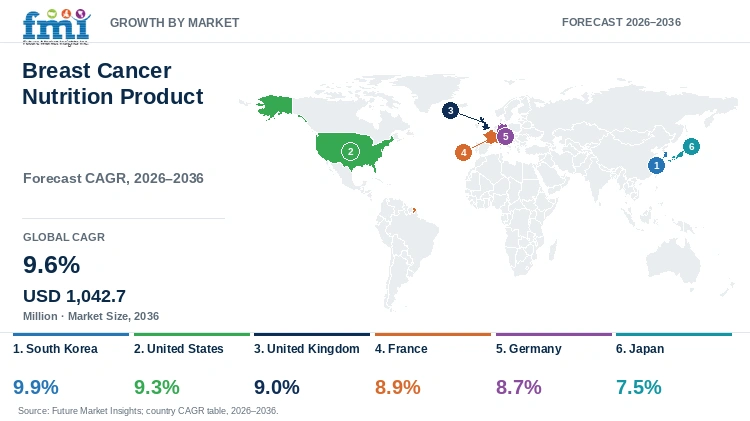
- South Korea is projected to lead country growth at 9.9%, 0.3 points above the global CAGR, with survivorship care keeping patients buying for years.
- Demand in the United States is forecast at 9.3% on wide shelf access, and in the United Kingdom at 9% under national survival targets. France and Germany grow within 0.2 points of each other, and Japan is slowest at 7.5%.
- The Korean survivor population is large and still growing. South Korea counted 2,732,906 cancer survivors in 2023, with breast cancer the fourth most common new cancer, Dailypharm reported on 20 January 2026.[3] Survivors buying protein for weight and muscle extend demand well past the end of treatment.
Market Size & Forecast
Table 1: Market Size and Forecast for the Breast Cancer Nutrition Product Market (USD million and percentage), 2025 to 2036
| Metric | Value |
|---|---|
| 2025 Market Size | USD 380.4 million |
| Estimated Market Size in 2026 | USD 416.9 million |
| Projected Market Size by 2036 | USD 1,042.7 million |
| CAGR, 2026 to 2036 | 9.6% |
| Added Revenue, 2026 to 2036 | USD 625.8 million |
| Market Expansion Multiple | 2.5x |
More breast cancer treatment now happens in outpatient clinics, which moves purchases of breast cancer nutrition products from the ward to the home. For instance, in the United States, CDC reported 279,731 new breast cancer cases among women in 2022 and put annual medical costs for breast cancer at USD 29.8 billion in 2020, the highest treatment cost of any cancer.[2] Each new patient adds months of possible supplement use. By comparison, oral supplements as a whole grow more slowly, and the oral clinical nutrition supplements market is projected at a 6.1% CAGR. By FMI estimates, longer treatment and survivorship periods add USD 625.8 million to the breast cancer nutrition product market over 2026 to 2036, bringing the 2036 figure to roughly two and a half times the 2026 base. Even so, products sold with loose cancer claims are the main risk, as care teams steer patients away from them.
Guidelines, Survival Targets and Shelf Access
Clinical bodies are bringing nutrition into cancer pathways. For example, the AWMF published a new German guideline on clinical nutrition in oncology, register number 073-006OL, on 19 February 2026, aiming to counter undernutrition across the whole course of disease and to develop quality indicators for certification.[4] Quality indicators tied to certification will push German cancer centres to screen and supply nutrition routinely. In England, the National Cancer Plan set an ambition for 75% of people diagnosed with cancer to survive five years or more by 2035, Cancer Research UK reported on 4 February 2026.[5] In turn, longer survival extends the period in which patients buy nutrition products.
Shelf and coverage access is widening at the same time. To illustrate, Kate Farms is in over 1,500 hospitals and medical settings, and the High Protein Nutrition Shake was due in over 6,800 Walmart and CVS stores by August 2026.[1] A brand present in both hospitals and mass retail keeps patients on the same shake after discharge. Behind that brand, Danone combined Kate Farms with Nutricia, Real Food Blends and Functional Formularies in July 2025 to serve hospitals, home, online and retail.[6] As a result, patients leaving a cancer center can now find the same brand at a pharmacy or online.
Table 2: Guideline, Survival and Access Indicators for the Breast Cancer Nutrition Product Market (cases, targets and stores), 2022 to 2026
| Indicator | Data Point | Relevance | Source |
|---|---|---|---|
| CDC breast cancer data, May 2026 | 279,731 new female cases in 2022 | Size of the treated patient pool in the United States | [2] |
| AWMF oncology nutrition guideline, February 2026 | Register 073-006OL; valid to January 2031 | Structured nutrition care in Germany | [4] |
| National Cancer Plan for England, February 2026 | 75% five-year survival ambition by 2035 | Longer survivorship nutrition use | [5] |
| Korean cancer registry, January 2026 | 2,732,906 survivors; breast cancer 94.7% five-year survival | Survivor base in South Korea | [3] |
| Kate Farms retail expansion, July 2026 | Over 6,800 Walmart and CVS stores by August 2026 | Self-pay shelf access | [1] |
| Nestlé Health Science, 2025 | 3.2% organic growth | Supplier momentum in medical nutrition | [7] |
Analyst Perspective
“Breast cancer nutrition is bought one treatment cycle at a time, and the product a patient tolerates in the first cycle usually stays for the remaining cycles. I see taste change as the main reason patients switch, so flavour range and clear shelf access matter as much as protein content. I expect home refills of tolerated drinks to keep growing, opening a quieter reorder channel outside the clinic.”
- Anurag Sharma, Principal Consultant, Future Market Insights.
How is the breast cancer nutrition product market segmented?
The market is segmented into product type, treatment phase, product form, care setting, access route, and region. High-protein ONS is expected to lead product type with 48.1% share in 2026, and chemotherapy and targeted therapy lead treatment phase with 47.4%.
By product type: high-protein ONS, symptom-adapted supplements, fortified meals and snacks, protein modules, and others.
By treatment phase: chemotherapy and targeted therapy, surgery and radiotherapy recovery, endocrine therapy, and survivorship.
By product form: ready-to-drink, powder, puddings and semi-solids, and others.
By care setting: home care, cancer centers, and hospital oncology wards.
By access route: self-pay online, self-pay pharmacy and retail, prescribed and reimbursed, and cancer center supply.
By region: patients in treatment and survivorship in North America, Latin America, Western Europe, Eastern Europe, East Asia, South Asia and Pacific, and Middle East and Africa.
Why does high-protein ONS lead breast cancer nutrition product sales by product type?
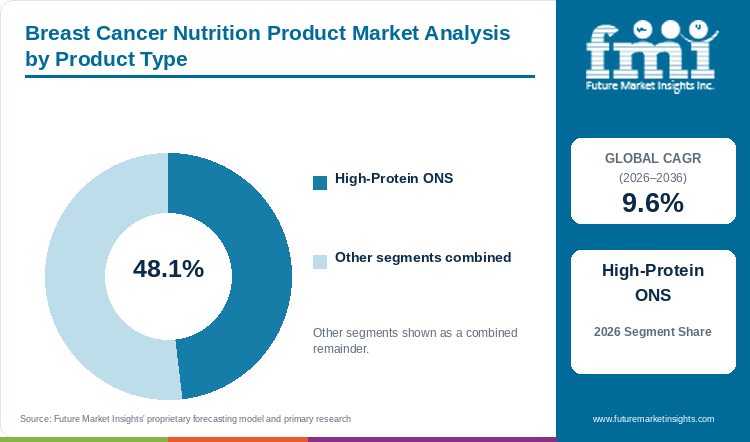
High-protein ONS is expected to lead product type sales with 48.1% share in 2026, ahead of symptom-adapted supplements at about 19.6% and fortified meals and snacks at an estimated 12.4%.
Table 3: Product Type Share for the Breast Cancer Nutrition Product Market (percentage share), 2026
| Product Type | Estimated Share (2026) |
|---|---|
| High-Protein ONS | 48.1% |
| Symptom-Adapted Supplements | 19.6% |
| Fortified Meals and Snacks | 12.4% |
| Protein Modules | 10.7% |
| Others | 9.2% |
| Total | 100.0% |
Table 4: Product Type Leadership and Market Growth for the Breast Cancer Nutrition Product Market (segment and CAGR percentage), 2026 to 2036
| Metric | Value |
|---|---|
| Global CAGR (2026 to 2036) | 9.6% |
| Leading Segment | High-Protein ONS |
In the product split, high-protein ONS is expected to lead in 2026 at 48.1%, as oncology dietitians reach first for a complete drink with protein and energy when patients eat less. By contrast, symptom-adapted supplements, about 19.6%, include clear, juice-style and sensory-adapted drinks for taste change and sore mouth, a smaller group of patients. Fortified meals and snacks, near 12.4%, suit patients still eating but short on protein. Protein modules at 10.7% add protein to food or drinks without a full product switch. Vitamin and bone-health products sold alongside treatment make up the remaining 9.2%. Across oncology care, growth of the oncology nutrition market spans every tumour type, and breast cancer has the highest treatment cost of any cancer in the United States, according to CDC.[2] High treatment costs make care teams keen to prevent weight loss that delays therapy. Over the forecast period, high-protein drinks will keep the lead as treatment moves to outpatient clinics.
- The leading group mixes milk-style and plant-based shakes with compact high-protein drinks.
- Plant-based shakes are entering clinical supply. Kate Farms is in over 1,500 hospitals and medical settings in the United States.[1] Hospital presence lets the brand reach patients at the first dietitian visit.
What keeps chemotherapy and targeted therapy ahead in breast cancer nutrition product sales by treatment phase?
Chemotherapy and targeted therapy are projected to lead treatment phase sales with 47.4% share in 2026, with surgery and radiotherapy recovery at about 21.8% and endocrine therapy near 17.5%.
Table 5: Treatment Phase Share for the Breast Cancer Nutrition Product Market (percentage share), 2026
| Treatment Phase | Estimated Share (2026) |
|---|---|
| Chemotherapy and Targeted Therapy | 47.4% |
| Surgery and Radiotherapy Recovery | 21.8% |
| Endocrine Therapy | 17.5% |
| Survivorship | 13.3% |
| Total | 100.0% |
Chemotherapy and targeted therapy are projected to stay the top phase in 2026, at 47.4%, as nausea, taste change and appetite loss peak during systemic treatment. By comparison, surgery and radiotherapy recovery, about 21.8%, covers shorter periods of higher protein need around an operation or a course of radiation. Endocrine therapy, near 17.5%, runs for years, though patients on tablets buy nutrition products less often. Finally, survivorship, an estimated 13.3%, centres on weight and muscle, and buying turns occasional. The treated population remains large. On case numbers, CDC reported 42,213 breast cancer deaths among US women in 2023, alongside 279,731 new cases in 2022.[2] A caseload of that size keeps chemotherapy clinics the main source of first orders. Systemic therapy will keep the lead as more patients receive treatment in outpatient settings.
- Chemotherapy cycles, HER2-targeted drugs and newer targeted agents define the leading phase.
- Survival in Korea is high. The Korean registry reported a 94.7% five-year survival rate for breast cancer in January 2026.[3] High survival lengthens the survivorship stage and the years of protein buying.
Why do ready-to-drink packs lead breast cancer nutrition product sales by product form?
Ready-to-drink packs are likely to lead product form sales with 44.3% share in 2026, ahead of powder at about 28.2% and puddings and semi-solids at roughly 17.1%.
Table 6: Product Form Share for the Breast Cancer Nutrition Product Market (percentage share), 2026
| Product Form | Estimated Share (2026) |
|---|---|
| Ready-to-Drink | 44.3% |
| Powder | 28.2% |
| Puddings and Semi-Solids | 17.1% |
| Others | 10.4% |
| Total | 100.0% |
Ready-to-drink packs will hold the form lead in 2026 at 44.3%, as patients on chemotherapy often feel too tired to mix or cook. On the other hand, powder, about 28.2%, costs less per serving and suits survivors adding protein to smoothies, but each serving needs preparation. Puddings and semi-solids, near 17.1%, help patients with mouth sores who find thin liquids hard. The last 10.4% goes to bars and soups. Protein powders also sell widely outside cancer care, and growth of the protein supplements market keeps generic tubs on the same pharmacy shelves. Looking ahead, bottles will keep the lead in active treatment, and powders will gain among survivors.
- The ready-to-drink group runs from plastic bottles to cartons and compact 125 ml drinks.
- Taste testing is now part of product launches. Kate Farms added a vanilla flavour to the High Protein Nutrition Shake after 611 taste tests.[1] Testing on that scale targets the taste changes that make patients drop a drink.
Why does home care lead breast cancer nutrition product sales by care setting?
Home care is estimated to lead care setting sales with 51% share in 2026, with cancer centers at about 32.6% and hospital oncology wards near 16.4%.
Table 7: Care Setting Share for the Breast Cancer Nutrition Product Market (percentage share), 2026
| Care Setting | Estimated Share (2026) |
|---|---|
| Home Care | 51% |
| Cancer Centers | 32.6% |
| Hospital Oncology Wards | 16.4% |
| Total | 100.0% |
Home care is estimated to lead settings in 2026 at 51%, as most breast cancer treatment is given in outpatient visits and patients eat and drink at home between them. Meanwhile, cancer centers, about 32.6%, supply products during infusion days and dietitian visits, though each visit covers only a few days of use. Hospital oncology wards, near 16.4%, serve inpatients after surgery or with complications, a shorter episode. Guidelines now look past the hospital stay. At the policy level, the AWMF oncology nutrition guideline aims to improve care for cancer patients beyond sector boundaries.[4] Care across sectors brings home nutrition into the plan, so home care will stay ahead as treatment moves further into outpatient clinics.
- Patients in active treatment, carers and survivors managing weight make up most home-care buyers.
- German guidance is set for years. The AWMF oncology nutrition guideline published in February 2026 is valid until January 2031.[4] A five-year validity period gives suppliers a stable reference for German hospital tenders.
Why does self-pay online buying lead breast cancer nutrition product sales by access route?
Self-pay online buying is forecast to lead access route sales with 38.4% share in 2026, ahead of self-pay pharmacy and retail at about 29.7% and prescribed and reimbursed supply at an estimated 21.5%.
Table 8: Access Route Share for the Breast Cancer Nutrition Product Market (percentage share), 2026
| Access Route | Estimated Share (2026) |
|---|---|
| Self-Pay Online | 38.4% |
| Self-Pay Pharmacy and Retail | 29.7% |
| Prescribed and Reimbursed | 21.5% |
| Cancer Center Supply | 10.4% |
| Total | 100.0% |
Self-pay online buying is forecast to lead access routes in 2026 at 38.4%, as patients reorder a tolerated flavour by subscription without a trip to the store. Self-pay pharmacy and retail, about 29.7%, serves first purchases and urgent refills, and the Kate Farms shake now reaches drugstore shelves through CVS.[1] Drugstore reach lets a first purchase happen on the way home from an infusion visit. Prescribed and reimbursed supply, near 21.5%, needs a clinician request and payer rules, which slows each order. Lastly, samples and starter packs handed out on infusion days form cancer center supply, an estimated 10.4%. Growth of the medical nutrition market, which covers all diseases, reflects the same prescribed demand. Through 2036, online buying will keep the lead, and reimbursed supply will grow as national guidelines add nutrition to cancer care.
- Brand websites, subscription services and large online pharmacies carry most online orders.
- Coverage is widening for plant-based shakes. Kate Farms products are eligible for coverage through Medicare, Medicaid, private insurance and WIC in 35 states.[1] Insured supply cuts the cost barrier for patients on long treatment courses.
What are the drivers, restraints, and opportunities in the breast cancer nutrition product market?
Treatment side effects that cut appetite keep demand for breast cancer nutrition products rising. Taste fatigue and unclear supplement claims limit repeat buying, and products designed for each treatment phase open new sales.
- Driver: Chemotherapy and radiotherapy reduce appetite and change taste, and oncology teams turn that risk into advice on protein and energy drinks.
- Restraint: Patients tire of one flavour over long treatment courses, and care teams ask patients to check any supplement against current cancer drugs.
- Opportunity: Products designed for each phase, from chemotherapy drinks to survivorship protein, keep patients buying across years of care.
Treatment Side Effects Bring Nutrition into Care Plans
A growing number of patients in active treatment is raising sales of breast cancer nutrition products. For example, new breast cancer cases among US women reached 279,731 in 2022, according to CDC.[2] Every new diagnosis brings a period of appetite loss during treatment. At the same time, the German oncology nutrition guideline aims to counter malnutrition and the serious consequences for prognosis and quality of life across the course of disease.[4] In turn, each new patient screened for nutrition risk adds a likely buyer.
Taste Fatigue and Claim Limits Hold Back Repeat Buying
Producers of cancer nutrition products face patients who stop after a few weeks of one flavour. By one count, Nutricia said about 1 in 5 patients stop a medical nutrition prescription due to flavour fatigue.[8] Drop-outs at that rate make flavour rotation a sales tool. Meanwhile, brands keep labels to nutrition needs and avoid treatment claims. Together, flavour range and careful labelling will decide repeat sales.
Phase-Matched Ranges Open New Sales
Adoption potential of breast cancer nutrition products is highest across the long survivorship period. For instance, England's National Cancer Plan aims for 75% of people diagnosed with cancer to survive five years or more by 2035.[5] More five-year survivors mean more years of protein buying after treatment. In FMI's estimate, endocrine therapy and survivorship together make up 30.8% of 2026 treatment phase sales. Consequently, brands with protein products for weight and muscle in survivorship will gain those longer buying periods.
Which country CAGRs are profiled in the breast cancer nutrition product market?
Table 9: Country CAGR Comparison for the Breast Cancer Nutrition Product Market (CAGR percentage), 2026 to 2036
| Country | CAGR (2026 to 2036) |
|---|---|
| South Korea | 9.9% |
| United States | 9.3% |
| United Kingdom | 9% |
| France | 8.9% |
| Germany | 8.7% |
| Japan | 7.5% |
How do country-level CAGRs compare in the breast cancer nutrition product market?
Korea has a large and relatively young breast cancer survivor group. Korean registry data released in January 2026 counted 354,699 people living after a breast cancer diagnosis.[3] FMI expects the quickest country gains in South Korea, at 9.9%, ahead of the 9.6% global CAGR, on that growing survivor base. Below South Korea, the United States, at 9.3%, has the largest patient pool and wide retail access. Under the national cancer plan, the United Kingdom is likely to expand 9% a year, with France a tenth lower on prescribed supplements. Close behind, Germany grows at 8.7% under a new oncology nutrition guideline. Japan, at 7.5%, has the slowest country pace, as care routines are long settled.
- Korean survivors are many and often of working age, so protein buying runs for years after treatment, and brands with survivorship ranges in Korean pharmacies and online stores gain most.
- Walmart and CVS listings have put medical shakes on mass US shelves, turning many first purchases into self-pay buys. Brands with coverage eligibility still capture patients who prefer insured supply.
- A 75% five-year survival target for 2035 adds patients to long follow-up care in England. NHS dietitians steer supplement choice, so suppliers need prescribable products more than retail reach.
- French patients receive most medical nutrition on prescription through hospital pharmacies and community prescribers, which narrows the self-pay shelf and leaves volume with prescribed suppliers.
- The 2026 AWMF guideline asks German cancer care to counter undernutrition and build quality indicators. As certification adds nutrition checks, suppliers with guideline-ready products gain hospital listings.
- Hospital nutrition teams in Japan have long-settled routines, leaving home use as the main source of new volume. Compact drinks that fit outpatient schedules hold the clearest opening.
Full report country CAGRs cover: six national rates, with South Korea alone over the 9.6% global figure, the other five below in steps down to Japan, and all remaining standard countries by region.
Country-wise Analysis
South Korea Breast Cancer Nutrition Product Market Outlook (2026 to 2036)
South Korea is expected to be the fastest-growing country, at a 9.9% CAGR, as a long survivorship period keeps patients buying. On the data side, Dailypharm reported on 20 January 2026 that Korea had 2,732,906 cancer survivors in 2023, 5.3% of the population, and that breast cancer was the most common cancer among women aged 40 to 69.[3] In particular, women of working age stay on treatment and survivorship nutrition for many years.
Key takeaway: Korean demand comes as much from survivors managing weight and muscle as from patients in treatment, which rewards brands with survivorship products.
United States Breast Cancer Nutrition Product Market Outlook (2026 to 2036)
FMI estimates a 9.3% CAGR for the United States, reflecting the largest treated population of the six countries and the widest self-pay shelf. To size that population, CDC data updated on 26 May 2026 show 279,731 new female breast cancer cases in 2022 and USD 29.8 billion of breast cancer medical costs in 2020.[2] A caseload of that size gives brands a large pool of first-time buyers each year. On the access side, Kate Farms products are eligible for Medicare, Medicaid and private insurance coverage, and wide retail placement adds self-pay buying.[1] Coverage and shelf access together let patients choose between insured and self-pay supply.
Key takeaway: US brands compete on two fronts at once, mass retail shelves for self-pay buyers and coverage eligibility for insured patients.
United Kingdom Breast Cancer Nutrition Product Market Outlook (2026 to 2036)
British demand is forecast to rise 9% a year as more women enter curative treatment. Published on 4 February 2026, the National Cancer Plan for England targets 75% five-year survival and three in four cancers diagnosed at stage 1 or 2 by 2035.[5] Earlier diagnosis puts more patients on curative pathways that include nutrition advice, and NHS dietitians steer supplement choice during treatment.
Key takeaway: British growth runs through NHS prescribing, as earlier diagnosis and longer survival add patients to dietitian-led care.
France Breast Cancer Nutrition Product Market Outlook (2026 to 2036)
French sales are projected to rise 8.9% a year, with prescribed medical nutrition carrying most demand. On the product side, Nutricia said the new plant-based medical nutrition products, including Fortimel PlantBased Protein for malnutrition due to a medical condition or disease, reached over 10 markets in six months, France among them.[8] Plant-based options give French prescribers an alternative for patients who reject dairy drinks. In practice, hospital pharmacies and community prescribers supply most medical nutrition there, and the self-pay shelf is narrower.
Key takeaway: French volume stays with prescribed medical nutrition, so suppliers gain through hospital pharmacy listings more than through retail.
Germany Breast Cancer Nutrition Product Market Outlook (2026 to 2036)
FMI's forecast for Germany is an 8.7% CAGR, with new guidance formalising nutrition care in oncology. On policy, the AWMF published the guideline Klinische Ernährung in der Onkologie on 19 February 2026, aiming to improve nutrition care across the disease course and develop quality indicators for certification.[4] Over time, certified breast cancer centers will add nutrition checks as those indicators arrive.
Key takeaway: German demand will rise as certified cancer centres adopt the 2026 guideline, giving suppliers a clear standard to meet in tenders.
Japan Breast Cancer Nutrition Product Market Outlook (2026 to 2036)
Japanese demand is likely to expand 7.5% a year in FMI's estimate, 2.1 points under the 9.6% global CAGR, as care routines are long settled. Meanwhile, the National Cancer Center Japan updated national cancer incidence data through 2023 on 3 April 2026.[9] Updated incidence figures guide hospital planning for oncology nutrition supply. Hospital nutrition teams are long established, so growth comes from home use of compact drinks.
Key takeaway: Japanese growth comes from home use of compact drinks between outpatient visits, with hospital supply already mature.
Who are the notable companies in the breast cancer nutrition product market?
Abbott, Danone Nutricia, Nestlé Health Science, Fresenius Kabi, Hormel Health Labs and Medtrition are the profiled companies.
In FMI's view, the market's leading companies include global medical nutrition groups and makers of cancer-oriented meals and protein modules. At the top end, Nestlé Health Science reported 3.2% organic growth and CHF 6,551 million of sales for 2025.[7] Scale of that size supports oncology ranges across many countries. On the deal front, Danone Nutricia added Kate Farms in July 2025, bringing plant-based shakes into the group.[6] Plant-based shakes give Danone a product suited to patients with taste change. Growth is uneven across the large groups, however. Abbott reported adult nutrition sales of USD 1,119 million for the June 2026 quarter, down 4% on a comparable basis.[10] Softer adult nutrition sales push Abbott to defend clinic listings, which strengthens the hand of buyers in price talks. Abbott, Fresenius Kabi, Hormel Health Labs and Medtrition complete the group.
- Multinational clinical nutrition suppliers: Abbott, Danone Nutricia, Nestlé Health Science and Fresenius Kabi.
- Oncology meal makers: Hormel Health Labs.
- Protein module makers: Medtrition.
Competitive Benchmarking: Breast Cancer Nutrition Product Market
Table 10: Competitive Benchmarking for the Breast Cancer Nutrition Product Market (qualitative ratings), 2026
| Company | High-Protein Drinks | Retail Access | Prescribed Supply | Recent Activity |
|---|---|---|---|---|
| Danone Nutricia | High | High | High | High |
| Nestlé Health Science | High | High | Medium | High |
| Abbott | High | High | Medium | Medium |
| Fresenius Kabi | High | Low | High | Low |
| Hormel Health Labs | Medium | Low | Medium | Low |
The table compares the companies on high-protein drinks, retail access, prescribed supply and recent activity.
Key Developments in the Breast Cancer Nutrition Product Market
- Kate Farms said on 28 July 2026 that the High Protein Nutrition Shake would reach over 6,800 Walmart and CVS stores by August 2026, moving medical shakes onto mass retail shelves.[1]
- CDC refreshed breast cancer case and cost data on 26 May 2026, listing 279,731 new female cases for 2022, a reminder of the size of the treated pool.[2]
- In a 3 April 2026 update, the National Cancer Center Japan extended national cancer incidence data through 2023, which supports hospital supply planning.[9]
- On 19 February 2026, the AWMF published the German guideline on clinical nutrition in oncology, pointing cancer centres toward nutrition quality indicators.[4]
- England published a National Cancer Plan with a 75% five-year survival ambition for 2035 on 4 February 2026; for suppliers this means a longer survivorship market.[5]
- On 20 January 2026, Korean registry figures showed 2,732,906 cancer survivors for 2023, a base that keeps survivorship demand growing.[3]
Key Players in the Breast Cancer Nutrition Product Market
Multinational Clinical Nutrition Suppliers
- Abbott
- Danone Nutricia
- Nestlé Health Science
- Fresenius Kabi
Oncology Meal Makers
- Hormel Health Labs
Protein Module Makers
- Medtrition
Breast Cancer Nutrition Product Market - Report Scope
Table 11: Report Scope for the Breast Cancer Nutrition Product Market (coverage fields and definitions), 2026 to 2036
| Coverage field | Report scope |
|---|---|
| Market breakdown | Product type; treatment phase; product form; care setting; access route; region |
| Quantitative units | USD million |
| Market definition | Oral nutrition products bought for people in treatment for breast cancer or in survivorship, covering high-protein oral nutritional supplements, symptom-adapted supplements, fortified meals and snacks and protein modules, supplied through online and retail self-pay, prescription and reimbursement or cancer centers. Tube feeds, parenteral nutrition, cancer drugs, general vitamins and everyday foods are excluded. |
| Regions covered | North America; Latin America; Western Europe; Eastern Europe; East Asia; South Asia and Pacific; Middle East and Africa |
| Countries covered | United States; Canada; Brazil; Mexico; Argentina; Chile; Germany; France; United Kingdom; Italy; Spain; Benelux; Nordics; Poland; Czech Republic; Romania; Hungary; China; Japan; South Korea; India; ASEAN; Australia and New Zealand; GCC Countries; South Africa; Türkiye; Israel |
| Key companies profiled | Abbott, Danone Nutricia, Nestlé Health Science, Fresenius Kabi, Hormel Health Labs, Medtrition |
| Forecast period | 2026 to 2036 |
Breast Cancer Nutrition Product Market - Research Methodology
Table 12: Research Methodology for the Breast Cancer Nutrition Product Market (research methods and approach), 2026 edition
| Method | Approach |
|---|---|
| Data Sources | Cancer registries, public health agencies, clinical guidelines and nutrition company releases. |
| Desk Research | Desk research covers breast cancer incidence and survival, oncology nutrition guidance, retail and coverage access and supplier moves. |
| Market Sizing and Forecasting | Sizing starts from the 2026 base of USD 416.9 million and the 9.6% CAGR for 2026 to 2036. |
| Data Validation | Figures are cross-checked across company, industry and government sources. |
Breast Cancer Nutrition Product Market by Segments
Breast Cancer Nutrition Product Market segmented by Product Type:
- High-Protein ONS
- Symptom-Adapted Supplements
- Fortified Meals and Snacks
- Protein Modules
- Others
Breast Cancer Nutrition Product Market segmented by Treatment Phase:
- Chemotherapy and Targeted Therapy
- Surgery and Radiotherapy Recovery
- Endocrine Therapy
- Survivorship
Breast Cancer Nutrition Product Market segmented by Product Form:
- Ready-to-Drink
- Powder
- Puddings and Semi-Solids
- Others
Breast Cancer Nutrition Product Market segmented by Care Setting:
- Home Care
- Cancer Centers
- Hospital Oncology Wards
Breast Cancer Nutrition Product Market segmented by Access Route:
- Self-Pay Online
- Self-Pay Pharmacy and Retail
- Prescribed and Reimbursed
- Cancer Center Supply
Breast Cancer Nutrition Product Market by Region
- North America
- United States
- Canada
- Latin America
- Brazil
- Mexico
- Argentina
- Chile
- Western Europe
- Germany
- France
- United Kingdom
- Italy
- Spain
- Benelux
- Nordics
- Eastern Europe
- Poland
- Czech Republic
- Romania
- Hungary
- East Asia
- China
- Japan
- South Korea
- South Asia and Pacific
- India
- ASEAN
- Australia and New Zealand
- Middle East and Africa
- GCC Countries
- South Africa
- Türkiye
- Israel
Research Sources and Bibliography
- [1] Kate Farms. (2026, July 28). Kate Farms Expands High Protein Nutrition Shake Into Walmart and CVS as Retail Distribution Grows Sevenfold. https://katefarms.com/news-and-press/press-releases/kate-farms-expands-high-protein-nutrition-shake-into-walmart-and-cvs/
- [2] Centers for Disease Control and Prevention. (2026, May 26). Health and Economic Benefits of Breast Cancer Interventions. https://www.cdc.gov/nccdphp/priorities/breast-cancer.html
- [3] Dailypharm. (2026, January 20). 2.73 million cancer patients, 7 in 10 survive five years or more. https://www.dailypharm.com/user/news/334973
- [4] Arbeitsgemeinschaft der Wissenschaftlichen Medizinischen Fachgesellschaften. (2026, February 19). Klinische Ernährung in der Onkologie. https://www.awmf.org/aktuelles/awmf-aktuell/klinische-ernaehrung-in-der-onkologie
- [5] Cancer Research UK. (2026, February 4). A turning point for cancer? Breaking down the National Cancer Plan for England. https://news.cancerresearchuk.org/2026/02/04/breaking-down-the-national-cancer-plan-for-england/
- [6] Danone. (2025, July 1). Danone completes the acquisition of Kate Farms, enhancing its U.S. specialized nutrition offerings. https://www.danone.com/newsroom/press-releases/kate-farms-acquisition.html
- [7] Nestlé S.A. (2026, February 19). Full-year results 2025. https://www.nestle.com/media/pressreleases/allpressreleases/full-year-results-2025
- [8] Nutricia. (2025, October 1). Nutricia's new savory plant-based medical nutrition proven to improve patient adherence. https://www.nutricia.com/latest-news/Fortimel-PlantBased-Protein
- [9] National Cancer Center Japan. (2026, April 3). Cancer Statistics in Japan: Table Download. https://ganjoho.jp/reg_stat/statistics/data/dl/en.html
- [10] Abbott. (2026, July 16). Abbott Reports Second-Quarter 2026 Results and Raises Full-Year EPS Guidance. https://abbott.mediaroom.com/2026-07-16-Abbott-Reports-Second-Quarter-2026-Results-and-Raises-Full-Year-EPS-Guidance
This bibliography is provided for reader reference. The full report contains the complete reference list and detailed citations.
This Report Answers
- How big is the breast cancer nutrition product market during 2026?
- What market size is projected by 2036?
- Which product type holds notable share?
- Which treatment phase holds notable share?
- Which countries have notable growth?
- Which companies are notable in the market?
Frequently Asked Questions
How large is the breast cancer nutrition product market expected in 2026?
The breast cancer nutrition product market is likely to reach USD 416.9 million in 2026, up from an estimated USD 380.4 million in 2025, FMI estimates. Sales of breast cancer nutrition products are projected to reach USD 1,042.7 million by 2036.
What CAGR is projected for the breast cancer nutrition product market through 2036?
Sales of breast cancer nutrition products are expected to grow at a 9.6% CAGR through 2036. More patients in outpatient treatment, longer survival and wider shelf access support that growth.
Which product type holds a notable market share in 2026?
High-protein ONS will lead with 48.1% share in 2026. Symptom-adapted supplements follow at about 19.6%.
Which treatment phase holds a notable market share in 2026?
Chemotherapy and targeted therapy are expected to lead with 47.4% share in 2026. Surgery and radiotherapy recovery holds an estimated 21.8%.
Which country has a notable expansion outlook through 2036?
FMI projects South Korea to grow fastest, at 9.9%. The United States follows at 9.3%.
Who are the key companies in the breast cancer nutrition product market?
Abbott, Danone Nutricia, Nestlé Health Science and Fresenius Kabi lead the global medical nutrition group. Hormel Health Labs and Medtrition complete the profiled companies.
Preview the report firsthand - request a free sample
Get SampleGet the brochure for pricing and purchase details.
Get PDFTable of Content
- Key Takeaways
- Market Size and CAGR
- Top Growth Driver
- Fastest Growing Segment
- Leading Region
- Key Companies
- Emerging Opportunities
- Executive Summary
- Global Market Outlook
- Demand-side Trends
- Supply-side Trends
- Technology Roadmap Analysis
- Analysis and Recommendations
- Analyst Perspective (What is happening? Why now? What should investors know?)
- Key Questions Answered
- How large is the market?
- What is the CAGR?
- What are key trends?
- Which region dominates?
- Who are the leaders?
- Market Overview
- Market Coverage / Taxonomy
- Market Definition / Scope / Limitations
- Research Methodology
- Chapter Orientation
- Analytical Lens and Working Hypotheses
- Market Structure, Signals, and Trend Drivers
- Benchmarking and Cross-market Comparability
- Market Sizing, Forecasting, and Opportunity Mapping
- Research Design and Evidence Framework
- Desk Research Programme (Secondary Evidence)
- Expert Input and Fieldwork (Primary Evidence)
- Tooling, Models, and Reference Databases
- Data Engineering and Model Build
- Quality Assurance and Audit Trail
- Market Background
- Market Dynamics (Drivers, Restraints, Opportunity, Trends)
- Scenario Forecast (Optimistic, Likely, Conservative)
- Impact Analysis
- AI Impact
- Sustainability Impact
- Regulatory Impact
- Technology Impact
- Consumer / Buyer Analysis
- Purchase Drivers
- Adoption Barriers
- Buyer Journey
- Opportunity Map Analysis
- Product Life Cycle Analysis
- Supply Chain Analysis
- Investment Feasibility Matrix
- Value Chain Analysis
- PESTLE and Porter's Analysis
- Regulatory Landscape
- Regional Parent Market Outlook
- Production and Consumption Statistics
- Import and Export Statistics
- Global Market Analysis and Forecast, 2021 to 2036
- Historical Market Size Value (USD Million) Analysis, 2021 to 2025
- Current and Future Market Size Value (USD Million) Projections, 2026 to 2036
- Y-o-Y Growth Trend Analysis
- Absolute $ Opportunity Analysis
- Global Market Pricing Analysis, 2021 to 2036
- Global Market Analysis and Forecast, By Product Type, 2021 to 2036
- Introduction / Key Findings
- Historical Market Size Value (USD Million) Analysis By Product Type, 2021 to 2025
- Current and Future Market Size Value (USD Million) Analysis and Forecast By Product Type, 2026 to 2036
- High-Protein ONS
- Symptom-Adapted Supplements
- Fortified Meals and Snacks
- Protein Modules
- Others
- Y-o-Y Growth Trend Analysis By Product Type, 2021 to 2025
- Absolute $ Opportunity Analysis By Product Type, 2026 to 2036
- Global Market Analysis and Forecast, By Treatment Phase, 2021 to 2036
- Introduction / Key Findings
- Historical Market Size Value (USD Million) Analysis By Treatment Phase, 2021 to 2025
- Current and Future Market Size Value (USD Million) Analysis and Forecast By Treatment Phase, 2026 to 2036
- Chemotherapy and Targeted Therapy
- Surgery and Radiotherapy Recovery
- Endocrine Therapy
- Survivorship
- Y-o-Y Growth Trend Analysis By Treatment Phase, 2021 to 2025
- Absolute $ Opportunity Analysis By Treatment Phase, 2026 to 2036
- Global Market Analysis and Forecast, By Product Form, 2021 to 2036
- Introduction / Key Findings
- Historical Market Size Value (USD Million) Analysis By Product Form, 2021 to 2025
- Current and Future Market Size Value (USD Million) Analysis and Forecast By Product Form, 2026 to 2036
- Ready-to-Drink
- Powder
- Puddings and Semi-Solids
- Others
- Y-o-Y Growth Trend Analysis By Product Form, 2021 to 2025
- Absolute $ Opportunity Analysis By Product Form, 2026 to 2036
- Global Market Analysis and Forecast, By Care Setting, 2021 to 2036
- Introduction / Key Findings
- Historical Market Size Value (USD Million) Analysis By Care Setting, 2021 to 2025
- Current and Future Market Size Value (USD Million) Analysis and Forecast By Care Setting, 2026 to 2036
- Home Care
- Cancer Centers
- Hospital Oncology Wards
- Y-o-Y Growth Trend Analysis By Care Setting, 2021 to 2025
- Absolute $ Opportunity Analysis By Care Setting, 2026 to 2036
- Global Market Analysis and Forecast, By Access Route, 2021 to 2036
- Introduction / Key Findings
- Historical Market Size Value (USD Million) Analysis By Access Route, 2021 to 2025
- Current and Future Market Size Value (USD Million) Analysis and Forecast By Access Route, 2026 to 2036
- Self-Pay Online
- Self-Pay Pharmacy and Retail
- Prescribed and Reimbursed
- Cancer Center Supply
- Y-o-Y Growth Trend Analysis By Access Route, 2021 to 2025
- Absolute $ Opportunity Analysis By Access Route, 2026 to 2036
- Global Market Analysis and Forecast, By Region, 2021 to 2036
- Introduction
- Historical Market Size Value (USD Million) Analysis By Region, 2021 to 2025
- Current Market Size Value (USD Million) Analysis and Forecast By Region, 2026 to 2036
- North America
- Latin America
- Western Europe
- Eastern Europe
- East Asia
- South Asia and Pacific
- Middle East and Africa
- Market Attractiveness Analysis By Region
- North America Market Analysis and Forecast, By Country, 2021 to 2036
- Historical Market Size Value (USD Million) Trend Analysis By Market Taxonomy, 2021 to 2025
- Market Size Value (USD Million) Forecast By Market Taxonomy, 2026 to 2036
- By Country
- United States
- Canada
- By Product Type
- By Treatment Phase
- By Product Form
- By Care Setting
- By Access Route
- By Country
- Market Attractiveness Analysis
- By Country
- By Product Type
- By Treatment Phase
- By Product Form
- By Care Setting
- By Access Route
- Key Takeaways
- Latin America Market Analysis and Forecast, By Country
- Historical Market Size Value (USD Million) Trend Analysis By Market Taxonomy, 2021 to 2025
- Market Size Value (USD Million) Forecast By Market Taxonomy, 2026 to 2036
- By Country
- Brazil
- Mexico
- Argentina
- Chile
- By Product Type
- By Treatment Phase
- By Product Form
- By Care Setting
- By Access Route
- By Country
- Market Attractiveness Analysis
- By Country
- By Product Type
- By Treatment Phase
- By Product Form
- By Care Setting
- By Access Route
- Key Takeaways
- Western Europe Market Analysis and Forecast, By Country
- Historical Market Size Value (USD Million) Trend Analysis By Market Taxonomy, 2021 to 2025
- Market Size Value (USD Million) Forecast By Market Taxonomy, 2026 to 2036
- By Country
- Germany
- France
- United Kingdom
- Italy
- Spain
- Benelux
- Nordics
- By Product Type
- By Treatment Phase
- By Product Form
- By Care Setting
- By Access Route
- By Country
- Market Attractiveness Analysis
- By Country
- By Product Type
- By Treatment Phase
- By Product Form
- By Care Setting
- By Access Route
- Key Takeaways
- Eastern Europe Market Analysis and Forecast, By Country
- Historical Market Size Value (USD Million) Trend Analysis By Market Taxonomy, 2021 to 2025
- Market Size Value (USD Million) Forecast By Market Taxonomy, 2026 to 2036
- By Country
- Poland
- Czech Republic
- Romania
- Hungary
- By Product Type
- By Treatment Phase
- By Product Form
- By Care Setting
- By Access Route
- By Country
- Market Attractiveness Analysis
- By Country
- By Product Type
- By Treatment Phase
- By Product Form
- By Care Setting
- By Access Route
- Key Takeaways
- East Asia Market Analysis and Forecast, By Country
- Historical Market Size Value (USD Million) Trend Analysis By Market Taxonomy, 2021 to 2025
- Market Size Value (USD Million) Forecast By Market Taxonomy, 2026 to 2036
- By Country
- China
- Japan
- South Korea
- By Product Type
- By Treatment Phase
- By Product Form
- By Care Setting
- By Access Route
- By Country
- Market Attractiveness Analysis
- By Country
- By Product Type
- By Treatment Phase
- By Product Form
- By Care Setting
- By Access Route
- Key Takeaways
- South Asia and Pacific Market Analysis and Forecast, By Country
- Historical Market Size Value (USD Million) Trend Analysis By Market Taxonomy, 2021 to 2025
- Market Size Value (USD Million) Forecast By Market Taxonomy, 2026 to 2036
- By Country
- India
- ASEAN
- Australia and New Zealand
- By Product Type
- By Treatment Phase
- By Product Form
- By Care Setting
- By Access Route
- By Country
- Market Attractiveness Analysis
- By Country
- By Product Type
- By Treatment Phase
- By Product Form
- By Care Setting
- By Access Route
- Key Takeaways
- Middle East and Africa Market Analysis and Forecast, By Country
- Historical Market Size Value (USD Million) Trend Analysis By Market Taxonomy, 2021 to 2025
- Market Size Value (USD Million) Forecast By Market Taxonomy, 2026 to 2036
- By Country
- GCC Countries
- South Africa
- Türkiye
- Israel
- By Product Type
- By Treatment Phase
- By Product Form
- By Care Setting
- By Access Route
- By Country
- Market Attractiveness Analysis
- By Country
- By Product Type
- By Treatment Phase
- By Product Form
- By Care Setting
- By Access Route
- Key Takeaways
- Key Countries Market Analysis
- United States
- Pricing Analysis
- Market Share Analysis, 2025
- By Product Type
- By Treatment Phase
- By Product Form
- By Care Setting
- By Access Route
- Canada
- Pricing Analysis
- Market Share Analysis, 2025
- By Product Type
- By Treatment Phase
- By Product Form
- By Care Setting
- By Access Route
- Mexico
- Pricing Analysis
- Market Share Analysis, 2025
- By Product Type
- By Treatment Phase
- By Product Form
- By Care Setting
- By Access Route
- Brazil
- Pricing Analysis
- Market Share Analysis, 2025
- By Product Type
- By Treatment Phase
- By Product Form
- By Care Setting
- By Access Route
- Chile
- Pricing Analysis
- Market Share Analysis, 2025
- By Product Type
- By Treatment Phase
- By Product Form
- By Care Setting
- By Access Route
- Germany
- Pricing Analysis
- Market Share Analysis, 2025
- By Product Type
- By Treatment Phase
- By Product Form
- By Care Setting
- By Access Route
- United Kingdom
- Pricing Analysis
- Market Share Analysis, 2025
- By Product Type
- By Treatment Phase
- By Product Form
- By Care Setting
- By Access Route
- Italy
- Pricing Analysis
- Market Share Analysis, 2025
- By Product Type
- By Treatment Phase
- By Product Form
- By Care Setting
- By Access Route
- Spain
- Pricing Analysis
- Market Share Analysis, 2025
- By Product Type
- By Treatment Phase
- By Product Form
- By Care Setting
- By Access Route
- France
- Pricing Analysis
- Market Share Analysis, 2025
- By Product Type
- By Treatment Phase
- By Product Form
- By Care Setting
- By Access Route
- India
- Pricing Analysis
- Market Share Analysis, 2025
- By Product Type
- By Treatment Phase
- By Product Form
- By Care Setting
- By Access Route
- ASEAN
- Pricing Analysis
- Market Share Analysis, 2025
- By Product Type
- By Treatment Phase
- By Product Form
- By Care Setting
- By Access Route
- Australia and New Zealand
- Pricing Analysis
- Market Share Analysis, 2025
- By Product Type
- By Treatment Phase
- By Product Form
- By Care Setting
- By Access Route
- China
- Pricing Analysis
- Market Share Analysis, 2025
- By Product Type
- By Treatment Phase
- By Product Form
- By Care Setting
- By Access Route
- Japan
- Pricing Analysis
- Market Share Analysis, 2025
- By Product Type
- By Treatment Phase
- By Product Form
- By Care Setting
- By Access Route
- South Korea
- Pricing Analysis
- Market Share Analysis, 2025
- By Product Type
- By Treatment Phase
- By Product Form
- By Care Setting
- By Access Route
- Poland
- Pricing Analysis
- Market Share Analysis, 2025
- By Product Type
- By Treatment Phase
- By Product Form
- By Care Setting
- By Access Route
- Hungary
- Pricing Analysis
- Market Share Analysis, 2025
- By Product Type
- By Treatment Phase
- By Product Form
- By Care Setting
- By Access Route
- Türkiye
- Pricing Analysis
- Market Share Analysis, 2025
- By Product Type
- By Treatment Phase
- By Product Form
- By Care Setting
- By Access Route
- South Africa
- Pricing Analysis
- Market Share Analysis, 2025
- By Product Type
- By Treatment Phase
- By Product Form
- By Care Setting
- By Access Route
- United States
- Market Structure Analysis
- Competition Dashboard
- Competition Benchmarking
- Market Share Analysis of Top Players
- By Regional
- By Product Type
- By Treatment Phase
- By Product Form
- By Care Setting
- By Access Route
- Emerging Startups
- Innovation Benchmarking
- Competition Analysis
- Competition Deep Dive
- Danone Nutricia
- Overview
- Product Portfolio
- Profitability by Market Segments
- Sales Footprint
- Strategy Overview
- Marketing Strategy
- Product Strategy
- Channel Strategy
- Nestlé Health Science
- Abbott
- Fresenius Kabi
- Hormel Health Labs
- Medtrition
- Danone Nutricia
- Case Studies
- Success Stories
- Recent Developments
- Competition Deep Dive
- Assumptions & Acronyms Used


