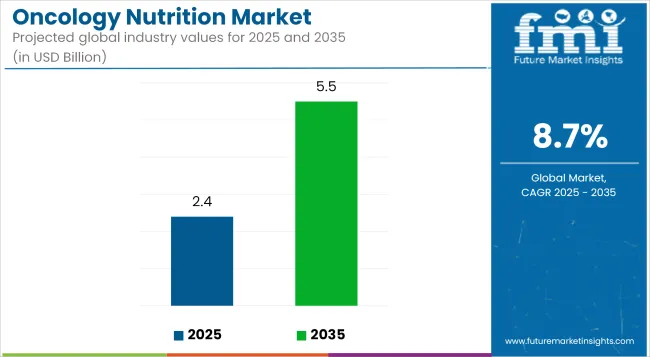
The global Oncology Nutrition Market is estimated to be valued at USD 2.4 billion in 2025 and is projected to reach USD 5.5 billion by 2035, registering a compound annual growth rate of 8.7% over the forecast period.

| Metric | Value |
|---|---|
| Market Size in 2025 | USD 2.4 billion |
| Projected Market Size in 2035 | USD 5.5 billion |
| CAGR (2025 to 2035) | 8.7% |
The Oncology Nutrition Market is gaining strong momentum due to the growing global cancer incidence and the increasing integration of nutritional support in oncology care. Healthcare providers now emphasize tailored nutrition plans to manage treatment side effects, improve immunity, and enhance recovery outcomes.
The shift towards personalized, patient-centric therapies, supported by innovations in clinical nutrition and AI-driven diet solutions, is shaping a robust future outlook. Expansion of home-based care and tele-nutrition services is also widening access.
Despite challenges like cost and regional awareness gaps, the market is witnessing accelerated development as nutritional therapy becomes a core pillar of comprehensive cancer treatment, driven by evolving clinical guidelines and healthcare policy support. The market is set to grow steadily in the coming years.
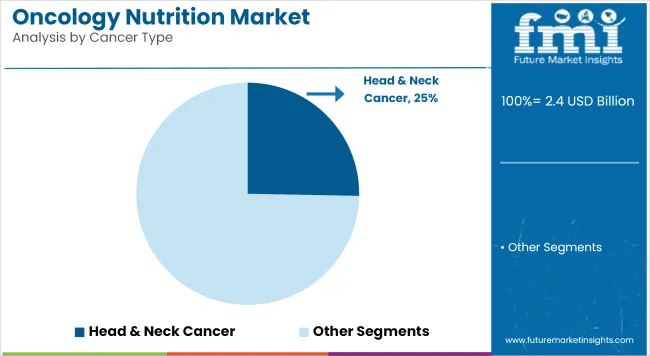
The head & neck cancer segment, projected to hold 25.3% of the revenue share in 2025, has been identified as the leading category due to its rising global prevalence and complex nutritional demands. It has been widely observed that patients suffering from these cancers often experience dysphagia, mucositis, and severe appetite loss, making nutritional intervention essential.
Clinical practice guidelines have increasingly endorsed early and aggressive nutritional support to improve treatment tolerance and patient outcomes. Additionally, radiotherapy and chemotherapy regimens in these cancers are known to severely impact oral intake, further reinforcing the need for specialized oncology nutrition products.
Medical institutions have reported higher usage of enteral nutrition in this patient group. As a result, specialized nutritional formulas and feeding protocols are being developed specifically for head and neck cancer patients. Continued medical attention, coupled with rising healthcare infrastructure in developing regions, is expected to support this segment's dominance in the oncology nutrition market.

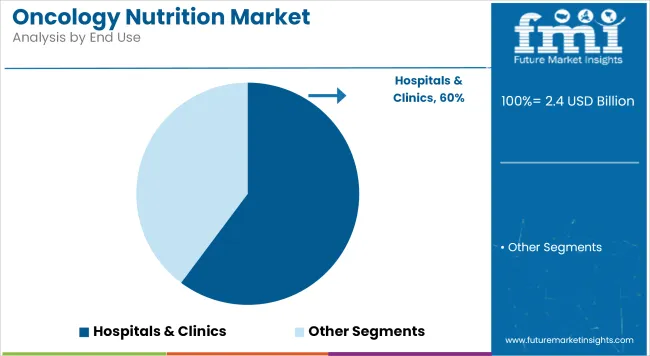
Hospitals segment, accounting for 60.2% of the total revenue share in 2025, has remained dominant due to the institutional integration of clinical nutrition in cancer care pathways. Structured nutritional assessments, carried out at the time of diagnosis and throughout the treatment process, have been standardized in hospital settings.
This has enabled early identification of malnutrition risk, leading to timely intervention. It has also been noted that hospitals and cancer centers offer multidisciplinary care teams that include dietitians and oncology nutritionists, ensuring patient-specific dietary support.
Furthermore, the presence of advanced infusion systems and enteral feeding setups allows for precise and continuous nutrient delivery. The higher footfall of critical and advanced-stage patients in hospitals has further driven demand for medical nutrition therapy.

Complex Nutritional Needs, Lack of Standardization, and Accessibility Gaps
The oncology nutrition market is mainly challenged by very specific nutritional needs of cancer patients based on type of cancer, stage of treatment and co-morbid diseases. There are no standardized nutrition protocols around hospitals and oncology centers making care delivery variable.
Numerous regions do not havededicated oncology dietitians, and patients in low-income regions do not have guaranteed access to specialized nutritional supplements, enteral formulas, or protein-enriched food options. Moreover, the side effects of chemotherapy and radiation nausea, mucositis, loss of appetite too often inhibit nutrient absorption and make nutritional intervention difficult.
Rise in Cancer Cases, Clinical Nutrition Advances, and Personalized Care Trends
The global market share is growing steadily despite the challenges owing to the global increase in cancer incidence coupled with increased acceptance of nutritional therapy as an integral component of cancer management and recovery. Oncology nutrition aids in muscle mass maintenance, immunity improvement, treatment tolerance enhancement, and post-treatment complication reduction.
Recent advances in immunonutrition, utilization of glutamine-rich formulas, and omega-3 supplementation are paving new paths in patient-specific nutrition support. The value of personalized nutrition services, AI-driven meal planning, and evidence-based dietary supplements tailored to treatment stages drives faster adoption across hospitals and homecare settings.
Moreover, collaborations among oncology clinics, nutrition firms, and telehealth platforms are expanding access to dietary counseling and high-protein ready-to-drink formulations for cancer patients across nations.
High cancer incidence and increasing institutional backing for integrated nutrition therapy are bolstering the USA market. Hospitals and oncology centers are teaming up with clinical nutrition brands and dietitians to offer tailored supplements, feeding programs, and enteral nutrition solutions in inpatient and outpatient settings.
| Country | CAGR (2025 to 2035) |
|---|---|
| USA | 8.8% |
The NHS and private oncology clinics in the UK are investing in oncology-specific meal planning, dietetic consultations and patient recovery kits. There is increasing demand for affordable food products that are plant-based and help relieve symptoms of treatment patients, like chemo and radiation.
| Country | CAGR (2025 to 2035) |
|---|---|
| UK | 8.5% |
EU countries concentrate on clinical nutrition & in cancer care pathways, with government funding for hospital dietitian staffing and research on nutrition. France, Germany, and Netherlands:For intensive treatment cancer patients, offering new food approaches that are gluten-free, lactose-free, and fortified
| Country | CAGR (2025 to 2035) |
|---|---|
| EU | 8.7% |
Japan’s aging population combined with its advanced oncology architecture is driving growth in enteral nutrition, texture-modified diets, and amino acid-rich supplements. Nutritional therapy is making its way into routine cancer care for elderly patients, with digital platforms providing remote dietary guidance and support.
| Country | CAGR (2025 to 2035) |
|---|---|
| Japan | 8.7% |
Oncology nutrition is becoming more common in South Korea's cancer recovery centers and wellness-focused clinics. E-commerce channels and hospital programmes have fuelled access to protein-enriched soups, meal replacements and anti-nausea snacks for chemotherapy and post-surgery recovery patients.
| Country | CAGR (2025 to 2035) |
|---|---|
| South Korea | 8.8% |
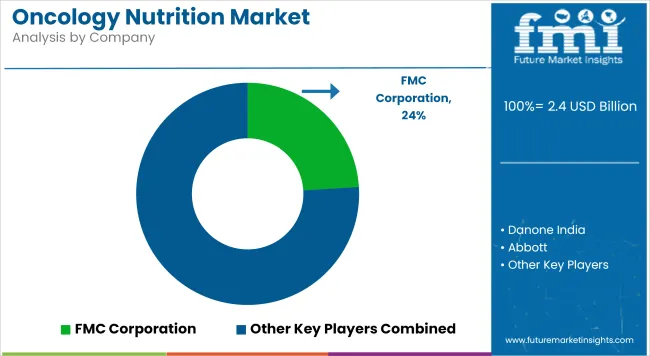
The oncology nutrition market is witnessing intensifying competition, driven by continuous innovation, clinical validation, and personalized product development. Market participants are actively focusing on formulating advanced nutritional solutions tailored to specific cancer types and treatment stages.
Strategic collaborations with oncology centers and clinical institutions are being pursued to enhance product efficacy and build clinical credibility. In addition, considerable investments are being made in R&D to develop immuno-nutrition blends and condition-specific dietary formulations.
Digital platforms and tele-nutrition services are being increasingly leveraged to improve patient accessibility and adherence. These strategic activities are collectively influencing the competitive dynamics, fostering rapid product differentiation, and accelerating the adoption of oncology-focused nutritional therapies across institutional and home-care settings.
Key Development

The overall market size for the oncology nutrition market was USD 2.4 billion in 2025.
The oncology nutrition market is expected to reach USD 5.5 billion in 2035.
The demand for oncology nutrition is rising due to increasing cancer prevalence, greater awareness of the role of nutrition in cancer treatment, and advancements in personalized dietary formulations. The growing use of nutrition therapy to improve patient outcomes and support during chemotherapy and radiation is also contributing to market growth.
The top 5 countries driving the development of the oncology nutrition market are the USA, China, Germany, Japan, and India.
Head & Neck Cancer and Stomach & Gastrointestinal Cancers are expected to command a significant share over the assessment period.


Our Research Products

The "Full Research Suite" delivers actionable market intel, deep dives on markets or technologies, so clients act faster, cut risk, and unlock growth.

The Leaderboard benchmarks and ranks top vendors, classifying them as Established Leaders, Leading Challengers, or Disruptors & Challengers.

Locates where complements amplify value and substitutes erode it, forecasting net impact by horizon

We deliver granular, decision-grade intel: market sizing, 5-year forecasts, pricing, adoption, usage, revenue, and operational KPIs—plus competitor tracking, regulation, and value chains—across 60 countries broadly.

Spot the shifts before they hit your P&L. We track inflection points, adoption curves, pricing moves, and ecosystem plays to show where demand is heading, why it is changing, and what to do next across high-growth markets and disruptive tech

Real-time reads of user behavior. We track shifting priorities, perceptions of today’s and next-gen services, and provider experience, then pace how fast tech moves from trial to adoption, blending buyer, consumer, and channel inputs with social signals (#WhySwitch, #UX).

Partner with our analyst team to build a custom report designed around your business priorities. From analysing market trends to assessing competitors or crafting bespoke datasets, we tailor insights to your needs.
Supplier Intelligence
Discovery & Profiling
Capacity & Footprint
Performance & Risk
Compliance & Governance
Commercial Readiness
Who Supplies Whom
Scorecards & Shortlists
Playbooks & Docs
Category Intelligence
Definition & Scope
Demand & Use Cases
Cost Drivers
Market Structure
Supply Chain Map
Trade & Policy
Operating Norms
Deliverables
Buyer Intelligence
Account Basics
Spend & Scope
Procurement Model
Vendor Requirements
Terms & Policies
Entry Strategy
Pain Points & Triggers
Outputs
Pricing Analysis
Benchmarks
Trends
Should-Cost
Indexation
Landed Cost
Commercial Terms
Deliverables
Brand Analysis
Positioning & Value Prop
Share & Presence
Customer Evidence
Go-to-Market
Digital & Reputation
Compliance & Trust
KPIs & Gaps
Outputs
Full Research Suite comprises of:
Market outlook & trends analysis
Interviews & case studies
Strategic recommendations
Vendor profiles & capabilities analysis
5-year forecasts
8 regions and 60+ country-level data splits
Market segment data splits
12 months of continuous data updates
DELIVERED AS:
PDF EXCEL ONLINE
Oncology Based Molecular Diagnostics Market Size and Share Forecast Outlook 2025 to 2035
Nutritional Bars Market Size and Share Forecast Outlook 2025 to 2035
Oncology Blood Testing Market Size and Share Forecast Outlook 2025 to 2035
Oncology-Based In-vivo CRO Market - Growth & Emerging Trends 2025 to 2035
Oncology Information Systems Market Analysis - Trends & Forecast 2025 to 2035
Nutritional Yeast Market Size, Growth, and Forecast for 2025 to 2035
Nutritional Labelling Market Trends and Forecast 2025 to 2035
Oncology Apoptosis Modulators Market Insights – Forecast 2025 to 2035
The Oncology Adjuvants Market is segmented by Application, Indication and End User from 2025 to 2035
Oncology Imaging Software Market – Growth, Demand & Forecast 2025 to 2035
Nutritional Ingredients in Animal Feed Market Trends - Growth & Industry Forecast 2025 to 2035
Nutritional Lipids Market
Nutrition Therapy Market
Fish Nutrition Market Size, Growth, and Forecast for 2025 to 2035
GLP-1 Nutritional Support Market Analysis - Size, Share, and Forecast Outlook 2025 to 2035
Multi Nutritional Supplement Market Analysis - Size, Share, and Forecast Outlook 2025 to 2035
Immuno Oncology Assay Market Size and Share Forecast Outlook 2025 to 2035
Infant Nutrition Hydrolysate Ingredients Market Size and Share Forecast Outlook 2025 to 2035
Sports Nutrition Ingredients Market Size and Share Forecast Outlook 2025 to 2035
Animal Nutrition Chemicals Market Analysis - Size, Share, and Forecast Outlook 2025 to 2035

Thank you!
You will receive an email from our Business Development Manager. Please be sure to check your SPAM/JUNK folder too.
Chat With
MaRIA