C-Beauty Product Market Size, Share, and Forecast Outlook 2025 to 2035

The global C-beauty product market is projected to expand from USD 18.7 billion in 2025 to approximately USD 49.2 billion by 2035, registering a CAGR of 10.2% during the forecast period. Sales in 2024 were estimated at USD 16.9 billion.
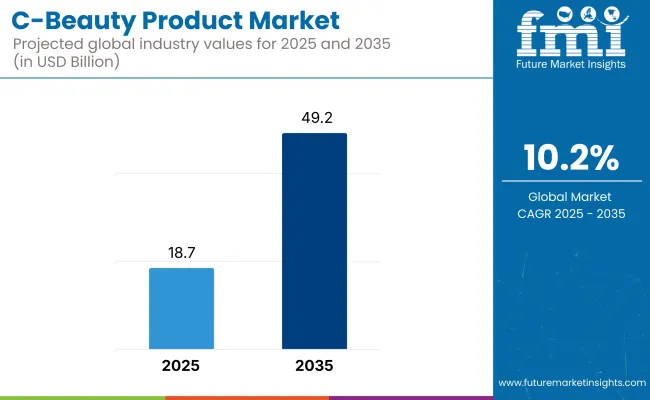
Quick Stats of Global C- Beauty Product Market

  • Market Value (2025): USD 18.7 billion
  • Forecast Value (2035): USD 49.2 billion
  • CAGR: 10.2%
  • Product Leader in 2025: Skincare (42.5% market share)
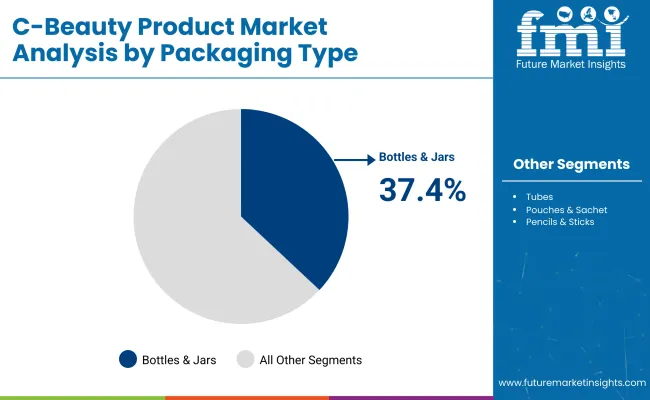
  • Top Packaging Type: Bottles & Jars (37.4% share)
  • Key Growth Country: East Asia (China is the fastest-growing market with 15.6% CAGR)

C Beauty Product Market

Emerging trends include increased preference for personalized and functional formulations, the adoption of scene-based skincare routines, and the integration of advanced technologies in retail formats. Demand is also rising for beauty devices and men’s grooming products, influenced by evolving consumer behavior and market restructuring.

The global C-beauty product market holds 20% of the global beauty and personal care market, driven by rising consumer interest in Chinese skincare, herbal ingredients, and affordability. It accounts for nearly 15% of the global cosmetics and toiletries market, supported by the export of makeup, facial care, and cleansing products.

The market contributes around 8% to the global consumer goods market, reflecting its retail presence across e-commerce and offline channels. It makes up 10% of the global health and wellness market, as brands introduce functional beauty products with dermatological and traditional Chinese medicine elements. In the global luxury goods market, it holds a 5% share, largely through premium C-beauty brands targeting younger global consumers across Asia, Europe, and North America.

The global C-beauty product market is projected to grow from USD 18.7 billion in 2025 to USD 49.2 billion by 2035, generating an absolute dollar opportunity of USD 30.5 billion over the ten-year period. This market expansion reflects a 2.63 times increase, underpinned by a compound annual growth rate of 10.2%. The growth curve signals rising preference for culturally grounded skincare, clinically supported active ingredients, and ingredient transparency as defining purchasing criteria across regions.

By 2030, the market is projected to reach approximately USD 30.3 billion, capturing about USD 11.6 billion in new market value during the first half of the decade. This accounts for nearly 38% of the total absolute opportunity. The second half is expected to generate USD 18.9 billion, reflecting acceleration in demand due to broader cross-border retail integration and entry of C-beauty brands into mainstream pharmacy, luxury, and specialty distribution formats.

Product innovation has been increasingly aligned with AI-generated diagnostics, precision formulation, and TCM-derived actives. Companies such as Pechoin and Florasis have strengthened brand visibility through vertically integrated digital ecosystems and strategic partnerships with cosmetic OEMs in Japan and France. This market is expected to remain structurally growth-oriented, with performance continuing to be shaped by functionality, authenticity, and region-specific formulation intelligence.

Analyzing Global C-Beauty Product Market by Top Investment Segments

In 2025, facial skincare will command 42.5% of global C-beauty demand, led by cleansing, whitening, and hydration routines. Packaging in bottles and jars will make up 37.4% of unit share. Offline channels will retain 58.6% of revenue, while herbal or TCM-based ingredients will account for 28.5% of all product formulations. Region-specific strategies, ingredient familiarity, and packaging usability will continue to define market preferences.
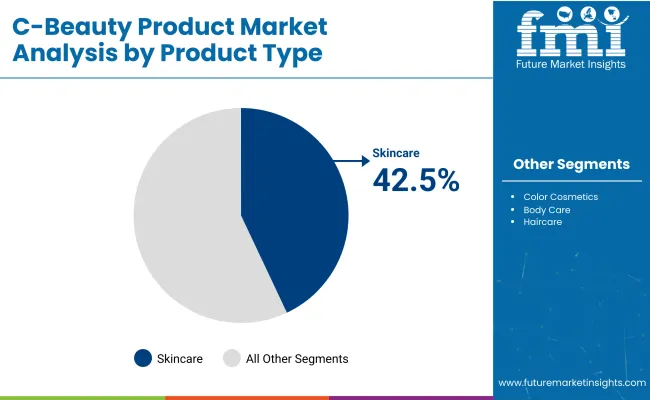
Facial Skincare Continues to Dominate Global C-Beauty by Product Type in 2025

C Beauty Product Market Analysis By Product Type

Facial skincare will contribute 42.5% of global C-beauty revenue in 2025, driven by routine-based consumption of cleansers, toners, serums, and creams. The category benefits from consistent daily use and layering practices that increase product volume sold per user. Pechoin has expanded its whitening and spot-correction lines in Eastern Europe and Southeast Asia. Chando promotes glacier cream routines across South Korea and Central Asia, while Biohyalux is scaling up serum kits for the Middle East and Australia.
  • Pechoin’s facial cream kits captured 46% category share in its overseas e-commerce portfolio in Q1 2025
  • Chando’s glacier cream reached 28% penetration in South Korea’s duty-free retail skincare category
  • Biohyalux reported 3x YoY sales growth for HA-based serum kits in Australia’s pharmacy channel

Bottles and Jars Retain Global Preference by 37.4% Market Share in 2025

C Beauty Product Market Analysis By Packaging Type

Bottles and jars are expected to account for 37.4% of global packaging in 2025, as consumers prioritize hygiene, product preservation, and aesthetic appeal. Serum bottles with controlled dispensing and cream jars for nighttime use are most popular. Pechoin’s double-layer cream jars are being rolled out in Japan. One Leaf’s pipette bottles have received traction in Eastern Europe, while Herborist’s ginseng cream jars have seen demand in the Middle East’s premium category.

  • Pechoin launched dual-layered cream jars in Japan with refillable core packaging in early 2025
  • One Leaf secured 21% market share in pipette-format facial serum category in Poland’s beauty sector
  • Herborist’s jar-based herbal creams made up 19% of skincare SKUs sold via Middle Eastern distributors

Offline Channels Retain Majority Share by 58.6% Globally in 2025

Offline channels will account for 58.6% of total sales globally, driven by in-store trial preference, cultural trust factors, and beauty advisor-led purchases. Brick-and-mortar expansion across Southeast Asia, Latin America, and Eastern Europe supports awareness of lesser-known Chinese brands. Watsons, Sephora, and independent beauty stores continue to feature C-beauty pop-ups and demos to increase trial rates. Judydoll and Florasis are securing counter space across high-footfall locations in major metro areas.

  • Judydoll opened over 150 retail counters across Malaysia, Russia, and Chile by Q2 2025
  • Florasis secured placement in 210 Sephora outlets globally, supported by offline promotions and advisors
  • Pechoin's branded pop-ups in South Korean malls generated 48% conversion to full-size purchases

Herbal and TCM-Based Products Maintain 28.5% Share Globally in 2025

Traditional Chinese ingredients will make up 28.5% of C-beauty product use globally in 2025. The demand is supported by consumer belief in plant-based, balanced skincare. Ingredients like ginseng, licorice root, peony, and angelica are featured prominently. Herborist’s modernized apothecary branding targets premium segments in France and Saudi Arabia. Yunnan Baiyao leverages medical-trust positioning in Thailand and Eastern Europe. Pechoin maintains mid-tier price points for its herbal whitening series across multilingual markets.

  • Herborist’s herbal night creams reached 24% share in France’s niche premium botanical skincare channel
  • Yunnan Baiyao’s TCM-based facial creams posted 32% YoY growth in medical-cosmetic hybrids in Thailand
  • Pechoin expanded its halal-compliant herbal whitening line to Indonesia, UAE, and Pakistan by mid-2025

Top Dynamics in the Global C Beauty Product Market

Global Cbeauty product exports grew by 18% in 2024, with total sales surpassing USD 8 billion. Skincare accounted for 55% of the market, followed by color cosmetics at 30%. Consumers aged 18-24 represented 42% of total buyers. Urban tier 2 cities saw above-average adoption. Lip tints, sheet masks, and glow serums contributed to 1.7× annualized inventory turnover across online and offline retail networks.

ECommerce Optimization and Influencer Algorithm Effect

More than 50% of Cbeauty revenues in 2024 were generated through digital flash sales and short-form video campaigns. Platforms with interactive shopping features enabled a 22% increase in basket size. Cross-border logistics centered in Malaysia and Singapore reduced average delivery time within Southeast Asia to 3.5 days.

Fulfillment infrastructure was optimized to support more than 70% of international shipments without local inventory stocking. Engagement through gamified livestreaming reached 4%, raising conversion rates in products priced below USD 10.

Certification Gaps and Repeat Purchase Weaknesses

Refund rates reached 4% in regions where certification or language labeling was unclear. Repeat purchases remained below 18% in North America and Europe compared to 35% in Southeast Asia. Delays of 6 to 8 weeks were recorded in markets requiring dermatological or halal certification. Abandonment during checkout occurred in 28% of overseas carts when label credibility was questioned. Visual homogeneity across brands led to brand fatigue and decreased recognition in crowded pricing bands.

Region-Smart Product Bundles and Seasonal Launches

In Southeast Asia, bundle sets including sheet masks and primers lifted conversion rates by 15%. Product launches aligned with regional festivals generated 28% higher uptake in Brazil and India. Entry-level kits under USD 12 contributed 45% of new user acquisition volume. Seasonal kits promoting anti-dullness or pollution defense achieved 32% growth in cities across Latin America. Repeat purchases rose by 11% in African and Southeast Asian markets through deeper shade range options and region-specific packaging.

Minimalist Visuals, Ingredient Clarity and Tech-Led Personalization

Minimalist labeling and visible ingredient highlights appeared on 65% of fast-selling SKUs. Products with single-ingredient claims made up 70% of new launches targeting wellness buyers. AI-powered skin diagnostics improved conversion by 23% when embedded in shopping apps. Shade-match tools boosted session durations by 40% among first-time users. Refill options were adopted in 18% of units sold in urban regions. Listings optimized for voice search improved visibility by 12% on global marketplaces.
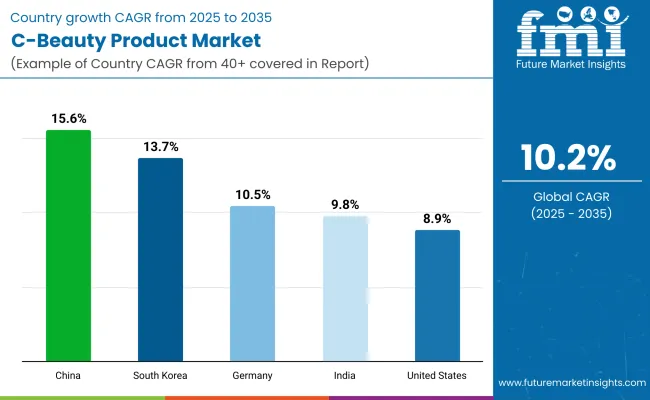
Top Countries Advancing, Powering, and Accelerating Global C-Beauty Product Market Growth

Country Wise Analysis Of C Beauty Product Market

The global C-beauty product market is forecast to grow at a CAGR of 10.2% between 2025 and 2035. China leads at 15.6%, outperforming the global benchmark by 5.4 percentage points, supported by domestic brand dominance, ingredient innovation, and social commerce integration. South Korea follows at 13.7%, 3.5 points above the global average, where cross-border e-commerce and KOL-driven marketing enhance the visibility of Chinese-origin formulations.

Germany (OECD) posts 10.5%, slightly exceeding the global rate due to rising consumer trust in Made-in-China skincare and minimalist product lines. India registers 9.8%, just under the global average, where digital-first consumers are showing interest in Chinese derma-grade cosmetics and hybrid skincare.

The United States (OECD) trails at 8.9%, underperforming by 1.3 points, with distribution barriers and brand perception challenges slowing growth. ASEAN countries are recording high double-digit growth, particularly Thailand and Indonesia, where influencer marketing and competitive pricing are accelerating demand for C-beauty products.

The report covers detailed analysis of 40+ countries, with the top five countries shared as a reference.

Outlook for C-Beauty Product Market Expansion in China

The C-beauty product market in China is forecast to grow at 15.6% CAGR from 2025 to 2035. This expansion has been attributed to the accelerated adoption of localized branding, traditional herbal formulations, and livestreaming commerce. Consumer preference in tier 2 and tier 3 cities has shifted toward domestic beauty labels promoting ingredients such as ginseng, angelica, and snow lotus.

Digital marketing tactics have been refined by companies like Perfect Diary and Florasis, which have embedded national pride into product messaging. Regional logistics infrastructure has supported wider distribution beyond coastal regions. The surge in male grooming consumption and targeted KOL promotions through Douyin and Little Red Book has further expanded visibility across demographic clusters.

  • Over 70% of Florasis revenue in 2025 is projected to be generated through Douyin-exclusive flash campaigns
  • Perfect Diary is estimated to hold 9.6% of the Chinese online color cosmetics segment by end-2025
  • Use of herbal actives in skincare grew by 31.2% YoY, driven by demand for TCM-based moisturizers

Consumer Trends Driving C-Beauty Market Growth in South Korea

South Koreas C-beauty product market is expected to register 13.7% CAGR through 2035, supported by its strategic shift toward domestic sourcing and minimalist skincare. Demand for Chinese-origin beauty goods has risen across the younger cohort as alternatives to J-beauty and K-beauty labels.

Products with clean labeling, simplified routines, and fewer-step applications have been imported via e-commerce platforms like Coupang and Naver Smart Store. Authenticity and ingredient traceability have influenced cross-border C-beauty sales. Strategic collaborations with Korean influencers by brands such as Judydoll and Colorkey have expanded C-beauty shelf presence across specialty retailers.

  • Colorkey saw a 62.5% increase in monthly sales from Naver Smart Store after Q1 2025 rebranding push
  • Judydoll partnered with 9 Korean influencers to launch a two-week color cosmetics trial campaign in Busan
  • 76% of Korean consumers in 2025 expressed preference for simplified Chinese skincare with 3 or fewer steps

Demand Forecast for C-Beauty Products in Germany

The demand in Germany is projected to experience 10.5% CAGR in the C-beauty product market between 2025 and 2035. German consumers have shown growing interest in niche beauty products that incorporate natural Chinese ingredients and cruelty-free certification.

C-beauty offerings have been distributed through dm-drogerie markt and Flaconi, where products have been marketed for anti-aging and skin-brightening benefits. Preference has shifted toward toners and serums with botanical actives such as tremella extract and centella asiatica. Product discovery through TikTok and Instagram reels has been driven by Gen Z consumers, while cross-border packaging has been optimized to meet EU labeling compliance.

  • Herborist sales in Germany increased 41.8% YoY following its collaboration with Flaconi in 2025
  • German TikTok beauty content mentioning Chinese beauty doubled between Q2 2024 and Q2 2025
  • 72.4% of C-beauty imports into Germany were skin-repair focused formulations containing tremella and licorice root

Analysis of C-Beauty Consumer Preferences in India

The Industry in India is expected to witness 9.8% CAGR in the C-beauty product market from 2025 to 2035. The shift in product adoption has been influenced by changing skincare routines among middle-income urban youth.

Platforms such as Nykaa and Tira have introduced C-beauty brands with affordable positioning, strong visual branding, and KOL endorsements. Moisturizers, cleansers, and sheet masks have remained high-frequency categories, particularly among university-age consumers. The demand for animal-testing-free and paraben-free claims has shaped product curation. Indian skin tone compatibility and humidity resistance have been addressed by Chinese brands expanding through regional fulfillment hubs.

  • Chinese skincare kits accounted for 8.3% of Nykaa festival season skincare sales in 2025
  • Yes IC launched a monsoon skin campaign in Pune and Hyderabad, generating a 39% spike in inquiries
  • Little Ondine increased market reach through Tira with focus on waterproof eye cosmetics and vegan formulations

C-Beauty Market Growth Patterns in The United States

The C-Beauty MarketinUnited States is projected to record 8.9% CAGR in the C-beauty market between 2025 and 2035. Growth has been propelled by ethnic beauty segments and microinfluencer-led branding. American retailers including Ulta and iHerb have stocked C-beauty SKUs under clean beauty and skin barrier repair categories.

Content syndication through YouTube reviews and Reddit skincare forums has introduced brands like Winona and Biohyalux to audiences interested in Asian skincare innovations. Consumers have shown strong preference for minimalist packaging and function-first messaging. Derm-approved products with niacinamide, ceramide, and hyaluronic acid have entered the market targeting skin sensitivity and hormonal acne.
  • Winona skincare line experienced 46.2% QoQ growth on iHerb in Q2 2025 targeting sensitive skin niches
  • 43.5% of Ulta customers in California purchased Chinese-made skincare products with vegan or EWG-certified labels
  • Search volume for C-beauty on Reddit increased by 88% YoY, with acne and rosacea threads driving visibility

Leading C-Beauty Product Manufacturers, Suppliers, Distributors

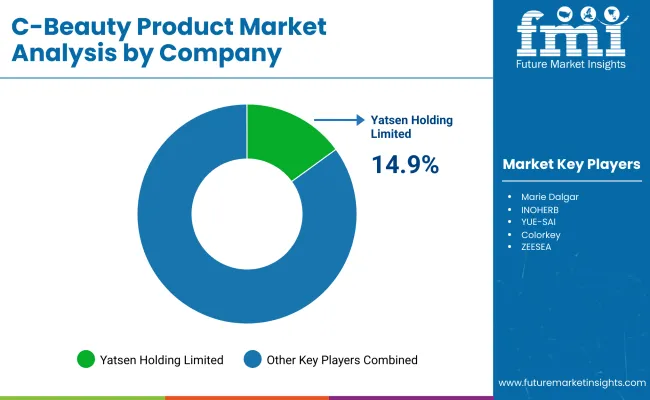
C Beauty Product Market By Company

The global market features a mix of dominant brands and rising labels. Yatsen Holding has expanded Perfect Diary’s portfolio through influencer collaborations and livestream selling. Proya Cosmetics has invested in dermatological R&D, focusing on sensitive skin formulations. Winona and INOHERB continue to develop TCM-based skincare, targeting regional preferences.

Herborist and Chando maintain a presence through department store partnerships and regional campaigns. Emerging players like Colorkey and ZEESEA use vibrant packaging and short video marketing, while Maogeping Beauty emphasizes premium makeup artistry. Catkin and Focallure focus on online-first strategies, offering affordable SKUs. Product differentiation and regional marketing define current expansion efforts.

Entry into the global market is challenged by brand saturation, intellectual property risks, and regional regulation disparities. Consumer loyalty in established markets limits the visibility of new entrants, while fragmented retail distribution adds logistical complexity. Language-specific marketing and evolving product standards also raise operational costs for smaller players.

Recent Industry News

  • In 2023, Chinese cosmetics exports surged: Guangzhou Customs reported crossborder shipments to RCEP markets rose over 70%, with Chinese brands growing 205%.

Leading Players

  • Yatsen Holding Limited
  • Proya Cosmetics Co., Ltd
  • Chando Group
  • Winona
  • Herborist (Shanghai Jahwa)
  • Marie Dalgar
  • INOHERB
  • YUE-SAI
  • Colorkey
  • ZEESEA
  • Venus Skin
  • Maogeping Beauty
  • Focallure
  • Catkin

Report Scope

Report Attributes Details
Market Size (2025) USD 18.7 billion
Projected Market Size (2035) USD 49.2 billion
CAGR (2025 to 2035) 10.2%
Base Year for Estimation 2024
Historical Period 2020 to 2024
Projections Period 2025 to 2035
Quantitative Units USD billion for value and units for volume
Product Types Analyzed (Segment 1) Facial Skincare (Moisturizers, Cleansers, Face Masks, Serums & Essences, Toners), Color Cosmetics (Lipsticks, Foundations, Eye Makeup, Blushers), Body Care (Lotions, Washes, Scrubs), Haircare (Shampoo, Masks, Scalp Treatments), Fragrances (EDT, EDP, Mists), Men’s Grooming (Face Wash, Beard Oils, Multi-use Skincare)
Packaging Types Analyzed (Segment 2) Bottles & Jars, Tubes, Pouches & Sachets, Pencils & Sticks, Others (Pump Dispensers, Spray Bottles, Compacts, Roll-ons) segmented by volume (ml/g) range
Sales Channels (Segment 3) Online Channels (E-Commerce, Brand Websites), Offline Channels (Department Stores, Drugstores, Beauty Specialty Stores, Hypermarkets, Pop-up Stores)
Ingredient Types (Segment 4) Herbal/TCM, Plant-Based Extracts, Synthetic Actives, Functional Ingredients (HA, Peptides, Retinol), Fermented Ingredients, Marine-based Ingredients
Regions Covered North America, Latin America, Europe, East Asia, South Asia, Oceania, Middle East & Africa
Countries Covered China, Japan, South Korea, United States, Canada, Germany, United Kingdom, France, India, Indonesia, Vietnam, Australia, UAE, Brazil, South Africa
Key Players Influencing the Market Yatsen Holding Limited, Proya Cosmetics Co., Ltd, Chando Group, Winona, Herborist (Shanghai Jahwa), Marie Dalgar, INOHERB, YUE-SAI, Colorkey, ZEESEA, Venus Skin, Maogeping Beauty, Focallure, Catkin
Additional Attributes Dollar sales by product type (skincare, color cosmetics, hair care) and application (dermacosmetics, clean beauty, halal/affordable luxury), demand driven by Gen Z social commerce and influencer-led e commerce, regional trends led by Asia Pacific with North America catching up, innovation in ingredient-driven clean formulations, halal-certified lines, sustainable packaging and expanded global footprint.

Key Segments

By Product Type:

  • Facial Skincare
    • Moisturizers
    • Cleansers
    • Face Masks
    • Serums & Essences
    • Toners
  • Color Cosmetics
    • Lipstick & Lip Tint
    • Foundations & BB/CC Creams
    • Eye Makeup (Eyeliners, Eyeshadows, Mascaras)
    • Blushers & Highlighters
  • Body Care
    • Lotions & Creams
    • Body Washes
    • Body Scrubs
  • Haircare
    • Shampoo & Conditioner
    • Hair Masks & Oils
    • Scalp Treatments
  • Fragrances
    • Eau de Toilette
    • Eau de Parfum
    • Rollerballs & Mists
  • Men’s Grooming
    • Face Wash & Toners
    • Beard Oils & Creams
    • Multi-functional Skincare

By Packaging Type:

  • Bottles & Jars
    • Below 100 ml / g
    • 100-500 ml / g
    • 501-1000 ml / g
    • Above 1000 ml / g
  • Tubes
    • Below 30 ml / g
    • 30-75 ml / g
    • 76-150 ml / g
    • Above 150 ml / g
  • Pouches & Sachets
    • Below 5 ml / g
    • 5-15 ml / g
    • 16-30 ml / g
    • Above 30 ml / g
  • Pencils & Sticks
    • Below 2 g
    • 2-5 g
    • 6-15 g
    • Above 15 g
  • Others (Pump Dispensers, Spray Bottles, Compacts, Roll-ons)

By Sales Channel:

  • Online Channels
    • E-Commerce Website
    • Brand Website
  • Offline Channels
    • Department Stores
    • Drugstores / Pharmacies
    • Beauty Specialty Stores
    • Hypermarkets
    • Pop-up Stores

By Ingredient Type:

  • Herbal / TCM
  • Plant-Based Extracts
  • Synthetic Actives
  • Functional Ingredients (Peptides, HA, Retinol, etc.)
  • Fermented Ingredients
  • Marine-based Ingredients

By Region:

  • North America
  • Latin America
  • Europe
  • East Asia
  • South Asia
  • Oceania
  • Middle East & Africa

Table of Content

  1. Executive Summary
    • Global Market Outlook
    • Demand-side Trends
    • Supply-side Trends
    • Technology Roadmap Analysis
    • Analysis and Recommendations
  2. Market Overview
    • Market Coverage / Taxonomy
    • Market Definition / Scope / Limitations
  3. Market Background
    • Market Dynamics
      • Drivers
      • Restraints
      • Opportunity
      • Trends
    • Scenario Forecast
      • Demand in Optimistic Scenario
      • Demand in Likely Scenario
      • Demand in Conservative Scenario
    • Opportunity Map Analysis
    • Product Life Cycle Analysis
    • Supply Chain Analysis
      • Supply Side Participants and their Roles
        • Producers
        • Mid-Level Participants (Traders/ Agents/ Brokers)
        • Wholesalers and Distributors
      • Value Added and Value Created at Node in the Supply Chain
      • List of Raw Material Suppliers
      • List of Existing and Potential Buyer’s
    • Investment Feasibility Matrix
    • Value Chain Analysis
      • Profit Margin Analysis
      • Wholesalers and Distributors
      • Retailers
    • PESTLE and Porter’s Analysis
    • Regulatory Landscape
      • By Key Regions
      • By Key Countries
    • Regional Parent Market Outlook
    • Production and Consumption Statistics
    • Import and Export Statistics
  4. Global Market Analysis 2020 to 2024 and Forecast, 2025 to 2035
    • Historical Market Size Value (USD Billion) & Volume (K Units) Analysis, 2020 to 2024
    • Current and Future Market Size Value (USD Billion) & Volume (K Units) Projections, 2025 to 2035
      • Y-o-Y Growth Trend Analysis
      • Absolute $ Opportunity Analysis
  5. Global Market Pricing Analysis 2020 to 2024 and Forecast 2025 to 2035
  6. Global Market Analysis 2020 to 2024 and Forecast 2025 to 2035, By Product Type
    • Introduction / Key Findings
    • Historical Market Size Value (USD Billion) & Volume (K Units) Analysis By Product Type, 2020 to 2024
    • Current and Future Market Size Value (USD Billion) & Volume (K Units) Analysis and Forecast By Product Type, 2025 to 2035
      • Facial Skincare
        • Moisturizers
        • Cleansers
        • Face Masks
        • Serums & Essences
        • Toners
      • Color Cosmetics
        • Lipstick & Lip Tint
        • Foundations & BB/CC Creams
        • Eye Makeup (Eyeliners, Eyeshadows, Mascaras)
        • Blushers & Highlighters
      • Body Care
        • Lotions & Creams
        • Body Washes
        • Body Scrubs
      • Haircare
        • Shampoo & Conditioner
        • Hair Masks & Oils
        • Scalp Treatments
      • Fragrances
        • Eau de Toilette
        • Eau de Parfum
        • Rollerballs & Mists
      • Men’s Grooming
        • Face Wash & Toners
        • Beard Oils & Creams
        • Multi-functional Skincare
    • Y-o-Y Growth Trend Analysis By Product Type, 2020 to 2024
    • Absolute $ Opportunity Analysis By Product Type, 2025 to 2035
  7. Global Market Analysis 2020 to 2024 and Forecast 2025 to 2035, By Packaging Type
    • Introduction / Key Findings
    • Historical Market Size Value (USD Billion) & Volume (K Units) Analysis By Packaging Type, 2020 to 2024
    • Current and Future Market Size Value (USD Billion) & Volume (K Units) Analysis and Forecast By Packaging Type, 2025 to 2035
      • Bottles & Jars
        • Below 100 ml / g
        • 100-500 ml / g
        • 501-1000 ml / g
        • Above 1000 ml / g
      • Tubes
        • Below 30 ml / g
        • 30-75 ml / g
        • 76-150 ml / g
        • Above 150 ml / g
      • Pouches & Sachets
        • Below 5 ml / g
        • 5-15 ml / g
        • 16-30 ml / g
        • Above 30 ml / g
      • Pencils & Sticks
        • Below 2 g
        • 2-5 g
        • 6-15 g
        • Above 15 g
      • Others (Pump Dispensers, Spray Bottles, Compacts, Roll-ons)
    • Y-o-Y Growth Trend Analysis By Packaging Type, 2020 to 2024
    • Absolute $ Opportunity Analysis By Packaging Type, 2025 to 2035
  8. Global Market Analysis 2020 to 2024 and Forecast 2025 to 2035, By Sales Channel
    • Introduction / Key Findings
    • Historical Market Size Value (USD Billion) & Volume (K Units) Analysis By Sales Channel, 2020 to 2024
    • Current and Future Market Size Value (USD Billion) & Volume (K Units) Analysis and Forecast By Sales Channel, 2025 to 2035
      • Online Channels
        • E-Commerce Website
        • Brand Website
      • Offline Channels
        • Department Stores
        • Drugstores / Pharmacies
        • Beauty Specialty Stores
        • Hypermarkets
        • Pop-up Stores
    • Y-o-Y Growth Trend Analysis By Sales Channel, 2020 to 2024
    • Absolute $ Opportunity Analysis By Sales Channel, 2025 to 2035
  9. Global Market Analysis 2020 to 2024 and Forecast 2025 to 2035, By Ingredient Type
    • Introduction / Key Findings
    • Historical Market Size Value (USD Billion) & Volume (K Units) Analysis By Ingredient Type, 2020 to 2024
    • Current and Future Market Size Value (USD Billion) & Volume (K Units) Analysis and Forecast By Ingredient Type, 2025 to 2035
      • Herbal / TCM
      • Plant-Based Extracts
      • Synthetic Actives
      • Functional Ingredients (Peptides, HA, Retinol, etc.)
      • Fermented Ingredients
      • Marine-based Ingredients
    • Y-o-Y Growth Trend Analysis By Ingredient Type, 2020 to 2024
    • Absolute $ Opportunity Analysis By Ingredient Type, 2025 to 2035
  10. Global Market Analysis 2020 to 2024 and Forecast 2025 to 2035, By Region
    • Introduction
    • Historical Market Size Value (USD Billion) & Volume (K Units) Analysis By Region, 2020 to 2024
    • Current Market Size Value (USD Billion) & Volume (K Units) Analysis and Forecast By Region, 2025 to 2035
      • North America
      • Latin America
      • Western Europe
      • Eastern Europe
      • East Asia
      • South Asia & Pacific
      • Middle East and Africa
    • Market Attractiveness Analysis By Region
  11. North America Market Analysis 2020 to 2024 and Forecast 2025 to 2035, By Country
    • Historical Market Size Value (USD Billion) & Volume (K Units) Trend Analysis By Market Taxonomy, 2020 to 2024
    • Market Size Value (USD Billion) & Volume (K Units) Forecast By Market Taxonomy, 2025 to 2035
      • By Country
        • USA
        • Canada
        • Mexico
      • By Product Type
      • By Packaging Type
      • By Sales Channel
      • By Ingredient Type
    • Market Attractiveness Analysis
      • By Country
      • By Product Type
      • By Packaging Type
      • By Sales Channel
      • By Ingredient Type
    • Key Takeaways
  12. Latin America Market Analysis 2020 to 2024 and Forecast 2025 to 2035, By Country
    • Historical Market Size Value (USD Billion) & Volume (K Units) Trend Analysis By Market Taxonomy, 2020 to 2024
    • Market Size Value (USD Billion) & Volume (K Units) Forecast By Market Taxonomy, 2025 to 2035
      • By Country
        • Brazil
        • Argentina
        • Rest of LATAM
      • By Product Type
      • By Packaging Type
      • By Sales Channel
      • By Ingredient Type
    • Market Attractiveness Analysis
      • By Country
      • By Product Type
      • By Packaging Type
      • By Sales Channel
      • By Ingredient Type
    • Key Takeaways
  13. Western Europe Market Analysis 2020 to 2024 and Forecast 2025 to 2035, By Country
    • Historical Market Size Value (USD Billion) & Volume (K Units) Trend Analysis By Market Taxonomy, 2020 to 2024
    • Market Size Value (USD Billion) & Volume (K Units) Forecast By Market Taxonomy, 2025 to 2035
      • By Country
        • Germany
        • Italy
        • France
        • UK
        • Spain
        • BENELUX
        • Nordic
        • Rest of W.Europe
      • By Product Type
      • By Packaging Type
      • By Sales Channel
      • By Ingredient Type
    • Market Attractiveness Analysis
      • By Country
      • By Product Type
      • By Packaging Type
      • By Sales Channel
      • By Ingredient Type
    • Key Takeaways
  14. Eastern Europe Market Analysis 2020 to 2024 and Forecast 2025 to 2035, By Country
    • Historical Market Size Value (USD Billion) & Volume (K Units) Trend Analysis By Market Taxonomy, 2020 to 2024
    • Market Size Value (USD Billion) & Volume (K Units) Forecast By Market Taxonomy, 2025 to 2035
      • By Country
        • Russia
        • Hungary
        • Poland
        • Balkan & Baltics
        • Rest of E. Europe
      • By Product Type
      • By Packaging Type
      • By Sales Channel
      • By Ingredient Type
    • Market Attractiveness Analysis
      • By Country
      • By Product Type
      • By Packaging Type
      • By Sales Channel
      • By Ingredient Type
    • Key Takeaways
  15. East Asia Market Analysis 2020 to 2024 and Forecast 2025 to 2035, By Country
    • Historical Market Size Value (USD Billion) & Volume (K Units) Trend Analysis By Market Taxonomy, 2020 to 2024
    • Market Size Value (USD Billion) & Volume (K Units) Forecast By Market Taxonomy, 2025 to 2035
      • By Country
        • China
        • Japan
        • South Korea
      • By Product Type
      • By Packaging Type
      • By Sales Channel
      • By Ingredient Type
    • Market Attractiveness Analysis
      • By Country
      • By Product Type
      • By Packaging Type
      • By Sales Channel
      • By Ingredient Type
    • Key Takeaways
  16. South Asia & Pacific Market Analysis 2020 to 2024 and Forecast 2025 to 2035, By Country
    • Historical Market Size Value (USD Billion) & Volume (K Units) Trend Analysis By Market Taxonomy, 2020 to 2024
    • Market Size Value (USD Billion) & Volume (K Units) Forecast By Market Taxonomy, 2025 to 2035
      • By Country
        • India
        • Australia & New Zealand
        • ASEAN
        • Rest of SAP
      • By Product Type
      • By Packaging Type
      • By Sales Channel
      • By Ingredient Type
    • Market Attractiveness Analysis
      • By Country
      • By Product Type
      • By Packaging Type
      • By Sales Channel
      • By Ingredient Type
    • Key Takeaways
  17. Middle East and Africa Market Analysis 2020 to 2024 and Forecast 2025 to 2035, By Country
    • Historical Market Size Value (USD Billion) & Volume (K Units) Trend Analysis By Market Taxonomy, 2020 to 2024
    • Market Size Value (USD Billion) & Volume (K Units) Forecast By Market Taxonomy, 2025 to 2035
      • By Country
        • GCC Countries
        • Northern Africa
        • South Africa
        • Turkiye
        • Rest of MEA
      • By Product Type
      • By Packaging Type
      • By Sales Channel
      • By Ingredient Type
    • Market Attractiveness Analysis
      • By Country
      • By Product Type
      • By Packaging Type
      • By Sales Channel
      • By Ingredient Type
    • Key Takeaways
  18. Key Countries Market Analysis
    • USA
      • Pricing Analysis
      • Market Share Analysis, 2024
        • By Product Type
        • By Packaging Type
        • By Sales Channel
        • By Ingredient Type
    • Canada
      • Pricing Analysis
      • Market Share Analysis, 2024
        • By Product Type
        • By Packaging Type
        • By Sales Channel
        • By Ingredient Type
    • Brazil
      • Pricing Analysis
      • Market Share Analysis, 2024
        • By Product Type
        • By Packaging Type
        • By Sales Channel
        • By Ingredient Type
    • Mexico
      • Pricing Analysis
      • Market Share Analysis, 2024
        • By Product Type
        • By Packaging Type
        • By Sales Channel
        • By Ingredient Type
    • Argentina
      • Pricing Analysis
      • Market Share Analysis, 2024
        • By Product Type
        • By Packaging Type
        • By Sales Channel
        • By Ingredient Type
  19. Market Structure Analysis
    • Competition Dashboard
    • Competition Benchmarking
    • Market Share Analysis of Top Players
      • By Regional
      • By Product Type
      • By Packaging Type
      • By Sales Channel
      • By Ingredient Type
  20. Competition Analysis
    • Competition Deep Dive
      • Yatsen Holding Limited
        • Overview
        • Product Portfolio
        • Profitability by Market Segments (Product/Age /Sales Channel/Region)
        • Sales Footprint
        • Strategy Overview
          • Marketing Strategy
          • Product Strategy
          • Channel Strategy
      • Proya Cosmetics Co., Ltd
        • Overview
        • Product Portfolio
        • Profitability by Market Segments (Product/Age /Sales Channel/Region)
        • Sales Footprint
        • Strategy Overview
          • Marketing Strategy
          • Product Strategy
          • Channel Strategy
      • Chando Group
        • Overview
        • Product Portfolio
        • Profitability by Market Segments (Product/Age /Sales Channel/Region)
        • Sales Footprint
        • Strategy Overview
          • Marketing Strategy
          • Product Strategy
          • Channel Strategy
      • Winona
        • Overview
        • Product Portfolio
        • Profitability by Market Segments (Product/Age /Sales Channel/Region)
        • Sales Footprint
        • Strategy Overview
          • Marketing Strategy
          • Product Strategy
          • Channel Strategy
      • Herborist (Shanghai Jahwa)
        • Overview
        • Product Portfolio
        • Profitability by Market Segments (Product/Age /Sales Channel/Region)
        • Sales Footprint
        • Strategy Overview
          • Marketing Strategy
          • Product Strategy
          • Channel Strategy
      • Marie Dalgar
        • Overview
        • Product Portfolio
        • Profitability by Market Segments (Product/Age /Sales Channel/Region)
        • Sales Footprint
        • Strategy Overview
          • Marketing Strategy
          • Product Strategy
          • Channel Strategy
      • INOHERB
        • Overview
        • Product Portfolio
        • Profitability by Market Segments (Product/Age /Sales Channel/Region)
        • Sales Footprint
        • Strategy Overview
          • Marketing Strategy
          • Product Strategy
          • Channel Strategy
      • YUE-SAI
        • Overview
        • Product Portfolio
        • Profitability by Market Segments (Product/Age /Sales Channel/Region)
        • Sales Footprint
        • Strategy Overview
          • Marketing Strategy
          • Product Strategy
          • Channel Strategy
      • Colorkey
        • Overview
        • Product Portfolio
        • Profitability by Market Segments (Product/Age /Sales Channel/Region)
        • Sales Footprint
        • Strategy Overview
          • Marketing Strategy
          • Product Strategy
          • Channel Strategy
      • ZEESEA
        • Overview
        • Product Portfolio
        • Profitability by Market Segments (Product/Age /Sales Channel/Region)
        • Sales Footprint
        • Strategy Overview
          • Marketing Strategy
          • Product Strategy
          • Channel Strategy
      • Venus Skin
        • Overview
        • Product Portfolio
        • Profitability by Market Segments (Product/Age /Sales Channel/Region)
        • Sales Footprint
        • Strategy Overview
          • Marketing Strategy
          • Product Strategy
          • Channel Strategy
      • Maogeping Beauty
        • Overview
        • Product Portfolio
        • Profitability by Market Segments (Product/Age /Sales Channel/Region)
        • Sales Footprint
        • Strategy Overview
          • Marketing Strategy
          • Product Strategy
          • Channel Strategy
      • Focallure
        • Overview
        • Product Portfolio
        • Profitability by Market Segments (Product/Age /Sales Channel/Region)
        • Sales Footprint
        • Strategy Overview
          • Marketing Strategy
          • Product Strategy
          • Channel Strategy
      • Catkin
        • Overview
        • Product Portfolio
        • Profitability by Market Segments (Product/Age /Sales Channel/Region)
        • Sales Footprint
        • Strategy Overview
          • Marketing Strategy
          • Product Strategy
          • Channel Strategy
  21. Assumptions & Acronyms Used
  22. Research Methodology

List of Tables

  • Table 1: Global Market Value (USD Billion) Forecast by Region, 2020-2035
  • Table 2: Global Market Volume (Units) Forecast by Region, 2020-2035
  • Table 3: Global Market Value (USD Billion) Forecast by Product Type, 2020-2035
  • Table 4: Global Market Volume (Units) Forecast by Product Type, 2020-2035
  • Table 5: Global Market Value (USD Billion) Forecast by Packaging Type*Pack Sizes, 2020-2035
  • Table 6: Global Market Volume (Units) Forecast by Packaging Type*Pack Sizes, 2020-2035
  • Table 7: Global Market Value (USD Billion) Forecast by Sales Channel, 2020-2035
  • Table 8: Global Market Volume (Units) Forecast by Sales Channel, 2020-2035
  • Table 9: Global Market Value (USD Billion) Forecast by Ingredient Type, 2020-2035
  • Table 10: Global Market Volume (Units) Forecast by Ingredient Type, 2020-2035
  • Table 11: Global Market Value (USD Billion) Forecast by Skin Concern, 2020-2035
  • Table 12: Global Market Volume (Units) Forecast by Skin Concern, 2020-2035
  • Table 13: North America Market Value (USD Billion) Forecast by Country, 2020-2035
  • Table 14: North America Market Volume (Units) Forecast by Country, 2020-2035
  • Table 15: North America Market Value (USD Billion) Forecast by Product Type, 2020-2035
  • Table 16: North America Market Volume (Units) Forecast by Product Type, 2020-2035
  • Table 17: North America Market Value (USD Billion) Forecast by Packaging Type*Pack Sizes, 2020-2035
  • Table 18: North America Market Volume (Units) Forecast by Packaging Type*Pack Sizes, 2020-2035
  • Table 19: North America Market Value (USD Billion) Forecast by Sales Channel, 2020-2035
  • Table 20: North America Market Volume (Units) Forecast by Sales Channel, 2020-2035
  • Table 21: North America Market Value (USD Billion) Forecast by Ingredient Type, 2020-2035
  • Table 22: North America Market Volume (Units) Forecast by Ingredient Type, 2020-2035
  • Table 23: North America Market Value (USD Billion) Forecast by Skin Concern, 2020-2035
  • Table 24: North America Market Volume (Units) Forecast by Skin Concern, 2020-2035
  • Table 25: Latin America Market Value (USD Billion) Forecast by Country, 2020-2035
  • Table 26: Latin America Market Volume (Units) Forecast by Country, 2020-2035
  • Table 27: Latin America Market Value (USD Billion) Forecast by Product Type, 2020-2035
  • Table 28: Latin America Market Volume (Units) Forecast by Product Type, 2020-2035
  • Table 29: Latin America Market Value (USD Billion) Forecast by Packaging Type*Pack Sizes, 2020-2035
  • Table 30: Latin America Market Volume (Units) Forecast by Packaging Type*Pack Sizes, 2020-2035
  • Table 31: Latin America Market Value (USD Billion) Forecast by Sales Channel, 2020-2035
  • Table 32: Latin America Market Volume (Units) Forecast by Sales Channel, 2020-2035
  • Table 33: Latin America Market Value (USD Billion) Forecast by Ingredient Type, 2020-2035
  • Table 34: Latin America Market Volume (Units) Forecast by Ingredient Type, 2020-2035
  • Table 35: Latin America Market Value (USD Billion) Forecast by Skin Concern, 2020-2035
  • Table 36: Latin America Market Volume (Units) Forecast by Skin Concern, 2020-2035
  • Table 37: Europe Market Value (USD Billion) Forecast by Country, 2020-2035
  • Table 38: Europe Market Volume (Units) Forecast by Country, 2020-2035
  • Table 39: Europe Market Value (USD Billion) Forecast by Product Type, 2020-2035
  • Table 40: Europe Market Volume (Units) Forecast by Product Type, 2020-2035
  • Table 41: Europe Market Value (USD Billion) Forecast by Packaging Type*Pack Sizes, 2020-2035
  • Table 42: Europe Market Volume (Units) Forecast by Packaging Type*Pack Sizes, 2020-2035
  • Table 43: Europe Market Value (USD Billion) Forecast by Sales Channel, 2020-2035
  • Table 44: Europe Market Volume (Units) Forecast by Sales Channel, 2020-2035
  • Table 45: Europe Market Value (USD Billion) Forecast by Ingredient Type, 2020-2035
  • Table 46: Europe Market Volume (Units) Forecast by Ingredient Type, 2020-2035
  • Table 47: Europe Market Value (USD Billion) Forecast by Skin Concern, 2020-2035
  • Table 48: Europe Market Volume (Units) Forecast by Skin Concern, 2020-2035
  • Table 49: East Asia Market Value (USD Billion) Forecast by Country, 2020-2035
  • Table 50: East Asia Market Volume (Units) Forecast by Country, 2020-2035
  • Table 51: East Asia Market Value (USD Billion) Forecast by Product Type, 2020-2035
  • Table 52: East Asia Market Volume (Units) Forecast by Product Type, 2020-2035
  • Table 53: East Asia Market Value (USD Billion) Forecast by Packaging Type*Pack Sizes, 2020-2035
  • Table 54: East Asia Market Volume (Units) Forecast by Packaging Type*Pack Sizes, 2020-2035
  • Table 55: East Asia Market Value (USD Billion) Forecast by Sales Channel, 2020-2035
  • Table 56: East Asia Market Volume (Units) Forecast by Sales Channel, 2020-2035
  • Table 57: East Asia Market Value (USD Billion) Forecast by Ingredient Type, 2020-2035
  • Table 58: East Asia Market Volume (Units) Forecast by Ingredient Type, 2020-2035
  • Table 59: East Asia Market Value (USD Billion) Forecast by Skin Concern, 2020-2035
  • Table 60: East Asia Market Volume (Units) Forecast by Skin Concern, 2020-2035
  • Table 61: South Asia Market Value (USD Billion) Forecast by Country, 2020-2035
  • Table 62: South Asia Market Volume (Units) Forecast by Country, 2020-2035
  • Table 63: South Asia Market Value (USD Billion) Forecast by Product Type, 2020-2035
  • Table 64: South Asia Market Volume (Units) Forecast by Product Type, 2020-2035
  • Table 65: South Asia Market Value (USD Billion) Forecast by Packaging Type*Pack Sizes, 2020-2035
  • Table 66: South Asia Market Volume (Units) Forecast by Packaging Type*Pack Sizes, 2020-2035
  • Table 67: South Asia Market Value (USD Billion) Forecast by Sales Channel, 2020-2035
  • Table 68: South Asia Market Volume (Units) Forecast by Sales Channel, 2020-2035
  • Table 69: South Asia Market Value (USD Billion) Forecast by Ingredient Type, 2020-2035
  • Table 70: South Asia Market Volume (Units) Forecast by Ingredient Type, 2020-2035
  • Table 71: South Asia Market Value (USD Billion) Forecast by Skin Concern, 2020-2035
  • Table 72: South Asia Market Volume (Units) Forecast by Skin Concern, 2020-2035
  • Table 73: Oceania Market Value (USD Billion) Forecast by Country, 2020-2035
  • Table 74: Oceania Market Volume (Units) Forecast by Country, 2020-2035
  • Table 75: Oceania Market Value (USD Billion) Forecast by Product Type, 2020-2035
  • Table 76: Oceania Market Volume (Units) Forecast by Product Type, 2020-2035
  • Table 77: Oceania Market Value (USD Billion) Forecast by Packaging Type*Pack Sizes, 2020-2035
  • Table 78: Oceania Market Volume (Units) Forecast by Packaging Type*Pack Sizes, 2020-2035
  • Table 79: Oceania Market Value (USD Billion) Forecast by Sales Channel, 2020-2035
  • Table 80: Oceania Market Volume (Units) Forecast by Sales Channel, 2020-2035
  • Table 81: Oceania Market Value (USD Billion) Forecast by Ingredient Type, 2020-2035
  • Table 82: Oceania Market Volume (Units) Forecast by Ingredient Type, 2020-2035
  • Table 83: Oceania Market Value (USD Billion) Forecast by Skin Concern, 2020-2035
  • Table 84: Oceania Market Volume (Units) Forecast by Skin Concern, 2020-2035
  • Table 85: MEA Market Value (USD Billion) Forecast by Country, 2020-2035
  • Table 86: MEA Market Volume (Units) Forecast by Country, 2020-2035
  • Table 87: MEA Market Value (USD Billion) Forecast by Product Type, 2020-2035
  • Table 88: MEA Market Volume (Units) Forecast by Product Type, 2020-2035
  • Table 89: MEA Market Value (USD Billion) Forecast by Packaging Type*Pack Sizes, 2020-2035
  • Table 90: MEA Market Volume (Units) Forecast by Packaging Type*Pack Sizes, 2020-2035
  • Table 91: MEA Market Value (USD Billion) Forecast by Sales Channel, 2020-2035
  • Table 92: MEA Market Volume (Units) Forecast by Sales Channel, 2020-2035
  • Table 93: MEA Market Value (USD Billion) Forecast by Ingredient Type, 2020-2035
  • Table 94: MEA Market Volume (Units) Forecast by Ingredient Type, 2020-2035
  • Table 95: MEA Market Value (USD Billion) Forecast by Skin Concern, 2020-2035
  • Table 96: MEA Market Volume (Units) Forecast by Skin Concern, 2020-2035

List of Figures

  • Figure 1: Global Market Volume (Units) Forecast 2020-2035
  • Figure 2: Global Market Pricing Analysis
  • Figure 3: Global Market Value (USD Billion) Forecast 2020-2035
  • Figure 4: Global Market Value Share and BPS Analysis by Product Type, 2025 and 2035
  • Figure 5: Global Market Y-o-Y Growth Comparison by Product Type, 2025-2035
  • Figure 6: Global Market Attractiveness Analysis by Product Type
  • Figure 7: Global Market Value Share and BPS Analysis by Packaging Type*Pack Sizes, 2025 and 2035
  • Figure 8: Global Market Y-o-Y Growth Comparison by Packaging Type*Pack Sizes, 2025-2035
  • Figure 9: Global Market Attractiveness Analysis by Packaging Type*Pack Sizes
  • Figure 10: Global Market Value Share and BPS Analysis by Sales Channel, 2025 and 2035
  • Figure 11: Global Market Y-o-Y Growth Comparison by Sales Channel, 2025-2035
  • Figure 12: Global Market Attractiveness Analysis by Sales Channel
  • Figure 13: Global Market Value Share and BPS Analysis by Ingredient Type, 2025 and 2035
  • Figure 14: Global Market Y-o-Y Growth Comparison by Ingredient Type, 2025-2035
  • Figure 15: Global Market Attractiveness Analysis by Ingredient Type
  • Figure 16: Global Market Value Share and BPS Analysis by Skin Concern, 2025 and 2035
  • Figure 17: Global Market Y-o-Y Growth Comparison by Skin Concern, 2025-2035
  • Figure 18: Global Market Attractiveness Analysis by Skin Concern
  • Figure 19: Global Market Value (USD Billion) Share and BPS Analysis by Region, 2025 and 2035
  • Figure 20: Global Market Y-o-Y Growth Comparison by Region, 2025-2035
  • Figure 21: Global Market Attractiveness Analysis by Region
  • Figure 22: North America Market Incremental $ Opportunity, 2025-2035
  • Figure 23: Latin America Market Incremental $ Opportunity, 2025-2035
  • Figure 24: Europe Market Incremental $ Opportunity, 2025-2035
  • Figure 25: East Asia Market Incremental $ Opportunity, 2025-2035
  • Figure 26: South Asia Market Incremental $ Opportunity, 2025-2035
  • Figure 27: Oceania Market Incremental $ Opportunity, 2025-2035
  • Figure 28: MEA Market Incremental $ Opportunity, 2025-2035
  • Figure 29: North America Market Value Share and BPS Analysis by Country, 2025 and 2035
  • Figure 30: North America Market Value Share and BPS Analysis by Product Type, 2025 and 2035
  • Figure 31: North America Market Y-o-Y Growth Comparison by Product Type, 2025-2035
  • Figure 32: North America Market Attractiveness Analysis by Product Type
  • Figure 33: North America Market Value Share and BPS Analysis by Packaging Type*Pack Sizes, 2025 and 2035
  • Figure 34: North America Market Y-o-Y Growth Comparison by Packaging Type*Pack Sizes, 2025-2035
  • Figure 35: North America Market Attractiveness Analysis by Packaging Type*Pack Sizes
  • Figure 36: North America Market Value Share and BPS Analysis by Sales Channel, 2025 and 2035
  • Figure 37: North America Market Y-o-Y Growth Comparison by Sales Channel, 2025-2035
  • Figure 38: North America Market Attractiveness Analysis by Sales Channel
  • Figure 39: North America Market Value Share and BPS Analysis by Ingredient Type, 2025 and 2035
  • Figure 40: North America Market Y-o-Y Growth Comparison by Ingredient Type, 2025-2035
  • Figure 41: North America Market Attractiveness Analysis by Ingredient Type
  • Figure 42: North America Market Value Share and BPS Analysis by Skin Concern, 2025 and 2035
  • Figure 43: North America Market Y-o-Y Growth Comparison by Skin Concern, 2025-2035
  • Figure 44: North America Market Attractiveness Analysis by Skin Concern
  • Figure 45: Latin America Market Value Share and BPS Analysis by Country, 2025 and 2035
  • Figure 46: Latin America Market Value Share and BPS Analysis by Product Type, 2025 and 2035
  • Figure 47: Latin America Market Y-o-Y Growth Comparison by Product Type, 2025-2035
  • Figure 48: Latin America Market Attractiveness Analysis by Product Type
  • Figure 49: Latin America Market Value Share and BPS Analysis by Packaging Type*Pack Sizes, 2025 and 2035
  • Figure 50: Latin America Market Y-o-Y Growth Comparison by Packaging Type*Pack Sizes, 2025-2035
  • Figure 51: Latin America Market Attractiveness Analysis by Packaging Type*Pack Sizes
  • Figure 52: Latin America Market Value Share and BPS Analysis by Sales Channel, 2025 and 2035
  • Figure 53: Latin America Market Y-o-Y Growth Comparison by Sales Channel, 2025-2035
  • Figure 54: Latin America Market Attractiveness Analysis by Sales Channel
  • Figure 55: Latin America Market Value Share and BPS Analysis by Ingredient Type, 2025 and 2035
  • Figure 56: Latin America Market Y-o-Y Growth Comparison by Ingredient Type, 2025-2035
  • Figure 57: Latin America Market Attractiveness Analysis by Ingredient Type
  • Figure 58: Latin America Market Value Share and BPS Analysis by Skin Concern, 2025 and 2035
  • Figure 59: Latin America Market Y-o-Y Growth Comparison by Skin Concern, 2025-2035
  • Figure 60: Latin America Market Attractiveness Analysis by Skin Concern
  • Figure 61: Europe Market Value Share and BPS Analysis by Country, 2025 and 2035
  • Figure 62: Europe Market Value Share and BPS Analysis by Product Type, 2025 and 2035
  • Figure 63: Europe Market Y-o-Y Growth Comparison by Product Type, 2025-2035
  • Figure 64: Europe Market Attractiveness Analysis by Product Type
  • Figure 65: Europe Market Value Share and BPS Analysis by Packaging Type*Pack Sizes, 2025 and 2035
  • Figure 66: Europe Market Y-o-Y Growth Comparison by Packaging Type*Pack Sizes, 2025-2035
  • Figure 67: Europe Market Attractiveness Analysis by Packaging Type*Pack Sizes
  • Figure 68: Europe Market Value Share and BPS Analysis by Sales Channel, 2025 and 2035
  • Figure 69: Europe Market Y-o-Y Growth Comparison by Sales Channel, 2025-2035
  • Figure 70: Europe Market Attractiveness Analysis by Sales Channel
  • Figure 71: Europe Market Value Share and BPS Analysis by Ingredient Type, 2025 and 2035
  • Figure 72: Europe Market Y-o-Y Growth Comparison by Ingredient Type, 2025-2035
  • Figure 73: Europe Market Attractiveness Analysis by Ingredient Type
  • Figure 74: Europe Market Value Share and BPS Analysis by Skin Concern, 2025 and 2035
  • Figure 75: Europe Market Y-o-Y Growth Comparison by Skin Concern, 2025-2035
  • Figure 76: Europe Market Attractiveness Analysis by Skin Concern
  • Figure 77: East Asia Market Value Share and BPS Analysis by Country, 2025 and 2035
  • Figure 78: East Asia Market Value Share and BPS Analysis by Product Type, 2025 and 2035
  • Figure 79: East Asia Market Y-o-Y Growth Comparison by Product Type, 2025-2035
  • Figure 80: East Asia Market Attractiveness Analysis by Product Type
  • Figure 81: East Asia Market Value Share and BPS Analysis by Packaging Type*Pack Sizes, 2025 and 2035
  • Figure 82: East Asia Market Y-o-Y Growth Comparison by Packaging Type*Pack Sizes, 2025-2035
  • Figure 83: East Asia Market Attractiveness Analysis by Packaging Type*Pack Sizes
  • Figure 84: East Asia Market Value Share and BPS Analysis by Sales Channel, 2025 and 2035
  • Figure 85: East Asia Market Y-o-Y Growth Comparison by Sales Channel, 2025-2035
  • Figure 86: East Asia Market Attractiveness Analysis by Sales Channel
  • Figure 87: East Asia Market Value Share and BPS Analysis by Ingredient Type, 2025 and 2035
  • Figure 88: East Asia Market Y-o-Y Growth Comparison by Ingredient Type, 2025-2035
  • Figure 89: East Asia Market Attractiveness Analysis by Ingredient Type
  • Figure 90: East Asia Market Value Share and BPS Analysis by Skin Concern, 2025 and 2035
  • Figure 91: East Asia Market Y-o-Y Growth Comparison by Skin Concern, 2025-2035
  • Figure 92: East Asia Market Attractiveness Analysis by Skin Concern
  • Figure 93: South Asia Market Value Share and BPS Analysis by Country, 2025 and 2035
  • Figure 94: South Asia Market Value Share and BPS Analysis by Product Type, 2025 and 2035
  • Figure 95: South Asia Market Y-o-Y Growth Comparison by Product Type, 2025-2035
  • Figure 96: South Asia Market Attractiveness Analysis by Product Type
  • Figure 97: South Asia Market Value Share and BPS Analysis by Packaging Type*Pack Sizes, 2025 and 2035
  • Figure 98: South Asia Market Y-o-Y Growth Comparison by Packaging Type*Pack Sizes, 2025-2035
  • Figure 99: South Asia Market Attractiveness Analysis by Packaging Type*Pack Sizes
  • Figure 100: South Asia Market Value Share and BPS Analysis by Sales Channel, 2025 and 2035
  • Figure 101: South Asia Market Y-o-Y Growth Comparison by Sales Channel, 2025-2035
  • Figure 102: South Asia Market Attractiveness Analysis by Sales Channel
  • Figure 103: South Asia Market Value Share and BPS Analysis by Ingredient Type, 2025 and 2035
  • Figure 104: South Asia Market Y-o-Y Growth Comparison by Ingredient Type, 2025-2035
  • Figure 105: South Asia Market Attractiveness Analysis by Ingredient Type
  • Figure 106: South Asia Market Value Share and BPS Analysis by Skin Concern, 2025 and 2035
  • Figure 107: South Asia Market Y-o-Y Growth Comparison by Skin Concern, 2025-2035
  • Figure 108: South Asia Market Attractiveness Analysis by Skin Concern
  • Figure 109: Oceania Market Value Share and BPS Analysis by Country, 2025 and 2035
  • Figure 110: Oceania Market Value Share and BPS Analysis by Product Type, 2025 and 2035
  • Figure 111: Oceania Market Y-o-Y Growth Comparison by Product Type, 2025-2035
  • Figure 112: Oceania Market Attractiveness Analysis by Product Type
  • Figure 113: Oceania Market Value Share and BPS Analysis by Packaging Type*Pack Sizes, 2025 and 2035
  • Figure 114: Oceania Market Y-o-Y Growth Comparison by Packaging Type*Pack Sizes, 2025-2035
  • Figure 115: Oceania Market Attractiveness Analysis by Packaging Type*Pack Sizes
  • Figure 116: Oceania Market Value Share and BPS Analysis by Sales Channel, 2025 and 2035
  • Figure 117: Oceania Market Y-o-Y Growth Comparison by Sales Channel, 2025-2035
  • Figure 118: Oceania Market Attractiveness Analysis by Sales Channel
  • Figure 119: Oceania Market Value Share and BPS Analysis by Ingredient Type, 2025 and 2035
  • Figure 120: Oceania Market Y-o-Y Growth Comparison by Ingredient Type, 2025-2035
  • Figure 121: Oceania Market Attractiveness Analysis by Ingredient Type
  • Figure 122: Oceania Market Value Share and BPS Analysis by Skin Concern, 2025 and 2035
  • Figure 123: Oceania Market Y-o-Y Growth Comparison by Skin Concern, 2025-2035
  • Figure 124: Oceania Market Attractiveness Analysis by Skin Concern
  • Figure 125: MEA Market Value Share and BPS Analysis by Country, 2025 and 2035
  • Figure 126: MEA Market Value Share and BPS Analysis by Product Type, 2025 and 2035
  • Figure 127: MEA Market Y-o-Y Growth Comparison by Product Type, 2025-2035
  • Figure 128: MEA Market Attractiveness Analysis by Product Type
  • Figure 129: MEA Market Value Share and BPS Analysis by Packaging Type*Pack Sizes, 2025 and 2035
  • Figure 130: MEA Market Y-o-Y Growth Comparison by Packaging Type*Pack Sizes, 2025-2035
  • Figure 131: MEA Market Attractiveness Analysis by Packaging Type*Pack Sizes
  • Figure 132: MEA Market Value Share and BPS Analysis by Sales Channel, 2025 and 2035
  • Figure 133: MEA Market Y-o-Y Growth Comparison by Sales Channel, 2025-2035
  • Figure 134: MEA Market Attractiveness Analysis by Sales Channel
  • Figure 135: MEA Market Value Share and BPS Analysis by Ingredient Type, 2025 and 2035
  • Figure 136: MEA Market Y-o-Y Growth Comparison by Ingredient Type, 2025-2035
  • Figure 137: MEA Market Attractiveness Analysis by Ingredient Type
  • Figure 138: MEA Market Value Share and BPS Analysis by Skin Concern, 2025 and 2035
  • Figure 139: MEA Market Y-o-Y Growth Comparison by Skin Concern, 2025-2035
  • Figure 140: MEA Market Attractiveness Analysis by Skin Concern
  • Figure 141: Global Market - Tier Structure Analysis
  • Figure 142: Global Market - Company Share Analysis

Frequently Asked Questions

What is the projected value of the global C-beauty product market by 2035?

The market is projected to reach USD 61.8 billion by 2035, rising from USD 16.5 billion in 2025.

What CAGR is expected for the global C-beauty product market from 2025 to 2035?

A CAGR of 13.9% is expected during the forecast period.

Which product segment will dominate the global market in 2025?

Skincare is expected to lead with a 42.5% share in 2025.

What share of packaging will bottles and jars contribute in 2025?

Bottles and jars are projected to contribute 37.4% of the packaging market in 2025.

Who is a leading player in the global C-beauty product market?

Yatsen Holding, parent of Perfect Diary, leads through cross-border expansion and localized brand collaborations.

Explore Similar Insights

Future Market Insights

C-Beauty Product Market