Cajun Spice Market Size, Share, and Forecast Outlook 2025 to 2035

The global cajun spice market is projected to be valued at USD 638.5 million in 2025 and reach USD 1,001.1 million by 2035, growing at a CAGR of 4.6%. Rising interest in bold, smoky flavors across North America, Europe, and Asia-Pacific contributes to this growth.
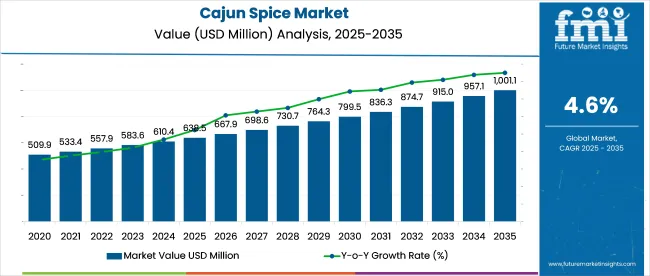
Quick Stats - Cajun Spice Market (2025 to 2035)

  • Market Value (2025): USD 638.5 million
  • Forecast Value (2035): USD 1,001.1 million
  • Forecast CAGR (2025 to 2035): 4.6%
  • Product Leader in 2025: California Cajun Spice (25% market share)
  • Top Distribution Channel: Supermarkets/Hypermarkets
  • Key Growth Region: India (CAGR of 7.8%)
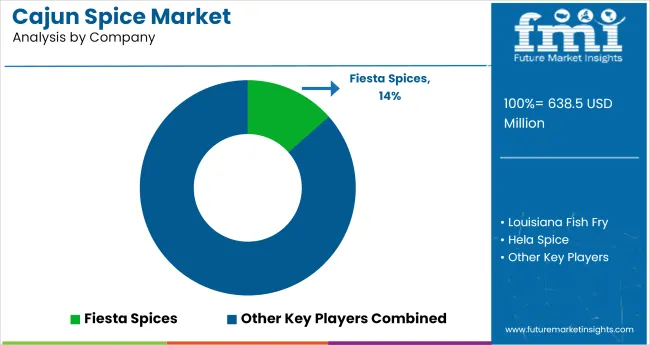
  • Leading Player: Fiesta Spices (13.5% market share)

Cajun Spice Market Market Value Analysis

Attribute Value
Market Size in 2025 USD 638.5 million
Market Size in 2035 USD 1,001.1 million
CAGR (2025 to 2035) 4.6%

Consumers increasingly incorporate Cajun seasoning in meat, seafood, poultry, and vegetable preparations. its expanded use in both household kitchens and commercial foodservice drives market demand. The cleaner ingredient preferences have prompted a shift toward organic and additive-free spice blends.

In 2025, the Cajun spice industry has experienced a flurry of activity driven by product differentiation, AI integration, and targeted acquisitions. Kraft Heinz expanded its global flavor portfolio by launching a Cajun-based sauce line co-created with regional chefs to appeal to diverse markets. Hela Spice implemented AI-powered sensory mapping in its European labs to develop localized Cajun blends tailored to varying palate profiles.

McCormick introduced a hyper-regional Cajun range inspired by southern Louisiana sub-cuisines, incorporating chef-led QR-linked pairings. Pacific Spice pushed fusion boundaries with hybrid Cajun-Thai formats now entering pilot distribution. the Kraft Heinz’s acquisition of Just Spices continues to fuel premium Cajun blend rollouts across e-commerce channels, reshaping category competition through precision flavoring and direct-to-table strategies.

The Cajun spice market draws demand from multiple sectors, each contributing to its overall presence. It accounts for approximately 12-15% of the seasoning and spices market, where it’s valued for its bold, distinctive flavor. In the broader food and beverage industry, Cajun spice blends make up around 6-8%, largely through incorporation in marinades, sauces, and snack seasonings.

The ready-to-eat meals segment uses Cajun profiles in prepared food products, contributing to about 4-6% of that space. In the foodservice channel, particularly in casual and quick-serve formats, it holds a share of 8-10%, often featured in chicken, seafood, and rice dishes. Within the retail packaged food market, Cajun spice represents around 5-7%, supported by growing consumer preference for regional flavor experiences.

Analyzing Cajun Spice Market by Top Investment Segments

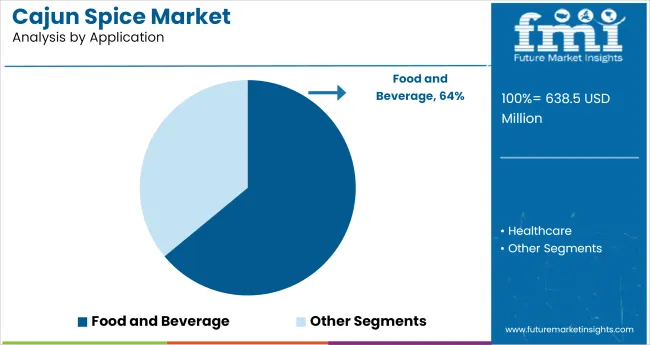
The Cajun spice market is projected to grow steadily through 2025, driven by consumer preferences for bold flavors and meat-based cuisine. California Cajun spice leads the product segment with a 25% share, while Meat & Seafood Seasoning dominates applications with over 64% market share, reflecting strong demand across retail and foodservice sectors.
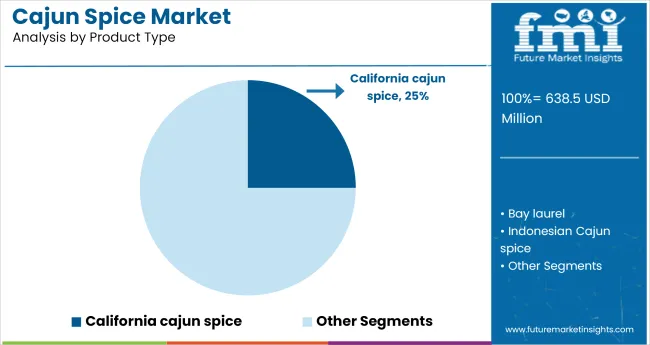
California Cajun Spice Leads Usage with 25% Market Share in 2025

Cajun Spice Market Analysis By Product Type

California Cajun spice accounts for 25% of total product-based consumption, owing to its consistent flavor intensity, scalable blend ratios, and wide acceptance across packaged seasoning lines. Its salt content typically ranges between 14-18%, aligning with dry rub and marination processes for proteins.

Manufacturers such as McCormick & Company, Frontier Co-op, and The Spice Hunter use this variant due to its formulation stability under both dry and oil-based mixing. In seasoning blends, California variants offer high paprika concentration (>22%), which enhances red hue and roasted notes essential for grilled applications. It also supports automation in spice dispensing due to its uniform particle size, typically between 180-250 microns.
  • Offers shelf stability of 18-24 months in moisture-barrier pouches
  • Maintains color integrity when processed under 150°C roasting conditions
  • Suitable for high-throughput packaging lines operating at 40-60 pouches/min

Food and Beverages Command 64% Usage Share in 2025

Cajun Spice Market Analysis By Application

With a 64% application share, food and beverages continue to dominate the Cajun spice market due to its precise flavor delivery and compatibility with wet and dry processing methods. Popular formats include pre-packaged rubs, marinade bases, and injection-ready spice slurries. Industry users such as Tyson Foods, JBS, and Sysco rely on Cajun blends with cayenne content ranging from 5-9% and garlic powder concentrations of 10-12% to balance spiciness and umami. These mixes are optimized for protein retention, yielding moisture loss reductions of 4-7% post-cooking. High solubility levels make them suitable for vacuum tumbling, enhancing flavor penetration during short-cycle processing.

  • Retains flavor during sous-vide cooking up to 85°C for 2-3 hours
  • Allows dose accuracy of 0.8-1.2 grams per 100g meat in automated lines
  • Compatible with frozen, chilled, and fresh meat handling without caking risk

Top Cajun Spice Market Dynamics

The Cajun Spice Market is undergoing a transformation driven by leaner inventory systems, nutritional snack innovation, and export cost challenges. Enhanced stock turnover, functional flavor integration, and freight cost mitigation are reshaping operational models. Despite margin pressures, the sector remains poised for growth through adaptive supply strategies and premium-positioned product development.

Inventory Efficiency Gains Spur Leaner Cajun Spice Supply Chains

Cajun spice distributors and retail partners are streamlining inventory cycles to enhance cash flow and reduce waste. Notably, average warehouse holding periods for seasoning SKUs in Louisiana and Texas dropped from 72 to 48 days in H1 2025, aided by digitized inventory management and time-of-use batch allocation. In parallel, mid-sized manufacturers such as Louisiana Gold Blends and Cajun Select deployed adaptive packaging runs, which enabled a 13% cut in safety stock volumes.

Functional Snacking Segment Fuels Cajun Spice Reformulation

The evolving flavor preferences in functional snacking are steering Cajun spice into new product categories. Clinical trials by the University of Georgia (2024) revealed that Cajun-seasoned chickpea puffs delivered 10g plant protein per 50g serving, while demonstrating a 21% lower sodium load than traditional savory chips. Furthermore, start-ups such as Bayou Bites and Zesty Naturals are using clean-label Cajun blends in gluten-free crackers, which saw a 19% increase in sales across USA specialty chains during Q2 2025.

Rising Input and Freight Costs Challenge Export Margins

Cajun spice exporters are grappling with shrinking profitability due to input inflation and freight volatility. Farm-level paprika and chili prices surged by 11% YoY in April 2025, driven by drought-induced yield drops in key USA growing regions. Meanwhile, ocean freight rates on the Houston-Rotterdam route increased by 8.5%, prompting blended exporters to revise logistics strategies.
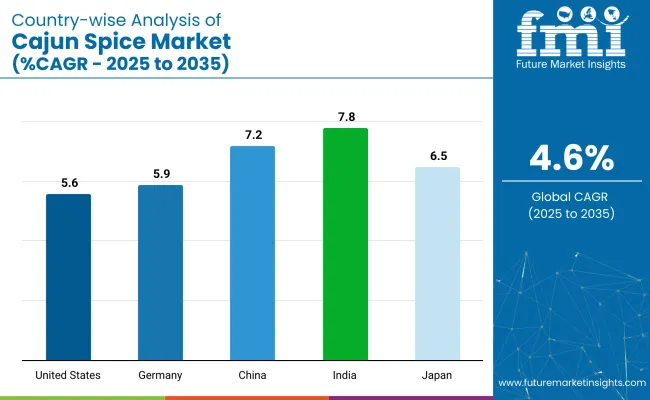
Top Countries Engaged in Producing, Blending, Distributing, and Using Cajun Spice (2025 to 2035)

Cajun Spice Market Country Wise Analysis

Country CAGR, 2025 to 2035
United States 5.6%
Germany 5.9%
China 7.2%
Japan 6.5%
India 7.8%

The industry is forecast to grow at a 4.6% CAGR between 2025 and 2035. Among the five tracked markets, India records the highest rate at 7.8%, followed by China at 7.2%, Japan at 6.5%, Germany at 5.9%, and the United States at 5.6%. These figures reflect a +70% gain for India, +57% for China, +41% for Japan, +28% for Germany, and +22% for the USA, relative to the global average.

Stronger growth in BRICS countries like India and China points to increasing demand for bold flavor profiles and expanding spice usage in packaged food. In comparison, OECD markets such as the USA, Germany, and Japan reflect steady category growth supported by culinary experimentation and broader inclusion of Cajun blends in everyday cooking.

The report covers detailed analysis of 40+ countries, with the top five countries shared as a reference.

Spicy and Smoky Blends Push Cajun Spice Sales in the USA

The USA Cajun spice market is projected to grow at a 5.6% CAGR between 2025 and 2035, fueled by demand for bold, Southern-inspired flavors. Creole seasoning blends are being adopted by both mainstream retailers and niche gourmet brands. Cajun spice is increasingly seen in snack dustings, ready-to-cook meat rubs, and seasoning sachets for home chefs. The post-pandemic rise in home cooking continues to boost the demand for smoky, handcrafted blends. Private labels and e-commerce-focused spice companies are using bold flavor innovations like habanero-paprika or chipotle-thyme mixes to appeal to a wide demographic.

  • 42% of Cajun spice sales were recorded in grilling rubs and marinades for beef and poultry
  • 31% YoY growth in gourmet Cajun spice kits sold via DTC channels like Spiceology and Spicewalla
  • Cajun seasoning appeared in 18% of new savory snack launches in 2025 across national retailers

Clean-Label Cajun Spice Trends Fuel Germany’s Gourmet Segment

The Cajun spice market is expanding at a 5.9% CAGR, supported by premiumization in the seasoning category and increasing consumer interest in fusion cuisine. As grilling and slow-cooking trends gain traction, spice companies are introducing Cajun blends tailored to the German palate - often less salty but deeply aromatic. Organic and non-GMO certifications are major purchase drivers in this market. Major retail players like Alnatura and REWE are increasing their spice blend offerings, with Cajun seasoning becoming a common addition to barbecue-themed products and mixed-grill kits.

  • Cajun spice SKUs with EU organic certification grew 22% YoY in 2025
  • 26% of German spice shelf space now includes globally inspired blends, led by Cajun and Ras el Hanout
  • Gourmet Cajun seasoning imports from France and Belgium rose 19%, showing cross-border influence

China’s Cajun Market Rises with Fusion Street Food and QSR Adoption

China is projected to record the fastest growth in the Cajun spice market, at a 7.2% CAGR from 2025 to 2035. Increased use of Cajun seasoning in fried chicken coatings, spicy skewers, and fast-food sides is accelerating volume growth. Western QSR chains and Chinese snack brands alike have adopted Cajun seasoning as a mainstream flavor profile. Digitally native brands are leveraging livestream e-commerce and social media chefs to showcase easy home recipes. Retailers such as Hema Fresh and Ole’ Supermarket are increasing shelf space for imported and locally blended Cajun mixes.

  • 58% YoY increase in Cajun seasoning use in street-style chicken and squid skewers
  • Over 21 million units of Cajun-coated snacks were sold via Douyin live commerce in 2025
  • 34% of China’s online spice sales growth in 2025 came from American-style seasoning blends

Cajun-Style Fusion Sauces and Seafoods Boost Market in Japan

Japan’s Cajun spice market is growing at a 6.5% CAGR, with the rise of fusion seasonings in miso broths, soy marinades, and grilled seafood products. Cajun blends are often adjusted to meet Japanese preferences - less salt, more umami - and used in high-end seafood rubs and bottled dipping sauces. MSG-free and low-sodium labels help maintain compliance with health-driven purchasing habits. Retailers like Kaldi Coffee Farm and Seijo Ishii stock both domestic and imported Cajun products, and fine-dining restaurants continue to experiment with Cajun-style plating in contemporary dishes.

  • 46% of new Cajun products in 2025 were soy-based sauces or seafood spice rubs
  • Low-sodium Cajun seasonings saw a 28% increase in shelf turnover in gourmet outlets
  • Domestic producers now account for 63% of Japan’s Cajun spice SKUs

India’s Cajun Spice Uptake Soars Through QSRs and Fusion Cuisines

India is expected to post a 7.8% CAGR, the highest among key markets, in Cajun spice demand from 2025 to 2035. The rise of American-style diners, grilled meat chains, and fast-casual QSRs across tier-1 and tier-2 cities has fueled the use of Cajun seasoning in potato wedges, pasta sauces, and barbecue marinades. Local spice giants and gourmet startups are launching their Cajun variants infused with desi notes like curry leaf and black salt to appeal to regional taste buds. Bulk spice packs, chef-recipe kits, and OTT food influencers are further accelerating category growth.
  • 62% of QSR chains in India added Cajun-flavored items to their 2025 menus
  • Domestic spice players launched over 38 Cajun variants, targeting fusion street food vendors
  • Cajun seasoning contributed to 14% of premium spice exports, primarily to the Gulf and EU

Leading Cajun Spice Suppliers Manufacturers, Suppliers, Distributors

Cajun Spice Market Analysis By Company

The industry is becoming increasingly competitive, with players executing niche strategies that move beyond conventional retail tactics. Fiesta Spices has partnered with regional ghost kitchens to co-develop exclusive Cajun seasoning packets for delivery-only menus, capturing urban foodservice micro-channels. Louisiana Fish Fry began sourcing heirloom chili cultivars from independent Mississippi farms, branding them under a new terroir-driven “Delta Heat” line.

Hela Spice, in an unconventional move, integrated AI-driven sensory profiling into its R&D labs in Poland to localize Cajun notes for European palates. Ball’s Cajun Foods deployed solar-assisted dehydration units to preserve spice oils during peak summer processing, improving flavor retention. Pete’s Zizira piloted AR-based storytelling on QR-enabled packs, linking consumers to smallholder spice farmers in real time.

Recent Industry News

  • Hela Spice’s AI-driven palate profiling launched in early 2025 enables rapid regional adaptation of Cajun blends, reducing product development cycles to under three days and aligning flavor intensity with local preferences across Europe.
  • Kraft Heinz’s acquisition of Just Spices in 2023 marked a strategic entry into the custom spice blend space, with Cajun variants prioritized for integration into its direct-to-consumer lineup and chef-collab kits.

Leading Players

  • Fiesta Spices
  • Louisiana Fish Fry
  • Hela Spice
  • Ball's Cajun Foods
  • Pete's Zizira

Report Scope - Cajun Spice Market

Report Attributes Details
Market Size (2025) USD 638.5 million
Projected Market Size (2035) USD 1,001.1 million
CAGR (2025 to 2035) 4.6%
Base Year for Estimation 2024
Historical Data Range 2020 to 2024
Forecast Period 2025 to 2035
Quantitative Units USD million (value)
Product Types Covered California Cajun Spice, Bay Laurel, Indonesian Cajun Spice, Indian Cajun Spice, Indonesian Laurel, West Indian Cajun Spice, Mexican Cajun Spice
Applications Analyzed Food & Beverage Industry, Healthcare Industry
Distribution Channels Supermarkets/Hypermarkets, Specialty Stores, Online Retailers, Foodservice Chains
Regions Covered North America, Latin America, Western Europe, Eastern Europe, East Asia, South Asia & Pacific, Central Asia, Russia & Belarus, Balkan & Baltic Countries, Middle East & Africa
Countries Covered United States, Canada, Mexico, Brazil, Argentina, Chile, Germany, United Kingdom, France, Italy, Spain, Poland, Russia, Ukraine, India, Indonesia, Thailand, Vietnam, China, Japan, South Korea, Australia, New Zealand, Kazakhstan, Uzbekistan, Romania, Bulgaria, Lithuania, Latvia, Estonia, Belarus, United Arab Emirates, Saudi Arabia, South Africa, Nigeria, Egypt
Key Players Fiesta Spices, Louisiana Fish Fry, Hela Spice, Ball's Cajun Foods, Pete's Zizira
Additional Attributes Dollar sales by product type and application; growing demand in quick-service restaurants and home cooking; rising international interest in ethnic and regional cuisines; emerging export opportunities in Southeast Asia and Africa; culinary tourism driving spice innovation

Segmentation of Cajun Spice Market

By Product Type:

The industry includes such as California cajun spice, bay laurel, Indonesian Cajun spice, Indian Cajun spice, Indonesian laurel, West Indian Cajun spice, and Mexican Cajun spice.

By Application:

These products are primarily used in the food and beverage industry and the healthcare industry.

By Region:

The industry is segmented as North America, Latin America, Western Europe, Eastern Europe, East Asia, South Asia & Pacific, Central Asia, Russia and Belarus, Balkan & Baltic Countries, Middle East and Africa

Table of Content

  1. Executive Summary
    • Global Market Outlook
    • Demand-side Trends
    • Supply-side Trends
    • Technology Roadmap Analysis
    • Analysis and Recommendations
  2. Market Overview
    • Market Coverage / Taxonomy
    • Market Definition / Scope / Limitations
  3. Market Background
    • Market Dynamics
      • Drivers
      • Restraints
      • Opportunity
      • Trends
    • Scenario Forecast
      • Demand in Optimistic Scenario
      • Demand in Likely Scenario
      • Demand in Conservative Scenario
    • Opportunity Map Analysis
    • Product Life Cycle Analysis
    • Supply Chain Analysis
      • Supply Side Participants and their Roles
        • Producers
        • Mid-Level Participants (Traders/ Agents/ Brokers)
        • Wholesalers and Distributors
      • Value Added and Value Created at Node in the Supply Chain
      • List of Raw Material Suppliers
      • List of Existing and Potential Buyer’s
    • Investment Feasibility Matrix
    • Value Chain Analysis
      • Profit Margin Analysis
      • Wholesalers and Distributors
      • Retailers
    • PESTLE and Porter’s Analysis
    • Regulatory Landscape
      • By Key Regions
      • By Key Countries
    • Regional Parent Market Outlook
    • Production and Consumption Statistics
    • Import and Export Statistics
  4. Global Market Analysis 2020 to 2024 and Forecast, 2025 to 2035
    • Historical Market Size Value (USD Billion) & Volume (MT) Analysis, 2020 to 2024
    • Current and Future Market Size Value (USD Billion) & Volume (MT) Projections, 2025 to 2035
      • Y-o-Y Growth Trend Analysis
      • Absolute $ Opportunity Analysis
  5. Global Market Pricing Analysis 2020 to 2024 and Forecast 2025 to 2035
  6. Global Market Analysis 2020 to 2024 and Forecast 2025 to 2035, By Product Type
    • Introduction / Key Findings
    • Historical Market Size Value (USD Billion) & Volume (MT) Analysis By Product Type, 2020 to 2024
    • Current and Future Market Size Value (USD Billion) & Volume (MT) Analysis and Forecast By Product Type, 2025 to 2035
      • California Cajun Spice
      • Bay laurel
      • Indonesian Cajun Spice
      • Indian Cajun Spice
      • Indonesian laurel
      • West Indian Cajun Spice
      • Mexican Cajun Spice
    • Y-o-Y Growth Trend Analysis By Product Type, 2020 to 2024
    • Absolute $ Opportunity Analysis By Product Type, 2025 to 2035
  7. Global Market Analysis 2020 to 2024 and Forecast 2025 to 2035, By Application
    • Introduction / Key Findings
    • Historical Market Size Value (USD Billion) & Volume (MT) Analysis By Application, 2020 to 2024
    • Current and Future Market Size Value (USD Billion) & Volume (MT) Analysis and Forecast By Application, 2025 to 2035
      • Food and Beverage Industry
      • Healthcare Industry
    • Y-o-Y Growth Trend Analysis By Application, 2020 to 2024
    • Absolute $ Opportunity Analysis By Application, 2025 to 2035
  8. Global Market Analysis 2020 to 2024 and Forecast 2025 to 2035, By Region
    • Introduction
    • Historical Market Size Value (USD Billion) & Volume (MT) Analysis By Region, 2020 to 2024
    • Current Market Size Value (USD Billion) & Volume (MT) Analysis and Forecast By Region, 2025 to 2035
      • North America
      • Latin America
      • Western Europe
      • Eastern Europe
      • East Asia
      • South Asia & Pacific
      • Middle East and Africa
    • Market Attractiveness Analysis By Region
  9. North America Market Analysis 2020 to 2024 and Forecast 2025 to 2035, By Country
    • Historical Market Size Value (USD Billion) & Volume (MT) Trend Analysis By Market Taxonomy, 2020 to 2024
    • Market Size Value (USD Billion) & Volume (MT) Forecast By Market Taxonomy, 2025 to 2035
      • By Country
        • USA
        • Canada
        • Mexico
      • By Product Type
      • By Application
    • Market Attractiveness Analysis
      • By Country
      • By Product Type
      • By Application
    • Key Takeaways
  10. Latin America Market Analysis 2020 to 2024 and Forecast 2025 to 2035, By Country
    • Historical Market Size Value (USD Billion) & Volume (MT) Trend Analysis By Market Taxonomy, 2020 to 2024
    • Market Size Value (USD Billion) & Volume (MT) Forecast By Market Taxonomy, 2025 to 2035
      • By Country
        • Brazil
        • Argentina
        • Rest of LATAM
      • By Product Type
      • By Application
    • Market Attractiveness Analysis
      • By Country
      • By Product Type
      • By Application
    • Key Takeaways
  11. Western Europe Market Analysis 2020 to 2024 and Forecast 2025 to 2035, By Country
    • Historical Market Size Value (USD Billion) & Volume (MT) Trend Analysis By Market Taxonomy, 2020 to 2024
    • Market Size Value (USD Billion) & Volume (MT) Forecast By Market Taxonomy, 2025 to 2035
      • By Country
        • Germany
        • Italy
        • France
        • UK
        • Spain
        • BENELUX
        • Nordic
        • Rest of W.Europe
      • By Product Type
      • By Application
    • Market Attractiveness Analysis
      • By Country
      • By Product Type
      • By Application
    • Key Takeaways
  12. Eastern Europe Market Analysis 2020 to 2024 and Forecast 2025 to 2035, By Country
    • Historical Market Size Value (USD Billion) & Volume (MT) Trend Analysis By Market Taxonomy, 2020 to 2024
    • Market Size Value (USD Billion) & Volume (MT) Forecast By Market Taxonomy, 2025 to 2035
      • By Country
        • Russia
        • Hungary
        • Poland
        • Balkan & Baltics
        • Rest of E. Europe
      • By Product Type
      • By Application
    • Market Attractiveness Analysis
      • By Country
      • By Product Type
      • By Application
    • Key Takeaways
  13. East Asia Market Analysis 2020 to 2024 and Forecast 2025 to 2035, By Country
    • Historical Market Size Value (USD Billion) & Volume (MT) Trend Analysis By Market Taxonomy, 2020 to 2024
    • Market Size Value (USD Billion) & Volume (MT) Forecast By Market Taxonomy, 2025 to 2035
      • By Country
        • China
        • Japan
        • South Korea
      • By Product Type
      • By Application
    • Market Attractiveness Analysis
      • By Country
      • By Product Type
      • By Application
    • Key Takeaways
  14. South Asia & Pacific Market Analysis 2020 to 2024 and Forecast 2025 to 2035, By Country
    • Historical Market Size Value (USD Billion) & Volume (MT) Trend Analysis By Market Taxonomy, 2020 to 2024
    • Market Size Value (USD Billion) & Volume (MT) Forecast By Market Taxonomy, 2025 to 2035
      • By Country
        • India
        • Australia & New Zealand
        • ASEAN
        • Rest of SAP
      • By Product Type
      • By Application
    • Market Attractiveness Analysis
      • By Country
      • By Product Type
      • By Application
    • Key Takeaways
  15. Middle East and Africa Market Analysis 2020 to 2024 and Forecast 2025 to 2035, By Country
    • Historical Market Size Value (USD Billion) & Volume (MT) Trend Analysis By Market Taxonomy, 2020 to 2024
    • Market Size Value (USD Billion) & Volume (MT) Forecast By Market Taxonomy, 2025 to 2035
      • By Country
        • GCC Countries
        • Northern Africa
        • South Africa
        • Turkiye
        • Rest of MEA
      • By Product Type
      • By Application
    • Market Attractiveness Analysis
      • By Country
      • By Product Type
      • By Application
    • Key Takeaways
  16. Key Countries Market Analysis
    • USA
      • Pricing Analysis
      • Market Share Analysis, 2024
        • By Product Type
        • By Application
    • Canada
      • Pricing Analysis
      • Market Share Analysis, 2024
        • By Product Type
        • By Application
    • Brazil
      • Pricing Analysis
      • Market Share Analysis, 2024
        • By Product Type
        • By Application
    • Mexico
      • Pricing Analysis
      • Market Share Analysis, 2024
        • By Product Type
        • By Application
    • Argentina
      • Pricing Analysis
      • Market Share Analysis, 2024
        • By Product Type
        • By Application
  17. Market Structure Analysis
    • Competition Dashboard
    • Competition Benchmarking
    • Market Share Analysis of Top Players
      • By Regional
      • By Product Type
      • By Application
  18. Competition Analysis
    • Competition Deep Dive
      • Fiesta Spices
        • Overview
        • Product Portfolio
        • Profitability by Market Segments (Product/Age /Sales Channel/Region)
        • Sales Footprint
        • Strategy Overview
          • Marketing Strategy
          • Product Strategy
          • Channel Strategy
      • Louisiana Fish Fry
        • Overview
        • Product Portfolio
        • Profitability by Market Segments (Product/Age /Sales Channel/Region)
        • Sales Footprint
        • Strategy Overview
          • Marketing Strategy
          • Product Strategy
          • Channel Strategy
      • Hela Spice
        • Overview
        • Product Portfolio
        • Profitability by Market Segments (Product/Age /Sales Channel/Region)
        • Sales Footprint
        • Strategy Overview
          • Marketing Strategy
          • Product Strategy
          • Channel Strategy
      • Ball's Cajun Foods
        • Overview
        • Product Portfolio
        • Profitability by Market Segments (Product/Age /Sales Channel/Region)
        • Sales Footprint
        • Strategy Overview
          • Marketing Strategy
          • Product Strategy
          • Channel Strategy
      • Pete's Zizira
        • Overview
        • Product Portfolio
        • Profitability by Market Segments (Product/Age /Sales Channel/Region)
        • Sales Footprint
        • Strategy Overview
          • Marketing Strategy
          • Product Strategy
          • Channel Strategy
  19. Assumptions & Acronyms Used
  20. Research Methodology

List of Tables

  • Table 2: Global Market Volume (MT) Forecast by Region, 2020-2035
  • Table 3: Global Market Value (USD Billion) Forecast by Product Type, 2020-2035
  • Table 4: Global Market Volume (MT) Forecast by Product Type, 2020-2035
  • Table 5: Global Market Value (USD Billion) Forecast by Application, 2020-2035
  • Table 6: Global Market Volume (MT) Forecast by Application, 2020-2035
  • Table 7: North America Market Value (USD Billion) Forecast by Country, 2020-2035
  • Table 8: North America Market Volume (MT) Forecast by Country, 2020-2035
  • Table 9: North America Market Value (USD Billion) Forecast by Product Type, 2020-2035
  • Table 10: North America Market Volume (MT) Forecast by Product Type, 2020-2035
  • Table 11: North America Market Value (USD Billion) Forecast by Application, 2020-2035
  • Table 12: North America Market Volume (MT) Forecast by Application, 2020-2035
  • Table 13: Latin America Market Value (USD Billion) Forecast by Country, 2020-2035
  • Table 14: Latin America Market Volume (MT) Forecast by Country, 2020-2035
  • Table 15: Latin America Market Value (USD Billion) Forecast by Product Type, 2020-2035
  • Table 16: Latin America Market Volume (MT) Forecast by Product Type, 2020-2035
  • Table 17: Latin America Market Value (USD Billion) Forecast by Application, 2020-2035
  • Table 18: Latin America Market Volume (MT) Forecast by Application, 2020-2035
  • Table 19: Western Europe Market Value (USD Billion) Forecast by Country, 2020-2035
  • Table 20: Western Europe Market Volume (MT) Forecast by Country, 2020-2035
  • Table 21: Western Europe Market Value (USD Billion) Forecast by Product Type, 2020-2035
  • Table 22: Western Europe Market Volume (MT) Forecast by Product Type, 2020-2035
  • Table 23: Western Europe Market Value (USD Billion) Forecast by Application, 2020-2035
  • Table 24: Western Europe Market Volume (MT) Forecast by Application, 2020-2035
  • Table 25: Eastern Europe Market Value (USD Billion) Forecast by Country, 2020-2035
  • Table 26: Eastern Europe Market Volume (MT) Forecast by Country, 2020-2035
  • Table 27: Eastern Europe Market Value (USD Billion) Forecast by Product Type, 2020-2035
  • Table 28: Eastern Europe Market Volume (MT) Forecast by Product Type, 2020-2035
  • Table 29: Eastern Europe Market Value (USD Billion) Forecast by Application, 2020-2035
  • Table 30: Eastern Europe Market Volume (MT) Forecast by Application, 2020-2035
  • Table 31: East Asia Market Value (USD Billion) Forecast by Country, 2020-2035
  • Table 32: East Asia Market Volume (MT) Forecast by Country, 2020-2035
  • Table 33: East Asia Market Value (USD Billion) Forecast by Product Type, 2020-2035
  • Table 34: East Asia Market Volume (MT) Forecast by Product Type, 2020-2035
  • Table 35: East Asia Market Value (USD Billion) Forecast by Application, 2020-2035
  • Table 36: East Asia Market Volume (MT) Forecast by Application, 2020-2035
  • Table 37: South Asia & Pacific Market Value (USD Billion) Forecast by Country, 2020-2035
  • Table 38: South Asia & Pacific Market Volume (MT) Forecast by Country, 2020-2035
  • Table 39: South Asia & Pacific Market Value (USD Billion) Forecast by Product Type, 2020-2035
  • Table 40: South Asia & Pacific Market Volume (MT) Forecast by Product Type, 2020-2035
  • Table 41: South Asia & Pacific Market Value (USD Billion) Forecast by Application, 2020-2035
  • Table 42: South Asia & Pacific Market Volume (MT) Forecast by Application, 2020-2035
  • Table 43: Middle East and Africa Market Value (USD Billion) Forecast by Country, 2020-2035
  • Table 44: Middle East and Africa Market Volume (MT) Forecast by Country, 2020-2035
  • Table 45: Middle East and Africa Market Value (USD Billion) Forecast by Product Type, 2020-2035
  • Table 46: Middle East and Africa Market Volume (MT) Forecast by Product Type, 2020-2035
  • Table 47: Middle East and Africa Market Value (USD Billion) Forecast by Application, 2020-2035
  • Table 48: Middle East and Africa Market Volume (MT) Forecast by Application,

List of Figures

  • Figure 1: Global Market Volume (MT) Forecast 2020-2035
  • Figure 2: Global Market Pricing Analysis
  • Figure 3: Global Market Value (USD Billion) Forecast 2020-2035
  • Figure 4: Global Market Value Share and BPS Analysis by Product Type, 2025 and 2035
  • Figure 5: Global Market Y-o-Y Growth Comparison by Product Type, 2025-2035
  • Figure 6: Global Market Attractiveness Analysis by Product Type
  • Figure 7: Global Market Value Share and BPS Analysis by Application, 2025 and 2035
  • Figure 8: Global Market Y-o-Y Growth Comparison by Application, 2025-2035
  • Figure 9: Global Market Attractiveness Analysis by Application
  • Figure 10: Global Market Value (USD Billion) Share and BPS Analysis by Region, 2025 and 2035
  • Figure 11: Global Market Y-o-Y Growth Comparison by Region, 2025-2035
  • Figure 12: Global Market Attractiveness Analysis by Region
  • Figure 13: North America Market Incremental $ Opportunity, 2025-2035
  • Figure 14: Latin America Market Incremental $ Opportunity, 2025-2035
  • Figure 15: Western Europe Market Incremental $ Opportunity, 2025-2035
  • Figure 16: Eastern Europe Market Incremental $ Opportunity, 2025-2035
  • Figure 17: East Asia Market Incremental $ Opportunity, 2025-2035
  • Figure 18: South Asia & Pacific Market Incremental $ Opportunity, 2025-2035
  • Figure 19: Middle East and Africa Market Incremental $ Opportunity, 2025-2035
  • Figure 20: North America Market Value Share and BPS Analysis by Country, 2025 and 2035
  • Figure 21: North America Market Value Share and BPS Analysis by Product Type, 2025 and 2035
  • Figure 22: North America Market Y-o-Y Growth Comparison by Product Type, 2025-2035
  • Figure 23: North America Market Attractiveness Analysis by Product Type
  • Figure 24: North America Market Value Share and BPS Analysis by Application, 2025 and 2035
  • Figure 25: North America Market Y-o-Y Growth Comparison by Application, 2025-2035
  • Figure 26: North America Market Attractiveness Analysis by Application
  • Figure 27: Latin America Market Value Share and BPS Analysis by Country, 2025 and 2035
  • Figure 28: Latin America Market Value Share and BPS Analysis by Product Type, 2025 and 2035
  • Figure 29: Latin America Market Y-o-Y Growth Comparison by Product Type, 2025-2035
  • Figure 30: Latin America Market Attractiveness Analysis by Product Type
  • Figure 31: Latin America Market Value Share and BPS Analysis by Application, 2025 and 2035
  • Figure 32: Latin America Market Y-o-Y Growth Comparison by Application, 2025-2035
  • Figure 33: Latin America Market Attractiveness Analysis by Application
  • Figure 34: Western Europe Market Value Share and BPS Analysis by Country, 2025 and 2035
  • Figure 35: Western Europe Market Value Share and BPS Analysis by Product Type, 2025 and 2035
  • Figure 36: Western Europe Market Y-o-Y Growth Comparison by Product Type, 2025-2035
  • Figure 37: Western Europe Market Attractiveness Analysis by Product Type
  • Figure 38: Western Europe Market Value Share and BPS Analysis by Application, 2025 and 2035
  • Figure 39: Western Europe Market Y-o-Y Growth Comparison by Application, 2025-2035
  • Figure 40: Western Europe Market Attractiveness Analysis by Application
  • Figure 41: Eastern Europe Market Value Share and BPS Analysis by Country, 2025 and 2035
  • Figure 42: Eastern Europe Market Value Share and BPS Analysis by Product Type, 2025 and 2035
  • Figure 43: Eastern Europe Market Y-o-Y Growth Comparison by Product Type, 2025-2035
  • Figure 44: Eastern Europe Market Attractiveness Analysis by Product Type
  • Figure 45: Eastern Europe Market Value Share and BPS Analysis by Application, 2025 and 2035
  • Figure 46: Eastern Europe Market Y-o-Y Growth Comparison by Application, 2025-2035
  • Figure 47: Eastern Europe Market Attractiveness Analysis by Application
  • Figure 48: East Asia Market Value Share and BPS Analysis by Country, 2025 and 2035
  • Figure 49: East Asia Market Value Share and BPS Analysis by Product Type, 2025 and 2035
  • Figure 50: East Asia Market Y-o-Y Growth Comparison by Product Type, 2025-2035
  • Figure 51: East Asia Market Attractiveness Analysis by Product Type
  • Figure 52: East Asia Market Value Share and BPS Analysis by Application, 2025 and 2035
  • Figure 53: East Asia Market Y-o-Y Growth Comparison by Application, 2025-2035
  • Figure 54: East Asia Market Attractiveness Analysis by Application
  • Figure 55: South Asia & Pacific Market Value Share and BPS Analysis by Country, 2025 and 2035
  • Figure 56: South Asia & Pacific Market Value Share and BPS Analysis by Product Type, 2025 and 2035
  • Figure 57: South Asia & Pacific Market Y-o-Y Growth Comparison by Product Type, 2025-2035
  • Figure 58: South Asia & Pacific Market Attractiveness Analysis by Product Type
  • Figure 59: South Asia & Pacific Market Value Share and BPS Analysis by Application, 2025 and 2035
  • Figure 60: South Asia & Pacific Market Y-o-Y Growth Comparison by Application, 2025-2035
  • Figure 61: South Asia & Pacific Market Attractiveness Analysis by Application
  • Figure 62: Middle East and Africa Market Value Share and BPS Analysis by Country, 2025 and 2035
  • Figure 63: Middle East and Africa Market Value Share and BPS Analysis by Product Type, 2025 and 2035
  • Figure 64: Middle East and Africa Market Y-o-Y Growth Comparison by Product Type, 2025-2035
  • Figure 65: Middle East and Africa Market Attractiveness Analysis by Product Type
  • Figure 66: Middle East and Africa Market Value Share and BPS Analysis by Application, 2025 and 2035
  • Figure 67: Middle East and Africa Market Y-o-Y Growth Comparison by Application, 2025-2035
  • Figure 68: Middle East and Africa Market Attractiveness Analysis by Application
  • Figure 69: Global Market - Tier Structure Analysis
  • Figure 70: Global Market - Company Share Analysis

Frequently Asked Questions

What is the projected size of the Cajun spice market by 2035?

The industry is forecasted to reach USD 1,001.1 million by 2035, growing from USD 638.5 million in 2025.

What is the expected CAGR of the Cajun spice market during 2025 to 2035?

The industry is expected to grow at a compound annual growth rate (CAGR) of 4.6% during the forecast period.

Which product segment leads the market in 2025?

California Cajun Spice leads with a 25% share in 2025, driven by strong regional demand and product innovation.

Which application dominates Cajun spice usage?

Meat & Seafood Seasoning accounts for 64.1% of market share in 2025, making it the largest application segment.

Who are the leading players in the Cajun spice market?

Key player include Fiesta Spices holding 13.5% of market share.

Explore Similar Insights

Future Market Insights

Cajun Spice Market