Cat Litter Product Market Outlook 2024 to 2034

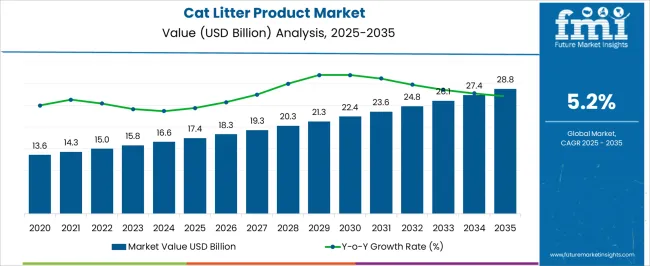
The global cat litter product market is anticipated to propel the market growth in the forthcoming decade. In 2024 the worldwide cat litter product market is estimated to generate around US$ 16,538.80 million. Between 2024 and 2034, the market is projected to grow at 5.40%, with a projected value of US$ 27,984.00 million.

Attributes Key Statistics
Expected Base Year Value (2024) US$ 16,538.80 million
Anticipated Forecast Value (2034) US$ 27,984.00 million
Estimated Growth (2024 to 2034) 5.40% CAGR

Don't pay for what you don't need

Customize your report by selecting specific countries or regions and save 30%!

Key Market Highlights

Sustainable Products Are Grooming the Pet Care Market

  • The increasing demand for sustainable goods due to the expanded chance to go green globally is expected to favorably influence the global cat litter product market over the forecast period.
  • Increasing customer interest is aided by the cat litter's easy maintenance, cleanability, and odor control capabilities. The increasing development of novel natural debris that is fragrance-free, chemical-free, and biodegradable is creating business opportunities.
  • Several market participants have created environmentally safe and sustainable kitty litter products. For instance, Sustainably Yours Natural Cat Litter produced new packaging for litter. The litter is made up of only two introductory, renewable, and sustainable ingredients: maize and cassava, both of which are very absorbent, entirely natural, and eliminate odor on contact.

Snowballing Interest of Feline Companion Drives Demand for Cat Litter

  • The global cat litter product market is growing because more and more individuals are choosing cats as their preferred pets.
  • The market for cat litter is a booming, quickly changing sector that meets the demands of our cherished feline companions. The need for practical, odor-controlling, and environmentally friendly cat litter choices has increased with pet ownership.
  • Other significant trends influencing the global kitty litter industry include consumers' growing disposable income and rapid urbanization. Throughout the projected period, the market's expansion will be supported by these expanding trends in the cat litter industry.
  • The demand for cat litter products is fueled by millennial pet owners knowledgeable about market goods. The millennial generation and older adults significantly impact global cat adoption, and their social media presence can be used to promote litter sales.

Historical Analysis of the Cat Litter Product Market

The global cat litter product industry will undergo significant modification over the next ten years. Analysts forecast a 5.40% CAGR between 2024 and 2034, higher than the stable but modest 5.00% rate predicted for 2019 through 2023.

Attributes Key Statistics
Expected Base Year Value (2023) US$ 15,706.40 million
Final Value (2024) US$ 16,538.80 million
Estimated Growth (2019 to 2023) 5.00% CAGR

The market for cat litter is a booming, quickly changing sector that meets the demands of our cherished feline companions. The need for practical, odor-controlling, and environmentally friendly cat litter choices has increased along with pet ownership.

Innovative items, including silica gel crystals, clumping clay, natural plant-based substitutes, and smart litter systems, are being introduced by manufacturers. Cat parents desire a litter that provides convenience, ease of cleanup, and extended freshness beyond usefulness.

The adoption of cat litter has spread widely among cat owners, especially those with many cats. However, the product's high price and some pet owners' reluctance to spend a lot of money on expensive items for their animals might serve as a market restriction. Additionally, this causes a situation where the market is unable to launch high-end items, which hinders market growth.

The growing cost of raw materials used to produce cat litter products is expected to hamper the market growth. Regular non-clumping litter can be made to control the raw material cost for the production of cat litter products, which is the cheapest material per pound for filling up litter boxes. Additional crucial aspects that are anticipated to impede the market's growth include growing worries about the environment and pet health.

For instance, the carbon footprint of silica, which is utilized in kitty litter products, is rather significant. It damages the climate as well. Switching to environmentally friendly kitty litter will have a significant effect on reducing carbon emissions.

Sudip Saha
Sudip Saha

Principal Consultant

Talk to Analyst

Find your sweet spots for generating winning opportunities in this market.

Top Product Insights

Clumping Feline Litter Dominates the Global Cat Litter Product Market

Top Product Clumping Cat Litter
Market share 72.50%
  • Clumps litter is the dominant segment in terms of product type, and it is anticipated to account for over 72.50% of the global cat litter product market in 2024.
  • Clumping litter has expanded due to its benefits, such as the ability to separate lumps from stray debris without lifting it.
  • Clumping litter, made from bentonite, is a highly absorbent clay that forms solid clumps when felines urinate, leaving the litter box odor-free and clean.
  • Clumping litter is a popular and convenient pet waste option, offering easy cleaning and various fragrances, granule sizes, and textures, making it a popular choice among pet owners.
  • The litter soon attaches to the waste, cupping around to form a barrier. It prevents debris from spreading throughout the litter box, keeping the kitty box fresher for longer.

Top Sales Channel Insights

Online Retailers Unleashes Potential in the Cat Grooming Market

Top Sales Channel Online Retailers
Market share 22.20%
  • The online retailer's sales channel is expected to generate a revenue share of more than 22.20% in the global cat litter product market by 2024 as more pet owners become digitally connected.
  • Consumers are investigating the growing popularity of Internet merchants as their go-to sales channel.
  • The availability of a large selection of items, product discounts, variation in brand sales, and digital checkouts at online retail platforms are advantageous to customers.
  • As a result, many companies are launching hashtag campaigns and actively working with social media celebrities to market their products.

Get the data you need at a Fraction of the cost

Personalize your report by choosing insights you need
and save 40%!

Country-wise Insights

The United States Explore Landscape of the Kitty Litter Market

Country United States
CAGR (2024 to 2034) 5.3%
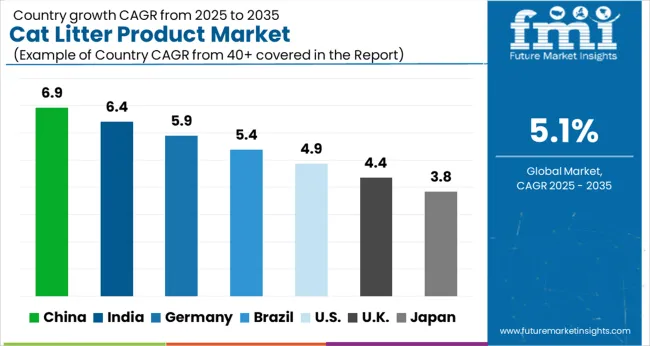
  • Due to the United States' economic expansion, its demand is likely to increase at a CAGR of 5.3% during the next ten years.
  • The high end of the market is growing because consumers are ready to spend more money on their pets.
  • An increase in Americans see the cats they own as part of their family. Particularly in America, millennials have taken a strong interest in adopting pets.
  • The report published by American Pet Products Org serves as an illustration. According to estimates, Americans will spend US$ 95.7 billion on pets in 2019.

The Feline Litter Market Skyrockets in China

Country China
CAGR (2024 to 2034) 5.6%
  • East Asia's top producer of kitty litter is China. It is anticipated to contribute more than 5.6% of the regional CAGR by 2034.
  • Kitty litter is becoming increasingly popular in the Chinese market, fueled by rising downstream demand.
  • In addition to canines, kittens are becoming increasingly popular pet options in China.
  • Due to the high level of market penetration in China, it is difficult for new brands to join the market while existing companies fight for market share.
  • As per the 2021 White Paper on China's Pet Consumption Trends, there has been a nearly 50% surge in the number of pets in Chinese cities since 2015, indicating the immense potential of this market.

Nuclear Families in India Shelters Feline Grooming Market

Country India
CAGR (2024 to 2034) 5.7%
  • India cat litter product market is expected to develop at a CAGR of 5.7% by 2034.
  • Growing disposable money and the humanization of pets are the main drivers of the nation's progress.
  • Over the past several years, cat ownership has significantly expanded in India due to changes in urban lifestyles and the rise of nuclear households.
  • Because of the increased demand for premium products, cat litter producers are responding by producing more natural and high-quality products.
  • For instance, Mars Inc. brought the CATSAN Hygiene Plus non-clumping litter brand to India in October 2020. The product is distributed across the nation via both offline and online mediums.

Australian Brands Scratches the Leading Share of Cat Litter Product Market

Country Australia
CAGR (2024 to 2034) 5.9%
  • Australia's cat litter product market is anticipated to expand at a noteworthy CAGR of 5.9% from 2024 to 2034.
  • Australian brands are quite capable of changing the way that consumers see them. Contextualization, arguments for belief, illustrations, and benefit information are all included in this.
  • The brands are using either functional incentives or emotive propositions.
  • Due to fierce competition, Australian businesses place a great deal of emphasis on expanding their product lines through reformulations, new product launches, and line extensions.
  • Strong relationships with chain stores and intensive consumer promotion support these tactics.

Pet Stores and Shelters Grooms the German Pet Care Industry

Country Germany
CAGR (2024 to 2034) 5.5%
  • The sales of cat litter in Germany are expected to be over-significant in 2034, with a CAGR of 5.5%.
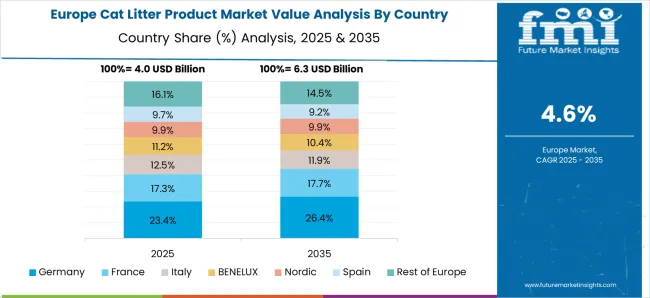
  • Due to the high number of pet retailers driving up the use of the product, Germany is considered to have a significant position in the cat litter industry.
  • In addition, finding new homes for pets contributes to the rise in consumption in Germany, where pet shelters are increasingly responsible for sheltering animals.
  • For example, the Clorox Company's Fresh Step brand debuted Clean Paws, the first low-tracking litter, in January 2018. This concoction was developed to stop cats from bringing messes into the house and residue from sticking to their paws.

Competitive Landscape in the Cat Litter Product Market

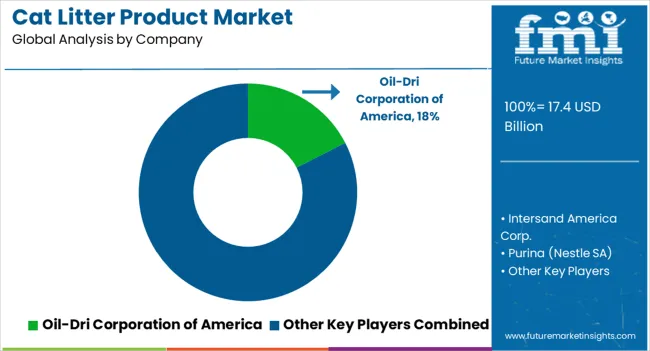
In the global cat litter product market, market players are still pursuing attracting more consumers to their brands and expanding their reach worldwide. Brands in cat care products are adopting a range of strategies to maintain their market positions and further develop their business. These strategies include mergers and acquisitions, forging partnerships and alliances, launching new products, expanding their international presence, and exploring other avenues. Pet product manufacturers can remain ahead of their competition and successfully satisfy the desires of consumers in various locations by employing multiple techniques.

Recent Developments in the Cat Litter Product Market

  • In November 2023, Whisker introduced Litter-Robot 4 and Litter-Robot 3, the self-cleaning and high-tech litter robot. The smart litter equipment features accessories like litter, a litter trap mat, and odor trap packs that further eliminate odor. The cat owner can control the device by using the mobile application.
  • In August 2023, Tesla created the Cybertruck Multifunctional Corrugated Cat Litter, a kitty litter box made of sustainable materials like cork, with a design inspired by the company's e-vehicle Cybertruck.
  • In February 2023, Xiaomi presented the Xiaowan Intelligent Automatic Cat Litter Box. The litter box is intended to reduce the frequency and duration with which cat owners clean their litter box.
  • In February 2023, Arm & Hammer released the Litter Champ Pro Odor Control System, which employs a carbon filter to collect and neutralize litter box odor. Pet owners want solutions that successfully manage odor, and this product meets that need.
  • In January 2023, Dr. Elsey's launched its new Smart Scoop litter box, which has a built-in litter sensor that alerts users when it's time to scoop the box. Pet parents can maintain the device by using the mobile application.

Key Companies in the Cat Litter Product Market

  • Intersand America Corp.
  • Oil-Dri Corporation of America
  • Purina (Nestle SA)
  • Kent Pet Group
  • Dr. Elsey’s Cat Products
  • Church & Dwight Co.
  • Dirk Rossmann GmbH
  • Fressnapf Tiernahrungs GmbH
  • dm-drogerie markt GmbH + Co. KG
  • Arm & Hammer (Church & Dwight)
  • The Clorox Company
  • Mars Incorporated
  • J. RETTENMAIER & SÖHNE Gmbh + Co KG
  • H. von Gimborn GmbH.
  • Gruppo Laviosa Minerals Srl.
  • Tolsa Company
  • Weihai Pearl Silica Gel Co., Ltd.
  • Pettex Limited

Market Segmentation

By Product:

  • Clumping
  • Non-Clumping

By Material Type:

  • Clay
  • Silica
  • Plant Fibers
  • Pine
  • Paper/Wood
  • Walnut
  • Corn
  • Others (wheat, Grass, Pea fibers, etc.)

By Nature:

  • Natural
  • Conventional

By Type:

  • Scented/ Fragrance
  • Unscented/ Without Fragrance

By Form Type:

  • Clay
  • Fine Litter
  • Coarse Litter
  • Silica
  • Fine Litter
  • Coarse Litter
  • Plant Fibers
  • Fine Litter
  • Coarse Litter

By Sales Channel:

  • Direct Sales Channel
  • Indirect Sales Channel
  • Hypermarkets/Supermarkets
  • Multi-Brand Stores
  • Pet Care Centers
  • Pet Specialty Stores
  • Online Retailers
  • Discount Stores
  • Drug Stores

By Region:

  • North America
  • Europe
  • Asia Pacific
  • Latin America
  • The Middle East & Africa

Frequently Asked Questions

What is the Growth Forecast for the Cat Litter Industry?

The cat litter product market is estimated to increase at a 5.40% CAGR between 2024 and 2034.

What is the Size of the Cat Litter Product Market in India?

The India cat litter sector captures the global market with a CAGR of 5.7%.

Which are the Top Five Countries Driving Demand for Cat Litter?

The United States, Germany, China, India, and Australia are the top five countries driving the demand for cat litter.

How Much is the Global Cat Litter Product Market Worth in 2023?

The global cat litter product market is worth US$ 15,706.40 million in 2023.

Based on the Sales Channel, Which Segment Dominates the Cat Litter Industry?

The online retailers are expected to account for the market share of 22.20% in 2024.

Table of Content
1. Executive Summary
    1.1. Global Market Outlook
    1.2. Demand-side Trends
    1.3. Supply-side Trends
    1.4. Technology Roadmap Analysis
    1.5. Analysis and Recommendations
2. Market Overview
    2.1. Market Coverage / Taxonomy
    2.2. Market Definition / Scope / Limitations
3. Market Background
    3.1. Market Dynamics
        3.1.1. Drivers
        3.1.2. Restraints
        3.1.3. Opportunity
        3.1.4. Trends
    3.2. Scenario Forecast
        3.2.1. Demand in Optimistic Scenario
        3.2.2. Demand in Likely Scenario
        3.2.3. Demand in Conservative Scenario
    3.3. Opportunity Map Analysis
    3.4. Product Life Cycle Analysis
    3.5. Supply Chain Analysis
        3.5.1. Supply Side Participants and their Roles
            3.5.1.1. Producers
            3.5.1.2. Mid-Level Participants (Traders/ Agents/ Brokers)
            3.5.1.3. Wholesalers and Distributors
        3.5.2. Value Added and Value Created at Node in the Supply Chain
        3.5.3. List of Raw Material Suppliers
        3.5.4. List of Existing and Potential Buyer’s
    3.6. Investment Feasibility Matrix
    3.7. Value Chain Analysis
        3.7.1. Profit Margin Analysis
        3.7.2. Wholesalers and Distributors
        3.7.3. Retailers
    3.8. PESTLE and Porter’s Analysis
    3.9. Regulatory Landscape
        3.9.1. By Key Regions
        3.9.2. By Key Countries
    3.10. Regional Parent Market Outlook
    3.11. Production and Consumption Statistics
    3.12. Import and Export Statistics
4. Global Market Analysis 2019 to 2023 and Forecast, 2023 to 2034
    4.1. Historical Market Size Value (US$ Million) & Volume (Tons) Analysis, 2019 to 2023
    4.2. Current and Future Market Size Value (US$ Million) & Volume (Tons) Projections, 2023 to 2034
        4.2.1. Y-o-Y Growth Trend Analysis
        4.2.2. Absolute $ Opportunity Analysis
5. Global Market Analysis 2019 to 2023 and Forecast 2023 to 2034, By Product Type
    5.1. Introduction / Key Findings
    5.2. Historical Market Size Value (US$ Million) & Volume (Tons) Analysis By Product Type, 2019 to 2023
    5.3. Current and Future Market Size Value (US$ Million) & Volume (Tons) Analysis and Forecast By Product Type, 2023 to 2034
        5.3.1. Clumping
        5.3.2. Conventional
    5.4. Y-o-Y Growth Trend Analysis By Product Type, 2019 to 2023
    5.5. Absolute $ Opportunity Analysis By Product Type, 2023 to 2034
6. Global Market Analysis 2019 to 2023 and Forecast 2023 to 2034, By Raw Material
    6.1. Introduction / Key Findings
    6.2. Historical Market Size Value (US$ Million) & Volume (Tons) Analysis By Raw Material , 2019 to 2023
    6.3. Current and Future Market Size Value (US$ Million) & Volume (Tons) Analysis and Forecast By Raw Material , 2023 to 2034
        6.3.1. Clay
        6.3.2. Silica
        6.3.3. Wood/Bamboo/Sawdust
        6.3.4. Paper
        6.3.5. Soy
        6.3.6. Corn/Grain
        6.3.7. Others
    6.4. Y-o-Y Growth Trend Analysis By Raw Material , 2019 to 2023
    6.5. Absolute $ Opportunity Analysis By Raw Material , 2023 to 2034
7. Global Market Analysis 2019 to 2023 and Forecast 2023 to 2034, By Distribution Channel
    7.1. Introduction / Key Findings
    7.2. Historical Market Size Value (US$ Million) & Volume (Tons) Analysis By Distribution Channel, 2019 to 2023
    7.3. Current and Future Market Size Value (US$ Million) & Volume (Tons) Analysis and Forecast By Distribution Channel, 2023 to 2034
        7.3.1. Supermarkets and Hypermarkets
        7.3.2. Specialty Retail Stores
        7.3.3. Convenience Stores
        7.3.4. Online/E-commerce
    7.4. Y-o-Y Growth Trend Analysis By Distribution Channel, 2019 to 2023
    7.5. Absolute $ Opportunity Analysis By Distribution Channel, 2023 to 2034
8. Global Market Analysis 2019 to 2023 and Forecast 2023 to 2034, By Region
    8.1. Introduction
    8.2. Historical Market Size Value (US$ Million) & Volume (Tons) Analysis By Region, 2019 to 2023
    8.3. Current Market Size Value (US$ Million) & Volume (Tons) Analysis and Forecast By Region, 2023 to 2034
        8.3.1. North America
        8.3.2. Latin America
        8.3.3. Western Europe
        8.3.4. Eastern Europe
        8.3.5. South Asia and Pacific
        8.3.6. East Asia
        8.3.7. Middle East and Africa
    8.4. Market Attractiveness Analysis By Region
9. North America Market Analysis 2019 to 2023 and Forecast 2023 to 2034, By Country
    9.1. Historical Market Size Value (US$ Million) & Volume (Tons) Trend Analysis By Market Taxonomy, 2019 to 2023
    9.2. Market Size Value (US$ Million) & Volume (Tons) Forecast By Market Taxonomy, 2023 to 2034
        9.2.1. By Country
            9.2.1.1. USA
            9.2.1.2. Canada
        9.2.2. By Product Type
        9.2.3. By Raw Material
        9.2.4. By Distribution Channel
    9.3. Market Attractiveness Analysis
        9.3.1. By Country
        9.3.2. By Product Type
        9.3.3. By Raw Material
        9.3.4. By Distribution Channel
    9.4. Key Takeaways
10. Latin America Market Analysis 2019 to 2023 and Forecast 2023 to 2034, By Country
    10.1. Historical Market Size Value (US$ Million) & Volume (Tons) Trend Analysis By Market Taxonomy, 2019 to 2023
    10.2. Market Size Value (US$ Million) & Volume (Tons) Forecast By Market Taxonomy, 2023 to 2034
        10.2.1. By Country
            10.2.1.1. Brazil
            10.2.1.2. Mexico
            10.2.1.3. Rest of Latin America
        10.2.2. By Product Type
        10.2.3. By Raw Material
        10.2.4. By Distribution Channel
    10.3. Market Attractiveness Analysis
        10.3.1. By Country
        10.3.2. By Product Type
        10.3.3. By Raw Material
        10.3.4. By Distribution Channel
    10.4. Key Takeaways
11. Western Europe Market Analysis 2019 to 2023 and Forecast 2023 to 2034, By Country
    11.1. Historical Market Size Value (US$ Million) & Volume (Tons) Trend Analysis By Market Taxonomy, 2019 to 2023
    11.2. Market Size Value (US$ Million) & Volume (Tons) Forecast By Market Taxonomy, 2023 to 2034
        11.2.1. By Country
            11.2.1.1. Germany
            11.2.1.2. UK
            11.2.1.3. France
            11.2.1.4. Spain
            11.2.1.5. Italy
            11.2.1.6. Rest of Western Europe
        11.2.2. By Product Type
        11.2.3. By Raw Material
        11.2.4. By Distribution Channel
    11.3. Market Attractiveness Analysis
        11.3.1. By Country
        11.3.2. By Product Type
        11.3.3. By Raw Material
        11.3.4. By Distribution Channel
    11.4. Key Takeaways
12. Eastern Europe Market Analysis 2019 to 2023 and Forecast 2023 to 2034, By Country
    12.1. Historical Market Size Value (US$ Million) & Volume (Tons) Trend Analysis By Market Taxonomy, 2019 to 2023
    12.2. Market Size Value (US$ Million) & Volume (Tons) Forecast By Market Taxonomy, 2023 to 2034
        12.2.1. By Country
            12.2.1.1. Poland
            12.2.1.2. Russia
            12.2.1.3. Czech Republic
            12.2.1.4. Romania
            12.2.1.5. Rest of Eastern Europe
        12.2.2. By Product Type
        12.2.3. By Raw Material
        12.2.4. By Distribution Channel
    12.3. Market Attractiveness Analysis
        12.3.1. By Country
        12.3.2. By Product Type
        12.3.3. By Raw Material
        12.3.4. By Distribution Channel
    12.4. Key Takeaways
13. South Asia and Pacific Market Analysis 2019 to 2023 and Forecast 2023 to 2034, By Country
    13.1. Historical Market Size Value (US$ Million) & Volume (Tons) Trend Analysis By Market Taxonomy, 2019 to 2023
    13.2. Market Size Value (US$ Million) & Volume (Tons) Forecast By Market Taxonomy, 2023 to 2034
        13.2.1. By Country
            13.2.1.1. India
            13.2.1.2. Bangladesh
            13.2.1.3. Australia
            13.2.1.4. New Zealand
            13.2.1.5. Rest of South Asia and Pacific
        13.2.2. By Product Type
        13.2.3. By Raw Material
        13.2.4. By Distribution Channel
    13.3. Market Attractiveness Analysis
        13.3.1. By Country
        13.3.2. By Product Type
        13.3.3. By Raw Material
        13.3.4. By Distribution Channel
    13.4. Key Takeaways
14. East Asia Market Analysis 2019 to 2023 and Forecast 2023 to 2034, By Country
    14.1. Historical Market Size Value (US$ Million) & Volume (Tons) Trend Analysis By Market Taxonomy, 2019 to 2023
    14.2. Market Size Value (US$ Million) & Volume (Tons) Forecast By Market Taxonomy, 2023 to 2034
        14.2.1. By Country
            14.2.1.1. China
            14.2.1.2. Japan
            14.2.1.3. South Korea
        14.2.2. By Product Type
        14.2.3. By Raw Material
        14.2.4. By Distribution Channel
    14.3. Market Attractiveness Analysis
        14.3.1. By Country
        14.3.2. By Product Type
        14.3.3. By Raw Material
        14.3.4. By Distribution Channel
    14.4. Key Takeaways
15. Middle East and Africa Market Analysis 2019 to 2023 and Forecast 2023 to 2034, By Country
    15.1. Historical Market Size Value (US$ Million) & Volume (Tons) Trend Analysis By Market Taxonomy, 2019 to 2023
    15.2. Market Size Value (US$ Million) & Volume (Tons) Forecast By Market Taxonomy, 2023 to 2034
        15.2.1. By Country
            15.2.1.1. GCC Countries
            15.2.1.2. South Africa
            15.2.1.3. Israel
            15.2.1.4. Rest of MEA
        15.2.2. By Product Type
        15.2.3. By Raw Material
        15.2.4. By Distribution Channel
    15.3. Market Attractiveness Analysis
        15.3.1. By Country
        15.3.2. By Product Type
        15.3.3. By Raw Material
        15.3.4. By Distribution Channel
    15.4. Key Takeaways
16. Key Countries Market Analysis
    16.1. USA
        16.1.1. Pricing Analysis
        16.1.2. Market Share Analysis, 2023
            16.1.2.1. By Product Type
            16.1.2.2. By Raw Material
            16.1.2.3. By Distribution Channel
    16.2. Canada
        16.2.1. Pricing Analysis
        16.2.2. Market Share Analysis, 2023
            16.2.2.1. By Product Type
            16.2.2.2. By Raw Material
            16.2.2.3. By Distribution Channel
    16.3. Brazil
        16.3.1. Pricing Analysis
        16.3.2. Market Share Analysis, 2023
            16.3.2.1. By Product Type
            16.3.2.2. By Raw Material
            16.3.2.3. By Distribution Channel
    16.4. Mexico
        16.4.1. Pricing Analysis
        16.4.2. Market Share Analysis, 2023
            16.4.2.1. By Product Type
            16.4.2.2. By Raw Material
            16.4.2.3. By Distribution Channel
    16.5. Germany
        16.5.1. Pricing Analysis
        16.5.2. Market Share Analysis, 2023
            16.5.2.1. By Product Type
            16.5.2.2. By Raw Material
            16.5.2.3. By Distribution Channel
    16.6. UK
        16.6.1. Pricing Analysis
        16.6.2. Market Share Analysis, 2023
            16.6.2.1. By Product Type
            16.6.2.2. By Raw Material
            16.6.2.3. By Distribution Channel
    16.7. France
        16.7.1. Pricing Analysis
        16.7.2. Market Share Analysis, 2023
            16.7.2.1. By Product Type
            16.7.2.2. By Raw Material
            16.7.2.3. By Distribution Channel
    16.8. Spain
        16.8.1. Pricing Analysis
        16.8.2. Market Share Analysis, 2023
            16.8.2.1. By Product Type
            16.8.2.2. By Raw Material
            16.8.2.3. By Distribution Channel
    16.9. Italy
        16.9.1. Pricing Analysis
        16.9.2. Market Share Analysis, 2023
            16.9.2.1. By Product Type
            16.9.2.2. By Raw Material
            16.9.2.3. By Distribution Channel
    16.10. Poland
        16.10.1. Pricing Analysis
        16.10.2. Market Share Analysis, 2023
            16.10.2.1. By Product Type
            16.10.2.2. By Raw Material
            16.10.2.3. By Distribution Channel
    16.11. Russia
        16.11.1. Pricing Analysis
        16.11.2. Market Share Analysis, 2023
            16.11.2.1. By Product Type
            16.11.2.2. By Raw Material
            16.11.2.3. By Distribution Channel
    16.12. Czech Republic
        16.12.1. Pricing Analysis
        16.12.2. Market Share Analysis, 2023
            16.12.2.1. By Product Type
            16.12.2.2. By Raw Material
            16.12.2.3. By Distribution Channel
    16.13. Romania
        16.13.1. Pricing Analysis
        16.13.2. Market Share Analysis, 2023
            16.13.2.1. By Product Type
            16.13.2.2. By Raw Material
            16.13.2.3. By Distribution Channel
    16.14. India
        16.14.1. Pricing Analysis
        16.14.2. Market Share Analysis, 2023
            16.14.2.1. By Product Type
            16.14.2.2. By Raw Material
            16.14.2.3. By Distribution Channel
    16.15. Bangladesh
        16.15.1. Pricing Analysis
        16.15.2. Market Share Analysis, 2023
            16.15.2.1. By Product Type
            16.15.2.2. By Raw Material
            16.15.2.3. By Distribution Channel
    16.16. Australia
        16.16.1. Pricing Analysis
        16.16.2. Market Share Analysis, 2023
            16.16.2.1. By Product Type
            16.16.2.2. By Raw Material
            16.16.2.3. By Distribution Channel
    16.17. New Zealand
        16.17.1. Pricing Analysis
        16.17.2. Market Share Analysis, 2023
            16.17.2.1. By Product Type
            16.17.2.2. By Raw Material
            16.17.2.3. By Distribution Channel
    16.18. China
        16.18.1. Pricing Analysis
        16.18.2. Market Share Analysis, 2023
            16.18.2.1. By Product Type
            16.18.2.2. By Raw Material
            16.18.2.3. By Distribution Channel
    16.19. Japan
        16.19.1. Pricing Analysis
        16.19.2. Market Share Analysis, 2023
            16.19.2.1. By Product Type
            16.19.2.2. By Raw Material
            16.19.2.3. By Distribution Channel
    16.20. South Korea
        16.20.1. Pricing Analysis
        16.20.2. Market Share Analysis, 2023
            16.20.2.1. By Product Type
            16.20.2.2. By Raw Material
            16.20.2.3. By Distribution Channel
    16.21. GCC Countries
        16.21.1. Pricing Analysis
        16.21.2. Market Share Analysis, 2023
            16.21.2.1. By Product Type
            16.21.2.2. By Raw Material
            16.21.2.3. By Distribution Channel
    16.22. South Africa
        16.22.1. Pricing Analysis
        16.22.2. Market Share Analysis, 2023
            16.22.2.1. By Product Type
            16.22.2.2. By Raw Material
            16.22.2.3. By Distribution Channel
    16.23. Israel
        16.23.1. Pricing Analysis
        16.23.2. Market Share Analysis, 2023
            16.23.2.1. By Product Type
            16.23.2.2. By Raw Material
            16.23.2.3. By Distribution Channel
17. Market Structure Analysis
    17.1. Competition Dashboard
    17.2. Competition Benchmarking
    17.3. Market Share Analysis of Top Players
        17.3.1. By Regional
        17.3.2. By Product Type
        17.3.3. By Raw Material
        17.3.4. By Distribution Channel
18. Competition Analysis
    18.1. Competition Deep Dive
        18.1.1. Nestlé S.A.
            18.1.1.1. Overview
            18.1.1.2. Product Portfolio
            18.1.1.3. Profitability by Market Segments
            18.1.1.4. Sales Footprint
            18.1.1.5. Strategy Overview
                18.1.1.5.1. Marketing Strategy
                18.1.1.5.2. Product Strategy
                18.1.1.5.3. Channel Strategy
        18.1.2. The Clorox Company
            18.1.2.1. Overview
            18.1.2.2. Product Portfolio
            18.1.2.3. Profitability by Market Segments
            18.1.2.4. Sales Footprint
            18.1.2.5. Strategy Overview
                18.1.2.5.1. Marketing Strategy
                18.1.2.5.2. Product Strategy
                18.1.2.5.3. Channel Strategy
        18.1.3. Mars, Incorporated
            18.1.3.1. Overview
            18.1.3.2. Product Portfolio
            18.1.3.3. Profitability by Market Segments
            18.1.3.4. Sales Footprint
            18.1.3.5. Strategy Overview
                18.1.3.5.1. Marketing Strategy
                18.1.3.5.2. Product Strategy
                18.1.3.5.3. Channel Strategy
        18.1.4. Oil-Dri Corporation of America
            18.1.4.1. Overview
            18.1.4.2. Product Portfolio
            18.1.4.3. Profitability by Market Segments
            18.1.4.4. Sales Footprint
            18.1.4.5. Strategy Overview
                18.1.4.5.1. Marketing Strategy
                18.1.4.5.2. Product Strategy
                18.1.4.5.3. Channel Strategy
        18.1.5. Church & Dwight Co., Inc.
            18.1.5.1. Overview
            18.1.5.2. Product Portfolio
            18.1.5.3. Profitability by Market Segments
            18.1.5.4. Sales Footprint
            18.1.5.5. Strategy Overview
                18.1.5.5.1. Marketing Strategy
                18.1.5.5.2. Product Strategy
                18.1.5.5.3. Channel Strategy
        18.1.6. Kent Corporation
            18.1.6.1. Overview
            18.1.6.2. Product Portfolio
            18.1.6.3. Profitability by Market Segments
            18.1.6.4. Sales Footprint
            18.1.6.5. Strategy Overview
                18.1.6.5.1. Marketing Strategy
                18.1.6.5.2. Product Strategy
                18.1.6.5.3. Channel Strategy
        18.1.7. Intersand
            18.1.7.1. Overview
            18.1.7.2. Product Portfolio
            18.1.7.3. Profitability by Market Segments
            18.1.7.4. Sales Footprint
            18.1.7.5. Strategy Overview
                18.1.7.5.1. Marketing Strategy
                18.1.7.5.2. Product Strategy
                18.1.7.5.3. Channel Strategy
        18.1.8. Dr. Elsey's
            18.1.8.1. Overview
            18.1.8.2. Product Portfolio
            18.1.8.3. Profitability by Market Segments
            18.1.8.4. Sales Footprint
            18.1.8.5. Strategy Overview
                18.1.8.5.1. Marketing Strategy
                18.1.8.5.2. Product Strategy
                18.1.8.5.3. Channel Strategy
        18.1.9. Weihai Pearl Silica Gel Co., Ltd.
            18.1.9.1. Overview
            18.1.9.2. Product Portfolio
            18.1.9.3. Profitability by Market Segments
            18.1.9.4. Sales Footprint
            18.1.9.5. Strategy Overview
                18.1.9.5.1. Marketing Strategy
                18.1.9.5.2. Product Strategy
                18.1.9.5.3. Channel Strategy
        18.1.10. Pettex Limited
            18.1.10.1. Overview
            18.1.10.2. Product Portfolio
            18.1.10.3. Profitability by Market Segments
            18.1.10.4. Sales Footprint
            18.1.10.5. Strategy Overview
                18.1.10.5.1. Marketing Strategy
                18.1.10.5.2. Product Strategy
                18.1.10.5.3. Channel Strategy
19. Assumptions & Acronyms Used
20. Research Methodology
Recommendations

Consumer Product

Cat and Dog Food Topper Market

April 2024

REP-GB-15732

306 pages

Consumer Product

Cat Scratchers and Trees Market

August 2023

REP-GB-15627

324 pages

Explore Consumer Product Insights

View Reports
Future Market Insights

Cat Litter Product Market

Schedule a Call