The global cathodic protection market is valued at USD 5.1 billion in 2025 and is slated to reach USD 8.5 billion by 2035, recording an absolute increase of USD 3.4 billion over the forecast period. This translates into a total growth of 66.7%, with the market forecast to expand at a compound annual growth rate (CAGR) of 5.2% between 2025 and 2035. The overall market size is expected to grow by nearly 1.7X during the same period, supported by increasing infrastructure investments, growing pipeline network expansions, and rising adoption of corrosion control technologies across diverse industrial applications.
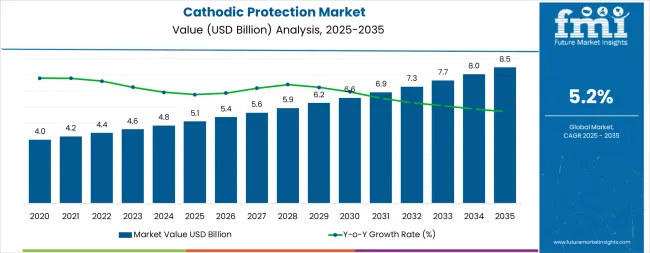
Between 2025 and 2030, the cathodic protection market is projected to expand from USD 5.1 billion to USD 6.6 billion, resulting in a value increase of USD 1.5 billion, which represents 44.1% of the total forecast growth for the decade. This phase of development will be shaped by increasing pipeline infrastructure development, rising adoption of digital monitoring systems, and growing demand for corrosion protection solutions in oil & gas and water treatment applications. Equipment manufacturers are expanding their instrumentation capabilities to address the growing demand for real-time monitoring solutions and enhanced asset integrity management.
| Metric | Value |
|---|---|
| Estimated Value in (2025E) | USD 5.1 billion |
| Forecast Value in (2035F) | USD 8.5 billion |
| Forecast CAGR (2025 to 2035) | 5.2% |
From 2030 to 2035, the market is forecast to grow from USD 6.6 billion to USD 8.5 billion, adding another USD 1.9 billion, which constitutes 55.9% of the overall ten-year expansion. This period is expected to be characterized by the expansion of impressed current systems, the integration of IoT-enabled remote monitoring technologies, and the development of advanced digital corrosion management platforms. The growing adoption of predictive maintenance strategies and smart infrastructure frameworks will drive demand for cathodic protection systems with enhanced operational efficiency and reduced lifecycle costs.
Between 2020 and 2025, the cathodic protection market experienced steady growth, driven by increasing infrastructure investment demand for corrosion control solutions and growing recognition of cathodic protection as essential technology for pipeline integrity and asset longevity. The market developed as oil & gas companies and utilities recognized the potential for cathodic protection systems to enhance asset reliability while reducing maintenance costs and operational risks. Technological advancement in remote monitoring systems and digital instrumentation began emphasizing the critical importance of maintaining corrosion control and infrastructure integrity in industrial asset management.
Market expansion is being supported by the increasing global infrastructure investment and the corresponding need for corrosion protection systems that can maintain asset integrity and operational reliability while supporting diverse industrial applications across various environments. Modern oil & gas companies and utilities are increasingly focused on implementing protection solutions that can reduce maintenance costs, minimize asset degradation, and provide consistent performance in corrosion control operations. Cathodic protection systems' proven ability to deliver enhanced asset longevity, reliable corrosion prevention, and versatile infrastructure protection capabilities make them essential technology for contemporary industrial asset management and infrastructure maintenance solutions.
The growing emphasis on asset integrity management and regulatory compliance is driving demand for cathodic protection systems that can support pipeline safety, reduce corrosion-related failures, and enable efficient infrastructure maintenance across varying environmental conditions. Industrial operators' preference for protection systems that combine effectiveness with operational reliability and cost-efficiency is creating opportunities for innovative cathodic protection implementations. The rising influence of digital monitoring technologies and predictive maintenance strategies is also contributing to increased adoption of cathodic protection systems that can provide advanced operational control without compromising protection performance or system reliability.
The cathodic protection market is poised for steady growth and transformation. As infrastructure operators across both developed and emerging markets seek corrosion protection that is effective, reliable, automated, and cost-efficient, cathodic protection systems are gaining prominence not just as maintenance tools but as strategic infrastructure protection for asset longevity, operational reliability, regulatory compliance, and lifecycle cost optimization.
Rising infrastructure investment and industrial expansion in South Asia & Pacific, East Asia, and North America amplify demand, while providers are innovating with digital instrumentation, IoT-enabled monitoring, and predictive maintenance technologies.
Pathways like instrumentation advancement, impressed current system innovation, and predictive analytics promise strong margin uplift, especially in developed markets. Geographic expansion and application diversification will capture volume, particularly where aging infrastructure requires rehabilitation or regulatory requirements are tightening.
The market is segmented by solution, application, type, and region. By solution, the market is divided into products (anodes, power supplies, junction boxes, test stations, remote monitors, coating, instrumentation) and services (inspection, design & construction, maintenance). By application, it covers pipelines, storage facilities, processing plants, water & wastewater, transportation, bridges, airports, fuelling systems, metros, building, and others. By type, it is segmented into galvanic (sacrificial anodes) and impressed current. Regionally, the market is divided into North America, Latin America, Western Europe, Eastern Europe, East Asia, South Asia & Pacific, and Middle East & Africa.
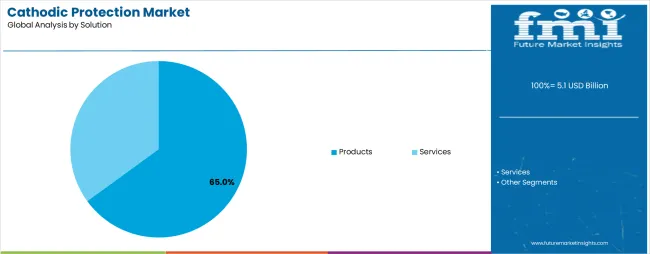
The instrumentation segment is projected to record the highest CAGR of 6.5% during 2025-2035, establishing its position as the fastest-growing solution category. Infrastructure operators and industrial companies increasingly utilize advanced instrumentation for their superior monitoring capabilities, real-time data collection, and predictive analytics functionality in corrosion control applications across pipeline networks, storage facilities, and industrial infrastructure. Instrumentation technology's advanced sensor capabilities and consistent data output directly address the industrial requirements for continuous monitoring and predictive maintenance in complex corrosion protection systems.
This solution segment represents the future of cathodic protection operations, as it provides the technology with the greatest data insights and established performance benefits across multiple applications and monitoring scenarios. Service provider investments in enhanced instrumentation systems and IoT connectivity continue to strengthen adoption among operators and utilities. With companies prioritizing predictive maintenance and real-time monitoring, instrumentation solutions align with both operational efficiency objectives and regulatory compliance requirements, making them the preferred component of comprehensive cathodic protection management strategies.
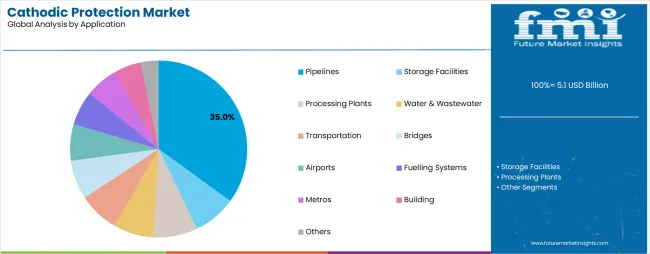
Pipelines is projected to represent 45% of cathodic protection demand in 2025, underscoring its critical role as the primary application of corrosion protection systems for oil & gas transmission and distribution networks. Pipeline operators prefer cathodic protection systems for their effectiveness, reliability, and ability to prevent corrosion-related failures while supporting operational safety and regulatory compliance. Positioned as essential infrastructure protection for modern pipeline operations, cathodic protection offers both technical advantages and operational benefits.
The segment is supported by continuous innovation in pipeline expansion projects and the growing availability of advanced protection technologies that enable effective corrosion control with enhanced monitoring capabilities. Pipeline companies are investing in integrity management programs to support large-scale infrastructure protection and regulatory compliance. As energy infrastructure becomes more extensive and pipeline integrity requirements increase, pipeline applications will continue to dominate the market while supporting advanced protection strategies and asset management initiatives.
The cathodic protection market is advancing steadily due to increasing infrastructure investment demand for corrosion control and growing adoption of asset integrity management systems that provide enhanced protection and operational reliability across diverse industrial applications. However, the market faces challenges, including high initial installation costs, complex system design requirements, and the need for specialized technical expertise. Innovation in digital monitoring technologies and remote management solutions continues to influence system development and market expansion patterns.
The growing expansion of pipeline networks and industrial infrastructure development is enabling equipment manufacturers to develop cathodic protection systems that provide superior corrosion control, enhanced asset longevity, and reliable performance in diverse environmental conditions. Advanced protection systems provide improved corrosion prevention while allowing more effective asset management and consistent operational delivery across various applications and infrastructure requirements. Manufacturers are increasingly recognizing the competitive advantages of comprehensive protection capabilities for infrastructure reliability and asset integrity positioning.
Modern cathodic protection system providers are incorporating IoT connectivity and digital monitoring platforms to enhance operational visibility, optimize protection performance, and ensure consistent system delivery to infrastructure operators. These technologies improve operational efficiency while enabling new applications, including predictive maintenance integration and automated corrosion management solutions. Advanced technology integration also allows providers to support premium service positioning and lifecycle optimization beyond traditional protection system supply.
| Country | CAGR (2025-2035) |
|---|---|
| India | 7% |
| China | 6% |
| Brazil | 5.7% |
| Canada | 5.5% |
| United States | 5% |
| Germany | 4.8% |
| United Kingdom | 4.5% |
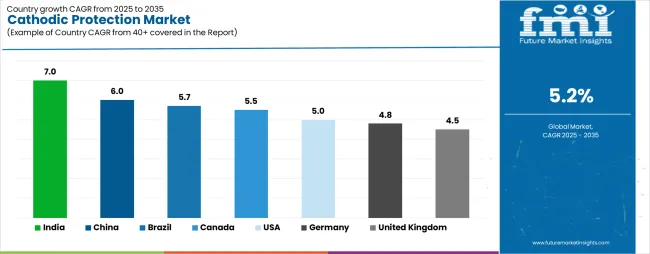
The cathodic protection market is experiencing steady growth globally, with India leading at a 7% CAGR through 2035, driven by extensive infrastructure development, growing pipeline expansion, and significant investment in oil & gas infrastructure modernization. China follows at 6%, supported by massive petrochemical investments, pipeline network development, and growing adoption of advanced corrosion control systems. Brazil records 5.7%, focusing on offshore oil & gas infrastructure and pipeline rehabilitation. Canada demonstrates 5.5% growth, supported by energy infrastructure expansion. United States demonstrates 5% growth, supported by aging infrastructure maintenance and regulatory compliance. Germany shows 4.8% growth, emphasizing industrial applications and environmental compliance. United Kingdom demonstrates 4.5% growth, supported by offshore wind development and infrastructure modernization.
The report covers an in-depth analysis of 40+ countries; seven top-performing countries are highlighted below.
Revenue from cathodic protection systems in India is projected to exhibit exceptional growth with a CAGR of 7% through 2035, driven by extensive infrastructure development programs and rapidly growing oil & gas pipeline expansion supported by government energy security initiatives. The country's ambitious industrial development targets and increasing investment in petrochemical infrastructure are creating substantial demand for advanced cathodic protection solutions. Major energy companies and infrastructure operators are establishing comprehensive protection systems to serve both domestic pipeline networks and industrial facility requirements.
Revenue from cathodic protection systems in China is expanding at a CAGR of 6%, supported by the country's massive petrochemical investments, extensive pipeline network development, and increasing adoption of advanced corrosion control technologies. The country's comprehensive energy strategy and growing industrial infrastructure are driving sophisticated protection capabilities. State energy companies and industrial operators are establishing extensive protection systems to address the growing demand for effective corrosion control and asset integrity management.
Revenue from cathodic protection systems in Brazil is growing at a CAGR of 5.7%, driven by expanding offshore oil & gas operations, increasing pipeline rehabilitation requirements, and growing investment in energy infrastructure modernization. The country's extensive offshore energy resources and emphasis on infrastructure improvement are supporting demand for advanced cathodic protection technologies across major energy production regions. Energy companies and pipeline operators are establishing comprehensive protection capabilities to serve both domestic energy development and infrastructure maintenance markets.
Revenue from cathodic protection systems in Canada is expanding at a CAGR of 5.5%, supported by the country's extensive energy infrastructure, pipeline network expansion, and strategic investment in asset integrity management programs. Canada's established energy sector and emphasis on regulatory compliance are driving demand for reliable cathodic protection technologies across major pipeline corridors. Energy companies are investing in comprehensive protection systems to serve both domestic energy transportation and export infrastructure requirements.
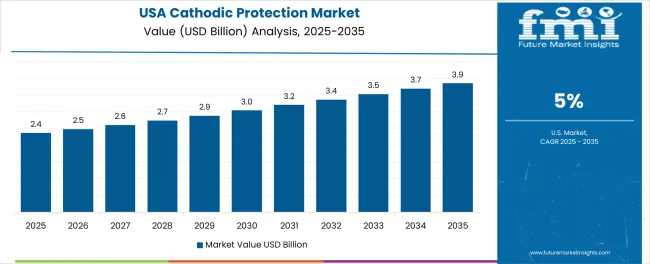
Revenue from cathodic protection systems in the United States is expanding at a CAGR of 5%, supported by the country's extensive aging infrastructure, comprehensive regulatory frameworks, and strategic investment in pipeline integrity management. The US established energy infrastructure and emphasis on safety compliance are driving demand for cathodic protection technologies across major pipeline networks. Energy companies and utilities are investing in protection system upgrades to serve both domestic energy transportation and regulatory compliance requirements.
Revenue from cathodic protection systems in Germany is expanding at a CAGR of 4.8%, supported by the country's advanced industrial infrastructure, comprehensive environmental regulations, and strategic investment in facility protection systems. Germany's established industrial sector and emphasis on environmental compliance are driving demand for cathodic protection technologies across major industrial facilities. Manufacturing companies and utilities are investing in protection systems to serve both domestic industrial operations and environmental compliance requirements.
Revenue from cathodic protection systems in the United Kingdom is expanding at a CAGR of 4.5%, supported by the country's offshore wind development, infrastructure modernization programs, and strategic investment in marine protection systems. The UK established offshore industry and emphasis on renewable energy infrastructure are driving demand for cathodic protection technologies across major offshore projects. Energy companies are investing in protection systems to serve both domestic renewable energy development and offshore infrastructure requirements.
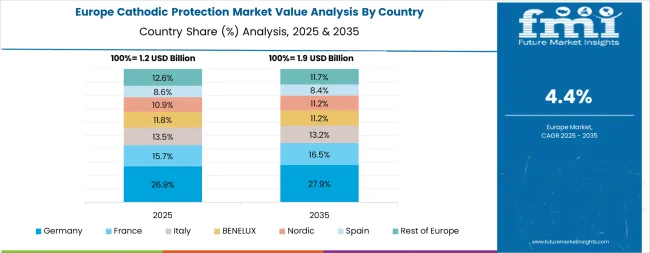
The cathodic protection market in Europe is projected to grow from USD 1.3 billion in 2025 to USD 2.1 billion by 2035, registering a CAGR of 5% over the forecast period. Germany is expected to maintain its leadership position with a 24% market share in 2025, maintaining 24% by 2035, supported by its advanced industrial infrastructure, comprehensive environmental regulations, and extensive chemical processing facilities serving European industrial markets.
United Kingdom holds a 16% share in 2025, expected to maintain 15.5% by 2035, supported by offshore wind development and pipeline infrastructure but facing challenges from economic constraints and competitive pressures from continental providers. Netherlands commands a 14% share in 2025, projected to reach 14.2% by 2035, while France accounts for 12% in 2025, expected to reach 12.1% by 2035. Italy maintains an 8% share in 2025, growing to 8.1% by 2035. The Rest of Europe region, including Nordic countries, Eastern European markets, Belgium, Spain, and other European countries, is anticipated to gain momentum, expanding its collective share from 8% to 7.1% by 2035, attributed to increasing infrastructure investment across Nordic countries and growing industrial facility protection across various European markets implementing corrosion control programs.
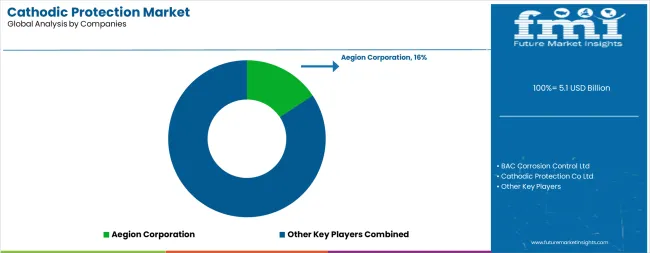
The cathodic protection market is characterized by competition among established corrosion control specialists, integrated infrastructure service providers, and technology-focused monitoring companies. Companies are investing in advanced instrumentation research, digital monitoring development, system integration optimization, and comprehensive service portfolios to deliver effective, reliable, and cost-efficient cathodic protection solutions. Innovation in IoT connectivity, remote monitoring capabilities, and predictive analytics integration is central to strengthening market position and competitive advantage.
Aegion Corporation leads the market with a strong market share, offering comprehensive integrity management solutions with a focus on pipeline and infrastructure applications. BAC Corrosion Control Ltd provides specialized impressed-current systems with an emphasis on advanced monitoring and diagnostics capabilities. Cathodic Protection Co Ltd delivers offshore and marine protection solutions with a focus on harsh environment applications and specialized installations. CMP Europe specializes in automated monitoring systems and municipal infrastructure applications. Farwest Corrosion Control Company focuses on pipeline protection services and remote monitoring solutions. Imenco AS offers marine and offshore protection systems with emphasis on subsea applications and advanced materials.
| Items | Values |
|---|---|
| Quantitative Units (2025) | USD 5.1 billion |
| Solution | Products (Anodes, Power Supplies, Junction Boxes, Test Stations, Remote Monitors, Coating, Instrumentation), Services (Inspection, Design & Construction, Maintenance) |
| Application | Pipelines, Storage Facilities, Processing Plants, Water & Wastewater, Transportation, Bridges, Airports, Fuelling Systems, Metros, Building, Others |
| Type | Galvanic (Sacrificial Anodes), Impressed Current |
| Regions Covered | North America, Latin America, Western Europe, Eastern Europe, East Asia, South Asia & Pacific, Middle East & Africa |
| Countries Covered | United States, China, India, Brazil, Germany, United Kingdom, Canada and 40+ countries |
| Key Companies Profiled | Aegion Corporation, BAC Corrosion Control Ltd, Cathodic Protection Co Ltd, CMP Europe, Farwest Corrosion Control Company, and Imenco AS |
| Additional Attributes | System sales by solution and application category, regional demand trends, competitive landscape, technological advancements in monitoring systems, instrumentation innovation, digital integration development, and asset integrity optimization |
The global cathodic protection market is estimated to be valued at USD 5.1 billion in 2025.
The market size for the cathodic protection market is projected to reach USD 8.5 billion by 2035.
The cathodic protection market is expected to grow at a 5.2% CAGR between 2025 and 2035.
The key product types in cathodic protection market are products and services.
In terms of application, pipelines segment to command 35.0% share in the cathodic protection market in 2025.


Our Research Products

The "Full Research Suite" delivers actionable market intel, deep dives on markets or technologies, so clients act faster, cut risk, and unlock growth.

The Leaderboard benchmarks and ranks top vendors, classifying them as Established Leaders, Leading Challengers, or Disruptors & Challengers.

Locates where complements amplify value and substitutes erode it, forecasting net impact by horizon

We deliver granular, decision-grade intel: market sizing, 5-year forecasts, pricing, adoption, usage, revenue, and operational KPIs—plus competitor tracking, regulation, and value chains—across 60 countries broadly.

Spot the shifts before they hit your P&L. We track inflection points, adoption curves, pricing moves, and ecosystem plays to show where demand is heading, why it is changing, and what to do next across high-growth markets and disruptive tech

Real-time reads of user behavior. We track shifting priorities, perceptions of today’s and next-gen services, and provider experience, then pace how fast tech moves from trial to adoption, blending buyer, consumer, and channel inputs with social signals (#WhySwitch, #UX).

Partner with our analyst team to build a custom report designed around your business priorities. From analysing market trends to assessing competitors or crafting bespoke datasets, we tailor insights to your needs.
Supplier Intelligence
Discovery & Profiling
Capacity & Footprint
Performance & Risk
Compliance & Governance
Commercial Readiness
Who Supplies Whom
Scorecards & Shortlists
Playbooks & Docs
Category Intelligence
Definition & Scope
Demand & Use Cases
Cost Drivers
Market Structure
Supply Chain Map
Trade & Policy
Operating Norms
Deliverables
Buyer Intelligence
Account Basics
Spend & Scope
Procurement Model
Vendor Requirements
Terms & Policies
Entry Strategy
Pain Points & Triggers
Outputs
Pricing Analysis
Benchmarks
Trends
Should-Cost
Indexation
Landed Cost
Commercial Terms
Deliverables
Brand Analysis
Positioning & Value Prop
Share & Presence
Customer Evidence
Go-to-Market
Digital & Reputation
Compliance & Trust
KPIs & Gaps
Outputs
Full Research Suite comprises of:
Market outlook & trends analysis
Interviews & case studies
Strategic recommendations
Vendor profiles & capabilities analysis
5-year forecasts
8 regions and 60+ country-level data splits
Market segment data splits
12 months of continuous data updates
DELIVERED AS:
PDF EXCEL ONLINE
Cathodic Protection Industry Analysis in Japan Size, Growth, and Forecast (2025 to 2035)
Cathodic Protection Industry Analysis in South Korea Analysis - Size, Share, and Forecast Outlook 2025 to 2035
Competitive Overview of Cathodic Protection Market Share
Western Europe Cathodic Protection Market Trend Analysis Based on Solution, Type, Application, and Countries 2025 to 2035
Cathodic Acrylic Market Size and Share Forecast Outlook 2025 to 2035
Flu Protection Kits Market Size and Share Forecast Outlook 2025 to 2035
Eye Protection Equipment Market Size and Share Forecast Outlook 2025 to 2035
Teleprotection Market Growth – Trends & Forecast 2025 to 2035
ESD Protection Devices Market Insights – Trends & Demand 2023-2033
Head Protection Equipment Market Forecast Outlook 2025 to 2035
Fire Protection Materials Market Size and Share Forecast Outlook 2025 to 2035
Fall Protection Market Size and Share Forecast Outlook 2025 to 2035
CBRN Protection Equipment Market Size and Share Forecast Outlook 2025 to 2035
Fire Protection System Pipes Market Size and Share Forecast Outlook 2025 to 2035
DDoS Protection Market Size and Share Forecast Outlook 2025 to 2035
Fire Protection Systems for Industrial Cooking Market Growth - Trends & Forecast 2025 to 2035
DDoS Protection & Mitigation Security Market Growth - Trends & Forecast through 2034
Data Protection as a Service (DPaaS) Market
Surge Protection Device Market Size and Share Forecast Outlook 2025 to 2035
Brand Protection Tools Market Analysis - Size, Share, and Forecast 2025 to 2035

Thank you!
You will receive an email from our Business Development Manager. Please be sure to check your SPAM/JUNK folder too.
Chat With
MaRIA