Reports

- Global Locations -

Headquarters

Future Market Insights, Inc.

Christiana Corporate, 200
Continental Drive, Suite 401,
Newark, Delaware - 19713,
United States

T: +1-347-918-3531

Americas

Future Market Insights, Inc.

616 Corporate Way, Suite 2-9018,
Valley Cottage, NY 10989, United States

MEA

Future Market Insights

1602-6 Jumeirah Bay X2 Tower, Plot No: JLT-PH2-X2A,
Jumeirah Lakes Towers, Dubai,
United Arab Emirates

Europe

Future Market Insights

3rd Floor, 207 Regent Street,
W1B 3HH London
United Kingdom

T: + 44 (0) 20 8123 9659

Asia Pacific

Future Market Insights

IndiaLand Global Tech Park, Unit UG-1, Behind Grand HighStreet, Phase 1, Hinjawadi, MH, Pune – 411057, India

Cathodic Protection Scope in Japan from (2024 to 2034)

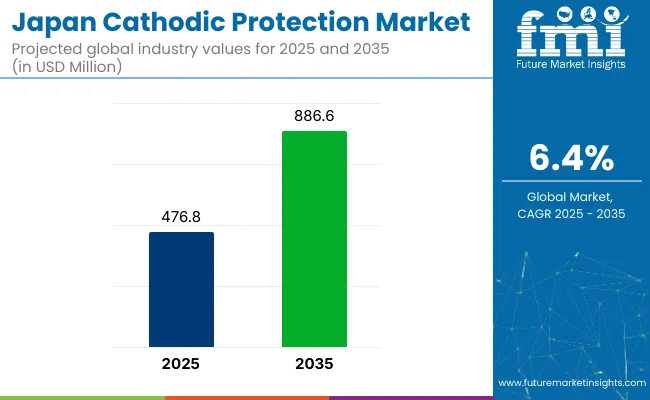
In 2024, cathodic protection demand in Japan is anticipated to reach a value of US$ 448.1 million. The demand for cathodic protection in Japan is likely to expand with a 6.40% CAGR from 2024 to 2034. The industry is projected to attain US$ 833.3 million by 2034.

Key Insights that Promotes the Demand of Cathodic Protection in Japan

  • Integration of technology- Companies are increasingly moving towards the use of IoT as well as advanced data analytics for predictive maintenance and real time monitoring in cathodic protection systems.
  • Collaborative partnerships- An increasing number of cathodic protection companies and infrastructure developers are forming cooperative relationships, which enable customized solutions and all-encompassing corrosion prevention plans for a range of infrastructure requirements in Japan.
Attributes Details
Industry Size in 2024 US$ 448.1 million
Expected Industry Size in 2034 US$ 833.3 million
Forecasted CAGR between 2024 to 2034 6.40%

Don't pay for what you don't need

Customize your report by selecting specific countries or regions and save 30%!

Key Trends Influencing Demand for Cathodic Protection in Japan

  • The industry is seeing a shift toward nano coating technologies, which provide incredibly thin protective layers to offer enhanced corrosion resistance. This innovation meets the demand for novel approaches to the best possible infrastructure protection in Japan.
  • Cathodic protection trends have adjusted to the seismic activity in Japan by emphasizing solutions that improve infrastructure resilience against earthquakes in addition to preventing corrosion, therefore guaranteeing long term structural integrity within this seismically active area.

Comparative View of Adjacent Products

The table below will compare the cathodic protection ecosystem in Japan with the global cathodic protection market and the cathodic protection ecosystem in Korea. Japan is anticipated to gain a significant share of the global sales of cathodic protection.

Cathodic Protection Ecosystem in Japan:

Attributes Details
Forecast CAGR between 2024 to 2034 6.40%
Industry Size in 2024 US$ 448.1 million
Key trend
  • In order to improve the overall effectiveness of corrosion prevention systems, the Japan cathodic protection industry is seeing a trend toward the integration of IoT technologies for data analytics, real time monitoring, and remote management.
Key challenge
  • The industry must cope with the problem of aging infrastructure, which calls for significant retrofitting and creative solutions to guarantee efficient cathodic protection, particularly in older pipelines and facilities.

Global cathodic protection market:

Attributes Details
Forecast CAGR between 2024 to 2034 4.70%
Industry Size in 2024 US$ 1,302.70 million
Key trend
  • Growing use of eco friendly cathodic protection techniques is indicative of a global movement toward sustainability.
Key challenge
  • The protection of complex and varied infrastructure is a challenge to the global cathodic protection industry, requiring flexible solutions.

Cathodic Protection Ecosystem in Korea:

Attributes Details
Forecast CAGR between 2024 to 2034 5%
Industry Size in 2024 US$ 178 million
Key trend
  • A trend in the Korea industry is the integration of smart technology for effective monitoring, which improves the accuracy and efficiency of cathodic protection systems.
Key challenge
  • The fast industrial development in Korea presents a difficulty for cathodic protection, necessitating strategies to handle the growing intricacy and variety of infrastructure.
Nikhil Kaitwade
Nikhil Kaitwade

Principal Consultant

Talk to Analyst

Find your sweet spots for generating winning opportunities in this market.

Category wise Insights

Products are likely to be in High Demand during the Forecast Period

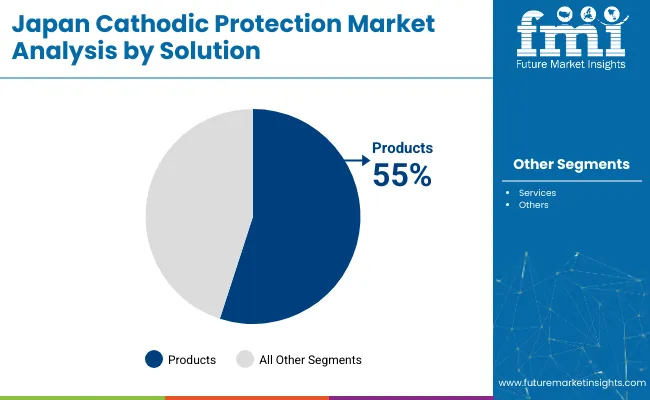
In 2024, the products segment is likely to gain a share of 50.90% in Japan.

Solution Type Products
Expected share in 2024 50.9%

The cathodic protection industry in Japan is expected to favor products owing to their efficiency and adaptability. Advanced anodes as well as tracking devices are examples of products that provide customizable solutions in response to industry demands for specific corrosion prevention methods.

These products, which prioritize technical innovation, offer accurate and tailored security for many types of infrastructure. Their longevity is consistent with the long term sustainability commitment of Japan, which makes them the go to options for protecting infrastructure and assets against corrosion in a variety of industrial settings around the country.

Impressed Current is forecast to be Preferred by the Companies

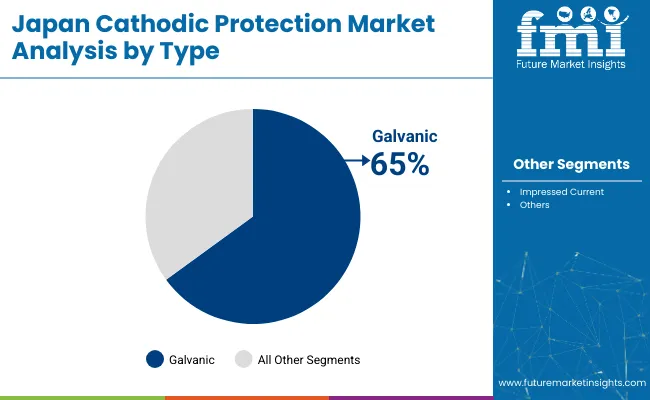
The impressed current segment in Japan cathodic protection industry is estimated to garner a 60.7% share in 2024.

Type Segment Impressed Current
Expected share in 2024 60.7%

Impressive current is among the most preferred method for cathodic protection in Japan owing to its versatility and efficiency in a variety of circumstances. This method is appropriate for complicated structures as well as high risk corrosion regions since it provides fine control over the protective process. Impressed current systems are adaptable, especially considering the diverse industrial landscape of Japan, where infrastructure differs in exposure and composition. It is the ideal choice for protecting vital assets, pipes, and structures from corrosion in the diverse and demanding operational settings of Japan since it can also be customized to provide the most effective defense.

Region wise Insights

Manufacturers dealing with cathodic protection have made significant strides in two Japan regions, the Chubu and Kanto

Regions Profiled

  • Chubu
  • Kanto

Rise in Urbanization and Industrialization to Boost Sales in Kanto

The rapid urbanization and industrialization in the highly populated Kanto region of Japan is the main driver of the demand for cathodic protection in this area. Preventing corrosion becomes crucial as vital infrastructure, such as storage tanks and pipes, is essential to the growth of the region.

Strict laws, growing understanding of the financial effects of corrosion related damage, and a dedication to resilient infrastructure, also fuel demand. Effective cathodic protection technologies are increasingly needed to maintain the integrity of the infrastructure as long as Kanto remains an important economic player in Japan.

Chubu, a Manufacturing Hub, is likely to Accelerate Demand

Chubu is a major industrial and manufacturing hub, which drives the need for cathodic protection in the region. The concentration of refineries, chemical factories, and large pipeline networks makes effective corrosion protection techniques imperative.

Chubu is also more vulnerable to corrosion from salt exposure due to its closeness to coastal regions. The use of advanced cathodic protection technology becomes essential as companies seek for environmental sustainability along with operational efficiency.

Get the data you need at a Fraction of the cost

Personalize your report by choosing insights you need
and save 40%!

Competitive Landscape

Companies in the Japan cathodic protection industry are actively using state of the art technology to prevent corrosion in infrastructure. Leading companies concentrate on creating advanced cathodic protection services and solutions for storage tanks, pipelines, and other vital infrastructure. These solutions protect the lifespan of infrastructure by preventing corrosion through the use of impressed current systems, sacrificial anodes, and monitoring technology.

Common techniques include working with research institutes and following strict rules and regulations. In Japan, companies are also investigating new materials and techniques, focusing on ecologically friendly methods to improve the efficiency and long term viability of cathodic protection systems.

Some of the Important Players in Japan Dealing with Cathodic Protection

  • The Nippon Corrosion Engineering Co., Ltd
  • Nakabohtec Corrosion Protecting Co
  • Aegion Corporation
  • BAC Corrosion Control Ltd
  • Cathodic Protection Co Ltd
  • CMP Europe
  • Farwest Corrosion Control Company
  • Imenco AS
  • James Fisher
  • MATCOR, Inc

Recent Developments Observed in Japan cathodic protection Ecosystem

Company Product Portfolio
Cathodic Protection Co Ltd.
  • In 2023, a partnership was formed between Cathodic Protection Co. Ltd and Anglian Water.
  • CPCL will guarantee the lifetime and durability of the infrastructure by supplying complete cathodic protection along the steel portions of the pipeline.
Farwest Corrosion Control Company
  • In 2019, Farwest Corrosion Control Company launched the DCPro, an enhanced cathodic protection power supply.
  • In the domain of cathodic protection as well as corrosion control services for underwater and underground infrastructure, storage systems, and other submerged metallic structures, Farwest has immense potential.
  • When utilized in cathodic protection systems, the DCPro significantly improves upon the way conventional rectifiers convert AC to DC electricity.

Scope of the Report

Attribute Details
Estimated Industry Size in 2024 US$ 448.1 million
Projected Industry Size in 2034 US$ 833.3 million
Attributed CAGR between 2024 and 2034 6.40%
Historical Analysis of Demand for cathodic protection in Japan Countries 2019 to 2023
Forecast Period 2024 to 2034
Report Coverage Industry size, industry trends, analysis of key factors influencing cathodic protection in Japan, insights on global players and their industry strategy in Japan, ecosystem analysis of local and regional Japan providers
Key Countries within Japan Analyzed while Studying Opportunities for cathodic protection in Japan
  • Kanto
  • Chubu
  • Kinki
  • Kyushu & Okinawa
  • Tohoku
  • Rest of Japan
Key Companies Profiled
  • The Nippon Corrosion Engineering Co. Ltd
  • Nakabohtec Corrosion Protecting Co
  • Aegion Corporation
  • BAC Corrosion Control Ltd
  • Cathodic Protection Co Ltd
  • CMP Europe
  • Farwest Corrosion Control Company
  • Imenco AS
  • James Fisher
  • MATCOR Inc.

Key Segments

By Solution:

  • Products
    • Anodes
    • Power Supplies
    • Junction Boxes
    • Test Stations
    • Remote Monitors
    • Coating
    • Instrumentation
  • Services
    • Inspection
    • Design & Construction
    • Maintenance

By Type:

  • Galvanic (Sacrificial Anodes)
  • Impressed Current

By Application:

  • Pipelines
  • Storage Facilities
  • Processing Plants
  • Water & Wastewater
  • Transportation
  • Bridges
  • Airports
  • Fuelling Systems
  • Metros
  • Building
  • Others

By Region:

  • Kanto
  • Chubu
  • Kinki
  • Kyushu & Okinawa
  • Tohoku
  • Rest of Japan

Frequently Asked Questions

In 2024, how profitable will be the demand for Cathodic Protection in Japan?

The sales of cathodic protection are poised to reach US$ 448.1 million by 2024.

What will be the overall value share of Cathodic Protection in Japan by 2034?

In 2034, the total value of the cathodic protection industry in Japan is predicted to reach US$ 833.3 million.

What is the expected growth rate of the Japan Cathodic Protection Industry until 2034?

From 2024 to 2034, the Japan cathodic protection industry is likely to garner a 6.40% CAGR.

Which solution type of Cathodic Protection is likely to gain popularity?

The products segment is likely to take up 50.9% of shares in 2024.

Table of Content

1. Executive Summary

    1.1. Japan Market Outlook

    1.2. Demand-side Trends

    1.3. Supply-side Trends

    1.4. Technology Roadmap Analysis

    1.5. Analysis and Recommendations

2. Market Overview

    2.1. Market Coverage / Taxonomy

    2.2. Market Definition / Scope / Limitations

3. Market Background

    3.1. Market Dynamics

        3.1.1. Drivers

        3.1.2. Restraints

        3.1.3. Opportunity

        3.1.4. Trends

    3.2. Scenario Forecast

        3.2.1. Demand in Optimistic Scenario

        3.2.2. Demand in Likely Scenario

        3.2.3. Demand in Conservative Scenario

    3.3. Opportunity Map Analysis

    3.4. Investment Feasibility Matrix

    3.5. PESTLE and Porter’s Analysis

    3.6. Regulatory Landscape

        3.6.1. By Key Regions

    3.7. Regional Parent Market Outlook

4. Japan Industry Analysis and Outlook 2019 to 2023 and Forecast, 2024 to 2034

    4.1. Historical Market Size Value (US$ Million) Analysis, 2019 to 2023

    4.2. Current and Future Market Size Value (US$ Million) Projections, 2024 to 2034

        4.2.1. Y-o-Y Growth Trend Analysis

        4.2.2. Absolute $ Opportunity Analysis

5. Japan Industry Analysis and Outlook 2019 to 2023 and Forecast 2024 to 2034, By Solution

    5.1. Introduction / Key Findings

    5.2. Historical Market Size Value (US$ Million) Analysis By Solution, 2019 to 2023

    5.3. Current and Future Market Size Value (US$ Million) Analysis and Forecast By Solution, 2024 to 2034

        5.3.1. Products

            5.3.1.1. Anodes

            5.3.1.2. Power Supplies

            5.3.1.3. Junction Boxes

            5.3.1.4. Test Stations

            5.3.1.5. Remote Monitors

            5.3.1.6. Coating

            5.3.1.7. Instrumentation

        5.3.2. Services

            5.3.2.1. Inspection

            5.3.2.2. Design & Construction

            5.3.2.3. Maintenance

    5.4. Y-o-Y Growth Trend Analysis By Solution, 2019 to 2023

    5.5. Absolute $ Opportunity Analysis By Solution, 2024 to 2034

6. Japan Industry Analysis and Outlook 2019 to 2023 and Forecast 2024 to 2034, By Type

    6.1. Introduction / Key Findings

    6.2. Historical Market Size Value (US$ Million) Analysis By Type, 2019 to 2023

    6.3. Current and Future Market Size Value (US$ Million) Analysis and Forecast By Type, 2024 to 2034

        6.3.1. Galvanic (Sacrificial Anodes)

        6.3.2. Impressed Current

    6.4. Y-o-Y Growth Trend Analysis By Type, 2019 to 2023

    6.5. Absolute $ Opportunity Analysis By Type, 2024 to 2034

7. Japan Industry Analysis and Outlook 2019 to 2023 and Forecast 2024 to 2034, By Application

    7.1. Introduction / Key Findings

    7.2. Historical Market Size Value (US$ Million) Analysis By Application, 2019 to 2023

    7.3. Current and Future Market Size Value (US$ Million) Analysis and Forecast By Application, 2024 to 2034

        7.3.1. Pipelines

        7.3.2. Storage Facilities

        7.3.3. Processing Plants

        7.3.4. Water & Wastewater

        7.3.5. Transportation

        7.3.6. Bridges

        7.3.7. Airports

        7.3.8. Fuelling Systems

        7.3.9. Metros

        7.3.10. Building

        7.3.11. Others

    7.4. Y-o-Y Growth Trend Analysis By Application, 2019 to 2023

    7.5. Absolute $ Opportunity Analysis By Application, 2024 to 2034

8. Japan Industry Analysis and Outlook 2019 to 2023 and Forecast 2024 to 2034, By Region

    8.1. Introduction

    8.2. Historical Market Size Value (US$ Million) Analysis By Region, 2019 to 2023

    8.3. Current Market Size Value (US$ Million) Analysis and Forecast By Region, 2024 to 2034

        8.3.1. Kanto

        8.3.2. Chubu

        8.3.3. Kinki

        8.3.4. Kyushu & Okinawa

        8.3.5. Tohoku

        8.3.6. Rest of Japan

    8.4. Market Attractiveness Analysis By Region

9. Kanto Industry Analysis and Outlook 2019 to 2023 and Forecast 2024 to 2034

    9.1. Historical Market Size Value (US$ Million) Trend Analysis By Market Taxonomy, 2019 to 2023

    9.2. Market Size Value (US$ Million) Forecast By Market Taxonomy, 2024 to 2034

        9.2.1. By Solution

        9.2.2. By Type

        9.2.3. By Application

    9.3. Market Attractiveness Analysis

        9.3.1. By Solution

        9.3.2. By Type

        9.3.3. By Application

    9.4. Key Takeaways

10. Chubu Industry Analysis and Outlook 2019 to 2023 and Forecast 2024 to 2034

    10.1. Historical Market Size Value (US$ Million) Trend Analysis By Market Taxonomy, 2019 to 2023

    10.2. Market Size Value (US$ Million) Forecast By Market Taxonomy, 2024 to 2034

        10.2.1. By Solution

        10.2.2. By Type

        10.2.3. By Application

    10.3. Market Attractiveness Analysis

        10.3.1. By Solution

        10.3.2. By Type

        10.3.3. By Application

    10.4. Key Takeaways

11. Kinki Industry Analysis and Outlook 2019 to 2023 and Forecast 2024 to 2034

    11.1. Historical Market Size Value (US$ Million) Trend Analysis By Market Taxonomy, 2019 to 2023

    11.2. Market Size Value (US$ Million) Forecast By Market Taxonomy, 2024 to 2034

        11.2.1. By Solution

        11.2.2. By Type

        11.2.3. By Application

    11.3. Market Attractiveness Analysis

        11.3.1. By Solution

        11.3.2. By Type

        11.3.3. By Application

    11.4. Key Takeaways

12. Kyushu & Okinawa Industry Analysis and Outlook 2019 to 2023 and Forecast 2024 to 2034

    12.1. Historical Market Size Value (US$ Million) Trend Analysis By Market Taxonomy, 2019 to 2023

    12.2. Market Size Value (US$ Million) Forecast By Market Taxonomy, 2024 to 2034

        12.2.1. By Solution

        12.2.2. By Type

        12.2.3. By Application

    12.3. Market Attractiveness Analysis

        12.3.1. By Solution

        12.3.2. By Type

        12.3.3. By Application

    12.4. Key Takeaways

13. Tohoku Industry Analysis and Outlook 2019 to 2023 and Forecast 2024 to 2034

    13.1. Historical Market Size Value (US$ Million) Trend Analysis By Market Taxonomy, 2019 to 2023

    13.2. Market Size Value (US$ Million) Forecast By Market Taxonomy, 2024 to 2034

        13.2.1. By Solution

        13.2.2. By Type

        13.2.3. By Application

    13.3. Market Attractiveness Analysis

        13.3.1. By Solution

        13.3.2. By Type

        13.3.3. By Application

    13.4. Key Takeaways

14. Rest of Japan Industry Analysis and Outlook 2019 to 2023 and Forecast 2024 to 2034

    14.1. Historical Market Size Value (US$ Million) Trend Analysis By Market Taxonomy, 2019 to 2023

    14.2. Market Size Value (US$ Million) Forecast By Market Taxonomy, 2024 to 2034

        14.2.1. By Solution

        14.2.2. By Type

        14.2.3. By Application

    14.3. Market Attractiveness Analysis

        14.3.1. By Solution

        14.3.2. By Type

        14.3.3. By Application

    14.4. Key Takeaways

15. Market Structure Analysis

    15.1. Competition Dashboard

    15.2. Competition Benchmarking

    15.3. Market Share Analysis of Top Players

        15.3.1. By Regional

        15.3.2. By Solution

        15.3.3. By Type

        15.3.4. By Application

16. Competition Analysis

    16.1. Competition Deep Dive

        16.1.1. The Nippon Corrosion Engineering Co., Ltd

            16.1.1.1. Overview

            16.1.1.2. Product Portfolio

            16.1.1.3. Profitability by Market Segments

            16.1.1.4. Sales Footprint

            16.1.1.5. Strategy Overview

                16.1.1.5.1. Marketing Strategy

        16.1.2. Nakabohtec Corrosion Protecting Co

            16.1.2.1. Overview

            16.1.2.2. Product Portfolio

            16.1.2.3. Profitability by Market Segments

            16.1.2.4. Sales Footprint

            16.1.2.5. Strategy Overview

                16.1.2.5.1. Marketing Strategy

        16.1.3. Aegion Corporation

            16.1.3.1. Overview

            16.1.3.2. Product Portfolio

            16.1.3.3. Profitability by Market Segments

            16.1.3.4. Sales Footprint

            16.1.3.5. Strategy Overview

                16.1.3.5.1. Marketing Strategy

        16.1.4. BAC Corrosion Control Ltd

            16.1.4.1. Overview

            16.1.4.2. Product Portfolio

            16.1.4.3. Profitability by Market Segments

            16.1.4.4. Sales Footprint

            16.1.4.5. Strategy Overview

                16.1.4.5.1. Marketing Strategy

        16.1.5. Co Ltd

            16.1.5.1. Overview

            16.1.5.2. Product Portfolio

            16.1.5.3. Profitability by Market Segments

            16.1.5.4. Sales Footprint

            16.1.5.5. Strategy Overview

                16.1.5.5.1. Marketing Strategy

        16.1.6. CMP Europe

            16.1.6.1. Overview

            16.1.6.2. Product Portfolio

            16.1.6.3. Profitability by Market Segments

            16.1.6.4. Sales Footprint

            16.1.6.5. Strategy Overview

                16.1.6.5.1. Marketing Strategy

        16.1.7. Farwest Corrosion Control Compan

            16.1.7.1. Overview

            16.1.7.2. Product Portfolio

            16.1.7.3. Profitability by Market Segments

            16.1.7.4. Sales Footprint

            16.1.7.5. Strategy Overview

                16.1.7.5.1. Marketing Strategy

        16.1.8. Imenco AS

            16.1.8.1. Overview

            16.1.8.2. Product Portfolio

            16.1.8.3. Profitability by Market Segments

            16.1.8.4. Sales Footprint

            16.1.8.5. Strategy Overview

                16.1.8.5.1. Marketing Strategy

        16.1.9. James Fisher

            16.1.9.1. Overview

            16.1.9.2. Product Portfolio

            16.1.9.3. Profitability by Market Segments

            16.1.9.4. Sales Footprint

            16.1.9.5. Strategy Overview

                16.1.9.5.1. Marketing Strategy

        16.1.10. MATCOR, Inc

            16.1.10.1. Overview

            16.1.10.2. Product Portfolio

            16.1.10.3. Profitability by Market Segments

            16.1.10.4. Sales Footprint

            16.1.10.5. Strategy Overview

                16.1.10.5.1. Marketing Strategy

17. Assumptions & Acronyms Used

18. Research Methodology

List of Tables

Table 1: Japan Industry Analysis and Outlook Value (US$ Million) Forecast by Region, 2019 to 2034

Table 2: Japan Industry Analysis and Outlook Value (US$ Million) Forecast by Solution, 2019 to 2034

Table 3: Japan Industry Analysis and Outlook Value (US$ Million) Forecast by Type, 2019 to 2034

Table 4: Japan Industry Analysis and Outlook Value (US$ Million) Forecast by Application, 2019 to 2034

Table 5: Kanto Industry Analysis and Outlook Value (US$ Million) Forecast by Solution, 2019 to 2034

Table 6: Kanto Industry Analysis and Outlook Value (US$ Million) Forecast by Type, 2019 to 2034

Table 7: Kanto Industry Analysis and Outlook Value (US$ Million) Forecast by Application, 2019 to 2034

Table 8: Chubu Industry Analysis and Outlook Value (US$ Million) Forecast by Solution, 2019 to 2034

Table 9: Chubu Industry Analysis and Outlook Value (US$ Million) Forecast by Type, 2019 to 2034

Table 10: Chubu Industry Analysis and Outlook Value (US$ Million) Forecast by Application, 2019 to 2034

Table 11: Kinki Industry Analysis and Outlook Value (US$ Million) Forecast by Solution, 2019 to 2034

Table 12: Kinki Industry Analysis and Outlook Value (US$ Million) Forecast by Type, 2019 to 2034

Table 13: Kinki Industry Analysis and Outlook Value (US$ Million) Forecast by Application, 2019 to 2034

Table 14: Kyushu & Okinawa Industry Analysis and Outlook Value (US$ Million) Forecast by Solution, 2019 to 2034

Table 15: Kyushu & Okinawa Industry Analysis and Outlook Value (US$ Million) Forecast by Type, 2019 to 2034

Table 16: Kyushu & Okinawa Industry Analysis and Outlook Value (US$ Million) Forecast by Application, 2019 to 2034

Table 17: Tohoku Industry Analysis and Outlook Value (US$ Million) Forecast by Solution, 2019 to 2034

Table 18: Tohoku Industry Analysis and Outlook Value (US$ Million) Forecast by Type, 2019 to 2034

Table 19: Tohoku Industry Analysis and Outlook Value (US$ Million) Forecast by Application, 2019 to 2034

Table 20: Rest of Japan Industry Analysis and Outlook Value (US$ Million) Forecast by Solution, 2019 to 2034

Table 21: Rest of Japan Industry Analysis and Outlook Value (US$ Million) Forecast by Type, 2019 to 2034

Table 22: Rest of Japan Industry Analysis and Outlook Value (US$ Million) Forecast by Application, 2019 to 2034

List of Charts

Figure 1: Japan Industry Analysis and Outlook Value (US$ Million) by Solution, 2024 to 2034

Figure 2: Japan Industry Analysis and Outlook Value (US$ Million) by Type, 2024 to 2034

Figure 3: Japan Industry Analysis and Outlook Value (US$ Million) by Application, 2024 to 2034

Figure 4: Japan Industry Analysis and Outlook Value (US$ Million) by Region, 2024 to 2034

Figure 5: Japan Industry Analysis and Outlook Value (US$ Million) Analysis by Region, 2019 to 2034

Figure 6: Japan Industry Analysis and Outlook Value Share (%) and BPS Analysis by Region, 2024 to 2034

Figure 7: Japan Industry Analysis and Outlook Y-o-Y Growth (%) Projections by Region, 2024 to 2034

Figure 8: Japan Industry Analysis and Outlook Value (US$ Million) Analysis by Solution, 2019 to 2034

Figure 9: Japan Industry Analysis and Outlook Value Share (%) and BPS Analysis by Solution, 2024 to 2034

Figure 10: Japan Industry Analysis and Outlook Y-o-Y Growth (%) Projections by Solution, 2024 to 2034

Figure 11: Japan Industry Analysis and Outlook Value (US$ Million) Analysis by Type, 2019 to 2034

Figure 12: Japan Industry Analysis and Outlook Value Share (%) and BPS Analysis by Type, 2024 to 2034

Figure 13: Japan Industry Analysis and Outlook Y-o-Y Growth (%) Projections by Type, 2024 to 2034

Figure 14: Japan Industry Analysis and Outlook Value (US$ Million) Analysis by Application, 2019 to 2034

Figure 15: Japan Industry Analysis and Outlook Value Share (%) and BPS Analysis by Application, 2024 to 2034

Figure 16: Japan Industry Analysis and Outlook Y-o-Y Growth (%) Projections by Application, 2024 to 2034

Figure 17: Japan Industry Analysis and Outlook Attractiveness by Solution, 2024 to 2034

Figure 18: Japan Industry Analysis and Outlook Attractiveness by Type, 2024 to 2034

Figure 19: Japan Industry Analysis and Outlook Attractiveness by Application, 2024 to 2034

Figure 20: Japan Industry Analysis and Outlook Attractiveness by Region, 2024 to 2034

Figure 21: Kanto Industry Analysis and Outlook Value (US$ Million) by Solution, 2024 to 2034

Figure 22: Kanto Industry Analysis and Outlook Value (US$ Million) by Type, 2024 to 2034

Figure 23: Kanto Industry Analysis and Outlook Value (US$ Million) by Application, 2024 to 2034

Figure 24: Kanto Industry Analysis and Outlook Value (US$ Million) Analysis by Solution, 2019 to 2034

Figure 25: Kanto Industry Analysis and Outlook Value Share (%) and BPS Analysis by Solution, 2024 to 2034

Figure 26: Kanto Industry Analysis and Outlook Y-o-Y Growth (%) Projections by Solution, 2024 to 2034

Figure 27: Kanto Industry Analysis and Outlook Value (US$ Million) Analysis by Type, 2019 to 2034

Figure 28: Kanto Industry Analysis and Outlook Value Share (%) and BPS Analysis by Type, 2024 to 2034

Figure 29: Kanto Industry Analysis and Outlook Y-o-Y Growth (%) Projections by Type, 2024 to 2034

Figure 30: Kanto Industry Analysis and Outlook Value (US$ Million) Analysis by Application, 2019 to 2034

Figure 31: Kanto Industry Analysis and Outlook Value Share (%) and BPS Analysis by Application, 2024 to 2034

Figure 32: Kanto Industry Analysis and Outlook Y-o-Y Growth (%) Projections by Application, 2024 to 2034

Figure 33: Kanto Industry Analysis and Outlook Attractiveness by Solution, 2024 to 2034

Figure 34: Kanto Industry Analysis and Outlook Attractiveness by Type, 2024 to 2034

Figure 35: Kanto Industry Analysis and Outlook Attractiveness by Application, 2024 to 2034

Figure 36: Chubu Industry Analysis and Outlook Value (US$ Million) by Solution, 2024 to 2034

Figure 37: Chubu Industry Analysis and Outlook Value (US$ Million) by Type, 2024 to 2034

Figure 38: Chubu Industry Analysis and Outlook Value (US$ Million) by Application, 2024 to 2034

Figure 39: Chubu Industry Analysis and Outlook Value (US$ Million) Analysis by Solution, 2019 to 2034

Figure 40: Chubu Industry Analysis and Outlook Value Share (%) and BPS Analysis by Solution, 2024 to 2034

Figure 41: Chubu Industry Analysis and Outlook Y-o-Y Growth (%) Projections by Solution, 2024 to 2034

Figure 42: Chubu Industry Analysis and Outlook Value (US$ Million) Analysis by Type, 2019 to 2034

Figure 43: Chubu Industry Analysis and Outlook Value Share (%) and BPS Analysis by Type, 2024 to 2034

Figure 44: Chubu Industry Analysis and Outlook Y-o-Y Growth (%) Projections by Type, 2024 to 2034

Figure 45: Chubu Industry Analysis and Outlook Value (US$ Million) Analysis by Application, 2019 to 2034

Figure 46: Chubu Industry Analysis and Outlook Value Share (%) and BPS Analysis by Application, 2024 to 2034

Figure 47: Chubu Industry Analysis and Outlook Y-o-Y Growth (%) Projections by Application, 2024 to 2034

Figure 48: Chubu Industry Analysis and Outlook Attractiveness by Solution, 2024 to 2034

Figure 49: Chubu Industry Analysis and Outlook Attractiveness by Type, 2024 to 2034

Figure 50: Chubu Industry Analysis and Outlook Attractiveness by Application, 2024 to 2034

Figure 51: Kinki Industry Analysis and Outlook Value (US$ Million) by Solution, 2024 to 2034

Figure 52: Kinki Industry Analysis and Outlook Value (US$ Million) by Type, 2024 to 2034

Figure 53: Kinki Industry Analysis and Outlook Value (US$ Million) by Application, 2024 to 2034

Figure 54: Kinki Industry Analysis and Outlook Value (US$ Million) Analysis by Solution, 2019 to 2034

Figure 55: Kinki Industry Analysis and Outlook Value Share (%) and BPS Analysis by Solution, 2024 to 2034

Figure 56: Kinki Industry Analysis and Outlook Y-o-Y Growth (%) Projections by Solution, 2024 to 2034

Figure 57: Kinki Industry Analysis and Outlook Value (US$ Million) Analysis by Type, 2019 to 2034

Figure 58: Kinki Industry Analysis and Outlook Value Share (%) and BPS Analysis by Type, 2024 to 2034

Figure 59: Kinki Industry Analysis and Outlook Y-o-Y Growth (%) Projections by Type, 2024 to 2034

Figure 60: Kinki Industry Analysis and Outlook Value (US$ Million) Analysis by Application, 2019 to 2034

Figure 61: Kinki Industry Analysis and Outlook Value Share (%) and BPS Analysis by Application, 2024 to 2034

Figure 62: Kinki Industry Analysis and Outlook Y-o-Y Growth (%) Projections by Application, 2024 to 2034

Figure 63: Kinki Industry Analysis and Outlook Attractiveness by Solution, 2024 to 2034

Figure 64: Kinki Industry Analysis and Outlook Attractiveness by Type, 2024 to 2034

Figure 65: Kinki Industry Analysis and Outlook Attractiveness by Application, 2024 to 2034

Figure 66: Kyushu & Okinawa Industry Analysis and Outlook Value (US$ Million) by Solution, 2024 to 2034

Figure 67: Kyushu & Okinawa Industry Analysis and Outlook Value (US$ Million) by Type, 2024 to 2034

Figure 68: Kyushu & Okinawa Industry Analysis and Outlook Value (US$ Million) by Application, 2024 to 2034

Figure 69: Kyushu & Okinawa Industry Analysis and Outlook Value (US$ Million) Analysis by Solution, 2019 to 2034

Figure 70: Kyushu & Okinawa Industry Analysis and Outlook Value Share (%) and BPS Analysis by Solution, 2024 to 2034

Figure 71: Kyushu & Okinawa Industry Analysis and Outlook Y-o-Y Growth (%) Projections by Solution, 2024 to 2034

Figure 72: Kyushu & Okinawa Industry Analysis and Outlook Value (US$ Million) Analysis by Type, 2019 to 2034

Figure 73: Kyushu & Okinawa Industry Analysis and Outlook Value Share (%) and BPS Analysis by Type, 2024 to 2034

Figure 74: Kyushu & Okinawa Industry Analysis and Outlook Y-o-Y Growth (%) Projections by Type, 2024 to 2034

Figure 75: Kyushu & Okinawa Industry Analysis and Outlook Value (US$ Million) Analysis by Application, 2019 to 2034

Figure 76: Kyushu & Okinawa Industry Analysis and Outlook Value Share (%) and BPS Analysis by Application, 2024 to 2034

Figure 77: Kyushu & Okinawa Industry Analysis and Outlook Y-o-Y Growth (%) Projections by Application, 2024 to 2034

Figure 78: Kyushu & Okinawa Industry Analysis and Outlook Attractiveness by Solution, 2024 to 2034

Figure 79: Kyushu & Okinawa Industry Analysis and Outlook Attractiveness by Type, 2024 to 2034

Figure 80: Kyushu & Okinawa Industry Analysis and Outlook Attractiveness by Application, 2024 to 2034

Figure 81: Tohoku Industry Analysis and Outlook Value (US$ Million) by Solution, 2024 to 2034

Figure 82: Tohoku Industry Analysis and Outlook Value (US$ Million) by Type, 2024 to 2034

Figure 83: Tohoku Industry Analysis and Outlook Value (US$ Million) by Application, 2024 to 2034

Figure 84: Tohoku Industry Analysis and Outlook Value (US$ Million) Analysis by Solution, 2019 to 2034

Figure 85: Tohoku Industry Analysis and Outlook Value Share (%) and BPS Analysis by Solution, 2024 to 2034

Figure 86: Tohoku Industry Analysis and Outlook Y-o-Y Growth (%) Projections by Solution, 2024 to 2034

Figure 87: Tohoku Industry Analysis and Outlook Value (US$ Million) Analysis by Type, 2019 to 2034

Figure 88: Tohoku Industry Analysis and Outlook Value Share (%) and BPS Analysis by Type, 2024 to 2034

Figure 89: Tohoku Industry Analysis and Outlook Y-o-Y Growth (%) Projections by Type, 2024 to 2034

Figure 90: Tohoku Industry Analysis and Outlook Value (US$ Million) Analysis by Application, 2019 to 2034

Figure 91: Tohoku Industry Analysis and Outlook Value Share (%) and BPS Analysis by Application, 2024 to 2034

Figure 92: Tohoku Industry Analysis and Outlook Y-o-Y Growth (%) Projections by Application, 2024 to 2034

Figure 93: Tohoku Industry Analysis and Outlook Attractiveness by Solution, 2024 to 2034

Figure 94: Tohoku Industry Analysis and Outlook Attractiveness by Type, 2024 to 2034

Figure 95: Tohoku Industry Analysis and Outlook Attractiveness by Application, 2024 to 2034

Figure 96: Rest of Japan Industry Analysis and Outlook Value (US$ Million) by Solution, 2024 to 2034

Figure 97: Rest of Japan Industry Analysis and Outlook Value (US$ Million) by Type, 2024 to 2034

Figure 98: Rest of Japan Industry Analysis and Outlook Value (US$ Million) by Application, 2024 to 2034

Figure 99: Rest of Japan Industry Analysis and Outlook Value (US$ Million) Analysis by Solution, 2019 to 2034

Figure 100: Rest of Japan Industry Analysis and Outlook Value Share (%) and BPS Analysis by Solution, 2024 to 2034

Figure 101: Rest of Japan Industry Analysis and Outlook Y-o-Y Growth (%) Projections by Solution, 2024 to 2034

Figure 102: Rest of Japan Industry Analysis and Outlook Value (US$ Million) Analysis by Type, 2019 to 2034

Figure 103: Rest of Japan Industry Analysis and Outlook Value Share (%) and BPS Analysis by Type, 2024 to 2034

Figure 104: Rest of Japan Industry Analysis and Outlook Y-o-Y Growth (%) Projections by Type, 2024 to 2034

Figure 105: Rest of Japan Industry Analysis and Outlook Value (US$ Million) Analysis by Application, 2019 to 2034

Figure 106: Rest of Japan Industry Analysis and Outlook Value Share (%) and BPS Analysis by Application, 2024 to 2034

Figure 107: Rest of Japan Industry Analysis and Outlook Y-o-Y Growth (%) Projections by Application, 2024 to 2034

Figure 108: Rest of Japan Industry Analysis and Outlook Attractiveness by Solution, 2024 to 2034

Figure 109: Rest of Japan Industry Analysis and Outlook Attractiveness by Type, 2024 to 2034

Figure 110: Rest of Japan Industry Analysis and Outlook Attractiveness by Application, 2024 to 2034

Explore Industrial Automation Insights

View Reports

Cathodic Protection Industry Analysis in Japan