
- Market Size (2026)
- USD 245.7 Mn
- Forecast (2036)
- USD 367.2 Mn
- CAGR (2026 to 2036)
- 4.1%
How Big is the Catering Platters & Lids Market in 2026?
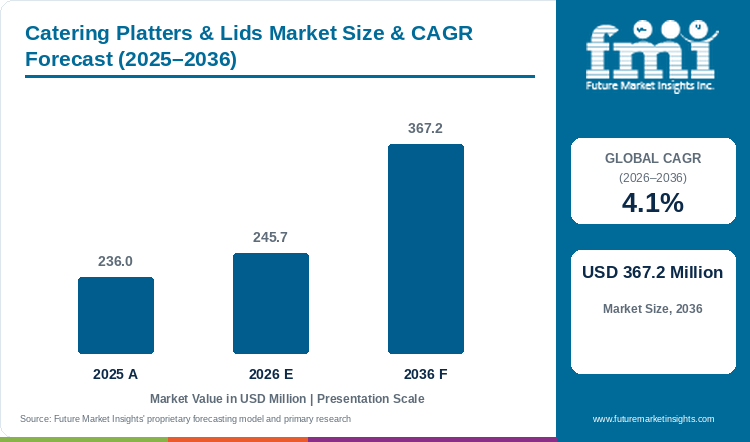
The catering platters & lids market at USD 245.7 Million in 2026, against USD 236.0 Million in 2025.
The catering platters & lids market is valued at USD 245.7 Million in 2026 and is forecast to reach USD 367.2 Million by 2036 at a 4.1% CAGR, compared with USD 236.0 Million in 2025. Demand is expanding as more prepared food is sold for takeaway and catered events. For a foodservice buyer the purchase is a practical packaging decision. A platter and its lid have to fit the service while meeting the material requirements and cost limits that govern the order. Growing hotel and event activity can widen the customer base but does not make every packaging format suitable. Packaging rules also differ between markets. Suppliers will need to offer materials that buyers can approve without losing a dependable lid fit or an acceptable delivered cost. Growth will therefore depend on turning foodservice demand into repeat purchases of a pack that works within those operating conditions.
The wider disposable food containers market covers single-use containers, cups and lids across foodservice and retail uses. Foodservice demand and packaging rules will shape sales across key countries. Dubai recorded 18.72 million international overnight visitors in 2024 and this supports demand from hotels and catered events in the UAE. The EU Packaging and Packaging Waste Regulation (PPWR) began applying in August 2026 and Dubai expanded its single-use plastic ban from January 2026. Material choice, lid fit and delivered cost will decide which packs buyers approve.
Key Takeaways of Catering Platters & Lids Market
- Takeaway, delivery and catered events will keep demand for transport-ready platters and lids growing through 2036.
- Standard formats are likely to account for 42.0% of Format Type demand in 2026.
- Paperboard is estimated to hold 30.0% of Material demand in 2026.
- Standard meal is projected to hold 42.0% of Format Size demand in 2026.
- Reuse rules, extended producer responsibility (EPR) costs and food-contact requirements will remain key challenges for catering packaging suppliers, as per FMI.
- Key companies profiled by FMI include Pactiv Evergreen, Genpak, Dart Container, Duni, Novolex, Amcor (formerly Berry Global), Graphic Packaging, Sabert, Detmold Group and Huhtamaki.
Analyst Perspective
“Catering buyers will first check whether the platter and lid stay secure during transport. Lower-plastic materials are likely to gain traction only when they meet food-contact rules without creating leakage or handling problems.”
- Nandini Roy Choudhury, Principal Consultant, Future Market Insights
How is the Catering Platters & Lids Market Segmented?
FMI segments the catering platters & lids market by Format Type, Material, Format Size, End Use, Sales Channel and Region.
By Format Type, the market covers Standard formats, Recyclable-optimized formats, Premium & branded formats, and Custom-engineered formats. Material includes Paperboard, Molded fiber & bagasse, rPET & PP, Compostable polymers, and Aluminium. Format Size comprises Standard meal, Single-serve, and Family & catering. End Use covers QSR chains, Delivery platforms, Coffee & beverage, Institutional catering, and Retail deli. Sales Channel includes Broadline foodservice distributors, Direct chain contracts, Packaging distributors, and Online. The regional split spans seven regions.
Why Do Standard Formats Lead the Format Type Category?
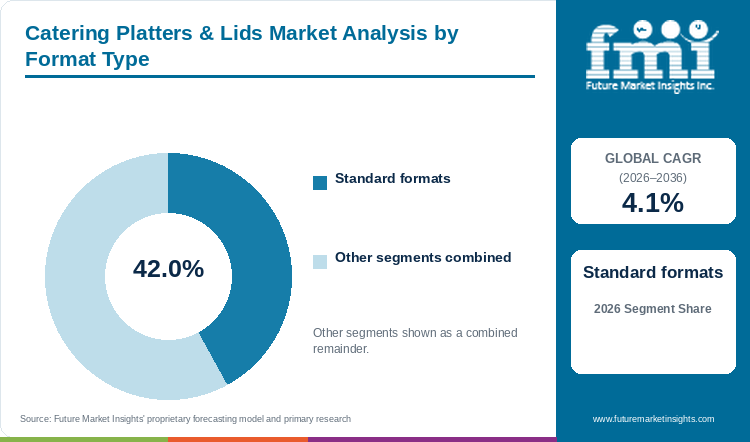
Standard formats lead Format Type with a 42.0% share in 2026 because one base and lid pairing serves repeat orders.
Common sizes make stocking easier for distributors and multi-site operators.
- A buyer can swap one approved pack for another without changing the packing routine.
- Standard formats are likely to hold 42.0% of Format Type demand in 2026.
What Makes Paperboard Central to the Material Category?
Paperboard leads Material with a 30.0% share in 2026 as a rigid and printable base that cuts plastic in the pack.
Grease and moisture can affect paperboard performance. Coatings and liners have to match the food being packed. The lid also has to stay secure during transport.
- Paperboard is likely to account for 30.0% of Material demand in 2026.
- In August 2026 the European Commission confirmed that the PPWR had begun applying across the EU and included restrictions on PFAS (per- and polyfluoroalkyl substances) in food-contact packaging. This will increase the importance of verified barrier materials and clear end-of-life instructions for paperboard packs.
Why Does Standard Meal Anchor the Format Size Category?
Standard meal leads Format Size with a 42.0% share in 2026 because it fits regular prepared-food and catering orders.
The format holds a complete meal and takes less storage space than family packs. Family and catering sizes serve shared meals and larger events.
- Standard meal will hold 42.0% of Format Size demand in 2026.
- National Restaurant Association research published in April 2025 found that more than seven in ten off-premises customers were interested in smaller portions at a lower price or larger portions at the regular price. Different portion needs will keep several platter sizes in use.
Why Do QSR Chains Lead the End Use Category?
Quick-service restaurant (QSR) chains lead End Use with a 28.0% share in 2026 on frequent orders across many outlets.
The same platter and lid can serve standard menu items and catering orders. Packaging also has to protect food after it leaves the counter as takeaway and delivery sales rise. Single-meal packs for these chains are covered separately in FMI’s fast food containers market report.
- QSR chains will account for 28.0% of End Use demand in 2026.
- National Restaurant Association research published in April 2025 found that 41% of full-service operators and 58% of limited-service operators said off-premises dining represented more of total sales than in 2019. This will support demand for packaging that can handle pickup, delivery and transport.
What Keeps Broadline Foodservice Distributors Ahead in the Sales Channel Category?
Broadline foodservice distributors lead Sales Channel with a 41.0% share in 2026 by supplying packaging alongside other foodservice products.
Operators can order bases and replacement formats through the route that already delivers their other supplies. Direct chain contracts are set to gain traction for large programs. Online channels, on the other hand, will support smaller and occasional orders.
- Broadline foodservice distributors are set to hold 41.0% of Sales Channel demand in 2026.
- In April 2025 the Novolex and Pactiv Evergreen combination created a platform with more than 250 brands and 39,000 SKUs. Its footprint covered the United States and Canada with additional operations in Mexico and Europe. The wider catalog supports buyers that need several foodservice packaging formats from one supplier.
What are the Drivers, Restraints, and Opportunities in the Catering Platters & Lids Market?
Takeaway, delivery and catered food orders will support demand. Reuse rules and packaging is likely to restrain sales while fiber-based platters with secure lids add opportunities.
- Driver: Growth in takeaway, delivery and catered food orders will support demand for platter systems that protect food during transport.
- Restraint: Reuse rules, EPR costs and food-contact restrictions will add compliance work and limit some single-use applications.
- Opportunity: Fiber-based platters with suitable barriers and secure lids will gain where buyers want to cut plastic use.
Demand is likely to grow as more restaurant food is eaten away from the place it was prepared. National Restaurant Association research released in April 2025 found that off-premises traffic made up 30% of full-service traffic and 83% of limited-service traffic in 2024. These orders need packaging that survives pickup and catering runs. Secure lids and stackable formats, therefore, are likely to stay in demand during the forecast period. Packs for single-meal takeaway orders are tracked separately in the takeaway containers market by Future Market Insights.
Reuse rules and food-contact requirements can have a limiting impact on single-use catering packaging. Germany has required many takeaway sellers to offer reusable alternatives since January 2023. Similarly, France has required reusable tableware for on-site consumption in fast-food restaurants with more than 20 seats from the same date. The U.S. phase-out of PFAS grease-proofing agents in paper and paperboard food packaging adds a further material requirement for suppliers.
Fiber-based formats are likely to gain traction where buyers are looking to reduce plastic use without losing moisture and oil resistance. In March 2024 Duni Group and Notpla launched cardboard food packaging with a seaweed-based barrier against moisture and oils. The range included two tray formats and was designed for paper-card recycling. Similar barrier systems can support catering platters if lid fit and handling performance hold up. Wider molded pulp demand is tracked separately in the molded fiber packaging market.
Which Country CAGRs are Profiled in the Catering Platters & Lids Market?
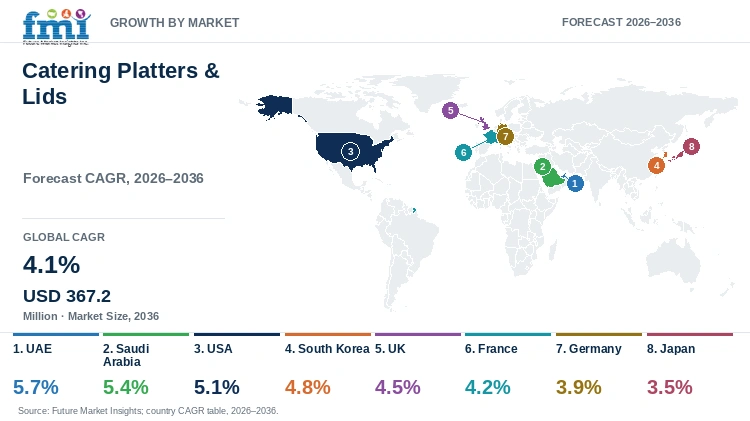
FMI profiles 40+ countries in its comprehensive market report. The UAE is likely to grow at 5.7% CAGR and Japan at 3.5%.
| Country | CAGR, 2026 to 2036 |
|---|---|
| UAE | 5.7% |
| Saudi Arabia | 5.4% |
| USA | 5.1% |
| South Korea | 4.8% |
| UK | 4.5% |
| France | 4.2% |
| Germany | 3.9% |
| Japan | 3.5% |
How Do Country-level CAGRs Compare in the Catering Platters & Lids Market?
Profiled country CAGRs span 2.2 percentage points through 2036. The UAE leads at 5.7% and Japan trails at 3.5%.
Catering platters & lids market growth across the countries will span 2.2 percentage points through 2036. The UAE will lead at 5.7%, followed by Saudi Arabia at 5.4% and the USA at 5.1%. South Korea will record 4.8%. The UK and France will follow at 4.5% and 4.2%. Germany and Japan will grow at 3.9% and 3.5%. Hospitality demand, off-premises foodservice and packaging rules will account for much of the difference.
- The two Gulf markets lead the group. The UAE at 5.7% is 0.3 points ahead of Saudi Arabia at 5.4%.
- The USA at 5.1% sits 0.6 points behind the UAE with off-premises restaurant traffic behind its demand.
- South Korea at 4.8% and the UK at 4.5% trail the leaders as reusable-container programs and EPR fees weigh on disposable choices.
- France at 4.2% and Germany at 3.9% are held back by reuse rules that move dine-in and some takeaway demand to reusable options.
- Japan at 3.5% sits 2.2 points behind the UAE and grows slowest among the eight.
The full report covers country-level growth across all seven regions in the segmentation.
Country Outlook
Tourism lifts demand in the Gulf and off-premises dining lifts it in the USA. Reuse rules and packaging fees hold back growth in Europe and East Asia.
- Sales of catering platters and lids in the UAE will grow at a 5.7% CAGR through 2036. Dubai’s hotel inventory reached 154,016 rooms across 832 establishments at year-end. Hotels and catered events are likely to support platter demand. Dubai’s final phase of the single-use plastic ban took effect on January 1, 2026 and covers plastic plates and beverage cup lids among other items. Suppliers will need compliant alternatives that keep presentation and transport performance.
- Sales of catering platters and lids in Saudi Arabia are likely to grow at a 5.4% CAGR through 2036. The General Authority for Statistics (GASTAT) reported 959,175 employees in tourism activities in the second quarter of 2024 which was 5.1% above a year earlier. Growth in hotels, events and tourism services will add foodservice occasions. Market players will need reliable deliveries and formats that handle transport between venues.
- Demand for catering platters and lids in the USA is likely to expand at a 5.1% CAGR through 2036. National Restaurant Association research shows off-premises traffic reached 30% of full-service traffic and 83% of limited-service traffic in 2024. This is likely to support repeat demand for packaging used after food leaves the counter. The U.S. Food and Drug Administration (FDA) announced in February 2024 that PFAS grease-proofing agents were no longer being sold for U.S. food-contact paper packaging. Paperboard suppliers will therefore need suitable barrier systems.
- South Korea is set to record a 4.8% CAGR from 2026 to 2036. Tourism recovery is anticipated to support restaurant and hospitality demand. In April 2024 the Ministry of Environment announced a voluntary agreement with 16 franchise restaurant brands to promote reusable containers and reduce disposable items. Disposable platters will stay relevant for catering and transport uses that are harder to move to reusable systems.
- Sales in the UK are set to expand at a 4.5% CAGR through 2036. PackUK set 2025-2026 base fees under packaging EPR at GBP 423 per tonne for plastic and GBP 196 for paper and card. Fibre-based composite carries GBP 461 per tonne. These fees will influence material selection and pack design. From 2026-2027 fees are meant to vary with recyclability. Suppliers will need clear material information when buyers compare packaging costs.
- France is likely to record a 4.2% CAGR through 2036. The EU PPWR adds further packaging requirements from August 2026. Suppliers will need formats that fit permitted transport uses and local material rules.
- Germany will grow at a 3.9% CAGR through 2036. Single-use platters will therefore need to serve applications where presentation, event service or transport still requires a disposable format.
- Japan is likely to record a 3.5% CAGR from 2026 to 2036 and grow slowest among the profiled countries. The Japan Tourism Agency reported domestic travel spending of JPY 25.1536 trillion in 2024 which was 14.8% above 2023. Travel will support restaurant and event demand. Suppliers can compete through standard formats, reliable deliveries and food-contact performance. Growth will stay more measured than in the other profiled countries.
Who are the Notable Companies in the Catering Platters & Lids Market?
Pactiv Evergreen, Genpak, Dart Container, Duni, Novolex, Berry Global, Graphic Packaging, Sabert, Detmold Group and Huhtamaki are the notable companies profiled in this market.
FMI groups the profiled companies into three supplier categories.
- Broad Multi-Material Foodservice Platforms: Pactiv Evergreen, Genpak, Dart Container, Novolex and Amcor (which acquired Berry Global effective April 30, 2025) supply multi-material foodservice packaging across several applications.
- Catering-Focused Presentation Systems: Duni, Sabert and Detmold Group offer catering trays, platters or related presentation formats.
- Fiber and Paperboard Conversion Platforms: Graphic Packaging and Huhtamaki provide paperboard or fiber packaging capability relevant to foodservice.
Competitive Benchmarking: Catering Platters & Lids Market
| Company | Catering Platter & Lid Breadth | Fiber-Based Alternatives | Presentation & Transport Features | Geographic Reach |
|---|---|---|---|---|
| Pactiv Evergreen | High | Low | High | North America, with the product platform now within Novolex |
| Genpak | Medium | Medium | High | United States and Canada |
| Dart Container | Medium | High | Medium | North America documented for fiber program |
| Duni | High | High | High | Europe plus selected international markets |
| Novolex | High | High | High | United States and Canada, with Mexico and Europe |
| Berry Global | Medium | Low | High | Africa for documented catering tray, now part of Amcor |
| Graphic Packaging | Medium | High | High | International paperboard tray network |
| Sabert | High | High | High | North America, Belgium, United Kingdom, Poland and China |
| Detmold Group | Medium | High | High | Representatives in 17 countries and manufacturing in seven |
| Huhtamaki | Medium | High | Medium | 36 countries and 101 locations reported for 2024 |
Scoring basis: Catering Platter & Lid Breadth is High for broad documented catering platter or matched lid ranges and Medium for narrower or adjacent ranges. Fiber-Based Alternatives is High for broad paperboard or molded-fiber capability and Medium for narrower evidence. Presentation & Transport Features is High for several documented closure, visibility, stackability or handling features and Medium for a narrower range.
Low indicates limited public documentation for the criterion. Geographic Reach reflects evidenced sales, distribution or plant locations. Scores draw on public company documentation.
Key Developments in the Catering Platters & Lids Market
- In November 2024 Detmold Group highlighted a fiber-based catering platter developed with Subway. The company described the platter as 100% kerbside recyclable and said the redesign removed the equivalent of 26 garbage trucks of plastic annually. The case shows how a chain can cut plastic and keep a catering format.
- In April 2025 Novolex completed its combination with Pactiv Evergreen and kept the Novolex name. The company reported more than 250 brands and 39,000 combined SKUs. The larger platform gives foodservice buyers a wider packaging range through one supplier.
- In June 2025 Sabert introduced corrugated inserts for its Kraft Pop-Up Catering Tray at the International Dairy Deli Bakery Association (IDDBA) show. Full and half-size inserts were designed to keep entrees and toppings in place during transport. The launch adds a simple way to control food movement without changing the outer tray.
Key Players in the Catering Platters & Lids Market
Broad Multi-Material Foodservice Platforms
- Pactiv Evergreen
- Genpak
- Dart Container
- Novolex
- Berry Global
Catering-Focused Presentation Systems
- Duni
- Sabert
- Detmold Group
Fiber and Paperboard Conversion Platforms
- Graphic Packaging
- Huhtamaki
Catering Platters & Lids Market - Report Scope
| Coverage field | Report scope |
|---|---|
| Market breakdown | 6 categories: Format Type (Standard formats, Recyclable-optimized formats, Premium & branded formats, Custom-engineered formats), Material (Paperboard, Molded fiber & bagasse, rPET & PP, Compostable polymers, Aluminium), Format Size (Standard meal, Single-serve, Family & catering), End Use (QSR chains, Delivery platforms, Coffee & beverage, Institutional catering, Retail deli), Sales Channel (Broadline foodservice distributors, Direct chain contracts, Packaging distributors, Online), and Region |
| Quantitative units | USD Million |
| Market definition | Revenue from disposable or single-use catering platter and tray bases, together with matching or removable lids, sold for prepared-food presentation, protection, transport and serving within the stated segmentation. Food and meal revenue, catering service fees, reusable serviceware, unrelated takeout containers, cups, cutlery, bags, machinery and services are excluded. |
| Regions covered | North America, Latin America, Western Europe, Eastern Europe, East Asia, South Asia and Pacific, Middle East and Africa |
| Countries covered | USA, Germany, France, UK, Japan, South Korea, Saudi Arabia, UAE |
| Key companies profiled | Pactiv Evergreen, Genpak, Dart Container, Duni, Novolex, Berry Global, Graphic Packaging, Sabert, Detmold Group, Huhtamaki |
| Forecast period | 2026 to 2036 |
| Approach | Primary and secondary research with market triangulation. |
Catering Platters & Lids Market - Research Methodology
| Method | Approach |
|---|---|
| Primary research | FMI’s primary research engages foodservice packaging manufacturers, distributors, QSR and catering buyers, procurement teams and end users to test purchasing criteria, lid fit, transport performance, pricing and supply continuity. Interviews also cover material requirements, food-contact compliance and barriers to repeat orders. |
| Desk research | The analysis reviews government statistics, packaging and food-contact rules, company filings, product specifications and official company announcements. FMI retains sources that define demand, supplier roles, country conditions or company developments inside the market boundary. |
| Market sizing and forecasting | The sizing framework combines the 2026 baseline with segment mix, pricing, volumes, company participation and country-level demand. Forecasts consider foodservice activity, packaging rules, material costs, channel demand and supply availability. |
| Data validation | Estimates are checked against public data, company activity and primary interviews. Reusable serviceware, unrelated takeout containers, downstream food revenue, overlapping sales and unsupported claims are excluded before final reconciliation. |
Catering Platters & Lids Market by Segments
Catering Platters & Lids Market segmented by Format Type:
- Standard formats
- Recyclable-optimized formats
- Premium & branded formats
- Custom-engineered formats
Catering Platters & Lids Market segmented by Material:
- Paperboard
- Molded fiber & bagasse
- rPET & PP
- Compostable polymers
- Aluminium
Catering Platters & Lids Market segmented by Format Size:
- Standard meal
- Single-serve
- Family & catering
Catering Platters & Lids Market segmented by End Use:
- QSR chains
- Delivery platforms
- Coffee & beverage
- Institutional catering
- Retail deli
Catering Platters & Lids Market segmented by Sales Channel:
- Broadline foodservice distributors
- Direct chain contracts
- Packaging distributors
- Online
Catering Platters & Lids Market by Region:
- North America
- United States
- Canada
- Latin America
- Brazil
- Mexico
- Argentina
- Chile
- Western Europe
- Germany
- France
- United Kingdom
- Italy
- Spain
- Benelux
- Nordics
- Eastern Europe
- Poland
- Czech Republic
- Romania
- Hungary
- East Asia
- China
- Japan
- South Korea
- South Asia and Pacific
- India
- ASEAN
- Australia and New Zealand
- Middle East and Africa
- GCC Countries
- South Africa
- Türkiye
- Israel
Research Sources and Bibliography
- USDA Economic Research Service (2026, June 1). Food Prices and Spending.
- National Restaurant Association (2025, April 17). Report: Takeout, drive-thru, delivery are more popular than ever.
- U.S. Food and Drug Administration (2024, February 28). FDA Announces PFAS Used in Grease-Proofing Agents for Food Packaging No Longer Being Sold in the U.S.
- European Commission, Directorate-General for Environment (2026, August 11). New EU rules on packaging enter into application.
- German Federal Ministry for the Environment (2023, February 10). Mehrwegangebotspflicht im To-Go-Bereich (Reusable offer obligation in the to-go sector).
- French Ministry for Ecological Transition (2022, December 29). Changements et entrées en vigueur au 1er janvier 2023 (Changes and entries into force on 1 January 2023).
- Department for Environment, Food & Rural Affairs / PackUK (2025, June 30). Extended Producer Responsibility for Packaging: 2025 base fees.
- Japan Tourism Agency (2025, April 30). (Travel and Tourism Consumption Trend Survey, 2024 annual figures, final).
- Republic of Korea Ministry of Culture, Sports and Tourism (2025, October 24). 2025 Korea Welcome Week: Enjoy a More Enjoyable and Convenient Visit to Korea.
- Republic of Korea Ministry of Environment (2024, April 25). Ministry of Environment and 16 Franchise Stores Pledge to Create a Culture of Restaurants Without Disposable Items.
- General Authority for Statistics, Saudi Arabia (2024, December 18). GASTAT publishes Tourism Establishments Statistics for Q2 2024.
- Government of Dubai Media Office (2025, February 9). Dubai welcomes 18.72 million international visitors in 2024, up 9% year-on-year.
- Dubai Municipality (2025, December 24). Dubai to enforce final phase of single-use plastic ban from 2026.
- Pactiv Evergreen (n.d.). 4.5-inch RoseDome Lid for 18-inch Caterware Tray.
- Genpak (n.d.). Clear Lid for 9-inch Round Ribbed Plate.
- Genpak (2025, February 20). Grab-A-Bowl Two-Piece Bowl/Lid Combo from Genpak.
- Duni (n.d.). Produce trays - Durable solutions for food businesses.
- Duni Group (2024, March 19). Duni Group enters a new collaboration with Notpla - launching innovative plastic-free packaging with seaweed coating.
- Novolex (n.d.). Product Catalogs.
- Novolex (2025, April 1). Novolex and Pactiv Evergreen Inc. Complete Combination.
- Amcor (n.d.). Catering Tray 435mmx435mm.
- Amcor plc (2025, April 30). Amcor completes combination with Berry Global.
- Graphic Packaging (2025, August 20). Graphic Packaging Adds PaperSeal Pressed MAP Tray to Food Packaging Portfolio.
- Sabert (n.d.). Catering - Catering Platters.
- Sabert (2025, June 2). Sabert Invests in the Future of Food Packaging with Solutions Featured at the 2025 IDDBA Show.
- Sabert (2023, September 25). Sabert Corporation Marks 40 Years of Food Packaging Innovation with a Redesign of SturdiWare Platters.
- Detmold Group (2024, November 25). Detmold recognised for Reporting Excellence at 2024 APCO Award.
- Dart Container (2024, September). We’re #1! Dart leads the way in dry molded fiber production.
- Dart Container (2024, December). Dart invests in next generation fiber.
- Huhtamaki (n.d.). Catering disposables and accessories.
- Huhtamaki (2025, February 14). Huhtamaki to separate Fiber Foodservice business segment into two distinct segments.
- Huhtamaki (2025, July 7). Business segments.
This bibliography is provided for reader reference and is not exhaustive. The full FMI report contains the complete reference list and detailed citations.
This Report Answers
- How large is the Catering Platters & Lids Market in 2026 and what value is expected by 2036?
- Which industry pressures support demand for catering platter and lid systems?
- Why do Standard formats hold the leading position within Format Type?
- Why does Paperboard hold the leading position within Material?
- How do growth rates differ across the profiled countries?
- Which profiled companies supply relevant catering platter, lid or adjacent foodservice packaging capabilities?
- What limits adoption or slows a supplier or material switch?
- What should buyers evaluate before purchasing a new catering platter and lid system?
Table of Content
- Key Takeaways
- Market Size and CAGR
- Top Growth Driver
- Fastest Growing Segment
- Leading Region
- Key Companies
- Emerging Opportunities
- Executive Summary
- Global Market Outlook
- Demand-side Trends
- Supply-side Trends
- Technology Roadmap Analysis
- Analysis and Recommendations
- Analyst Perspective (What is happening? Why now? What should investors know?)
- Key Questions Answered
- How large is the market?
- What is the CAGR?
- What are key trends?
- Which region dominates?
- Who are the leaders?
Read More...
- Market Overview
- Market Coverage / Taxonomy
- Market Definition / Scope / Limitations
- Research Methodology
- Chapter Orientation
- Analytical Lens and Working Hypotheses
- Market Structure, Signals, and Trend Drivers
- Benchmarking and Cross-market Comparability
- Market Sizing, Forecasting, and Opportunity Mapping
- Research Design and Evidence Framework
- Desk Research Programme (Secondary Evidence)
- Expert Input and Fieldwork (Primary Evidence)
- Tooling, Models, and Reference Databases
- Data Engineering and Model Build
- Quality Assurance and Audit Trail
- Market Background
- Market Dynamics (Drivers, Restraints, Opportunity, Trends)
- Scenario Forecast (Optimistic, Likely, Conservative)
- Impact Analysis
- AI Impact
- Sustainability Impact
- Regulatory Impact
- Technology Impact
- Consumer / Buyer Analysis
- Purchase Drivers
- Adoption Barriers
- Buyer Journey
- Opportunity Map Analysis
- Product Life Cycle Analysis
- Supply Chain Analysis
- Investment Feasibility Matrix
- Value Chain Analysis
- PESTLE and Porter's Analysis
- Regulatory Landscape
- Regional Parent Market Outlook
- Production and Consumption Statistics
- Import and Export Statistics
- Global Market Analysis and Forecast, 2021 to 2036
- Historical Market Size Value (USD Million) Analysis, 2021 to 2025
- Current and Future Market Size Value (USD Million) Projections, 2026 to 2036
- Y-o-Y Growth Trend Analysis
- Absolute $ Opportunity Analysis
- Global Market Pricing Analysis, 2021 to 2036
- Global Market Analysis and Forecast, By Format Type, 2021 to 2036
- Introduction / Key Findings
- Historical Market Size Value (USD Million) Analysis By Format Type, 2021 to 2025
- Current and Future Market Size Value (USD Million) Analysis and Forecast By Format Type, 2026 to 2036
- Standard formats
- Recyclable-optimized formats
- Premium & branded formats
- Custom-engineered formats
- Y-o-Y Growth Trend Analysis By Format Type, 2021 to 2025
- Absolute $ Opportunity Analysis By Format Type, 2026 to 2036
- Global Market Analysis and Forecast, By Material, 2021 to 2036
- Introduction / Key Findings
- Historical Market Size Value (USD Million) Analysis By Material, 2021 to 2025
- Current and Future Market Size Value (USD Million) Analysis and Forecast By Material, 2026 to 2036
- Paperboard
- Molded fiber & bagasse
- rPET & PP
- Compostable polymers
- Aluminium
- Y-o-Y Growth Trend Analysis By Material, 2021 to 2025
- Absolute $ Opportunity Analysis By Material, 2026 to 2036
- Global Market Analysis and Forecast, By Format Size, 2021 to 2036
- Introduction / Key Findings
- Historical Market Size Value (USD Million) Analysis By Format Size, 2021 to 2025
- Current and Future Market Size Value (USD Million) Analysis and Forecast By Format Size, 2026 to 2036
- Standard meal
- Single-serve
- Family & catering
- Y-o-Y Growth Trend Analysis By Format Size, 2021 to 2025
- Absolute $ Opportunity Analysis By Format Size, 2026 to 2036
- Global Market Analysis and Forecast, By End Use, 2021 to 2036
- Introduction / Key Findings
- Historical Market Size Value (USD Million) Analysis By End Use, 2021 to 2025
- Current and Future Market Size Value (USD Million) Analysis and Forecast By End Use, 2026 to 2036
- QSR chains
- Delivery platforms
- Coffee & beverage
- Institutional catering
- Retail deli
- Y-o-Y Growth Trend Analysis By End Use, 2021 to 2025
- Absolute $ Opportunity Analysis By End Use, 2026 to 2036
- Global Market Analysis and Forecast, By Sales Channel, 2021 to 2036
- Introduction / Key Findings
- Historical Market Size Value (USD Million) Analysis By Sales Channel, 2021 to 2025
- Current and Future Market Size Value (USD Million) Analysis and Forecast By Sales Channel, 2026 to 2036
- Broadline foodservice distributors
- Direct chain contracts
- Packaging distributors
- Online
- Y-o-Y Growth Trend Analysis By Sales Channel, 2021 to 2025
- Absolute $ Opportunity Analysis By Sales Channel, 2026 to 2036
- Global Market Analysis and Forecast, By Region, 2021 to 2036
- Introduction
- Historical Market Size Value (USD Million) Analysis By Region, 2021 to 2025
- Current Market Size Value (USD Million) Analysis and Forecast By Region, 2026 to 2036
- North America
- Latin America
- Western Europe
- Eastern Europe
- East Asia
- South Asia and Pacific
- Middle East and Africa
- Market Attractiveness Analysis By Region
- North America Market Analysis and Forecast, By Country, 2021 to 2036
- Historical Market Size Value (USD Million) Trend Analysis By Market Taxonomy, 2021 to 2025
- Market Size Value (USD Million) Forecast By Market Taxonomy, 2026 to 2036
- By Country
- United States
- Canada
- By Format Type
- By Material
- By Format Size
- By End Use
- By Sales Channel
- By Country
- Market Attractiveness Analysis
- By Country
- By Format Type
- By Material
- By Format Size
- By End Use
- By Sales Channel
- Key Takeaways
- Latin America Market Analysis and Forecast, By Country
- Historical Market Size Value (USD Million) Trend Analysis By Market Taxonomy, 2021 to 2025
- Market Size Value (USD Million) Forecast By Market Taxonomy, 2026 to 2036
- By Country
- Brazil
- Mexico
- Argentina
- Chile
- By Format Type
- By Material
- By Format Size
- By End Use
- By Sales Channel
- By Country
- Market Attractiveness Analysis
- By Country
- By Format Type
- By Material
- By Format Size
- By End Use
- By Sales Channel
- Key Takeaways
- Western Europe Market Analysis and Forecast, By Country
- Historical Market Size Value (USD Million) Trend Analysis By Market Taxonomy, 2021 to 2025
- Market Size Value (USD Million) Forecast By Market Taxonomy, 2026 to 2036
- By Country
- Germany
- France
- United Kingdom
- Italy
- Spain
- Benelux
- Nordics
- By Format Type
- By Material
- By Format Size
- By End Use
- By Sales Channel
- By Country
- Market Attractiveness Analysis
- By Country
- By Format Type
- By Material
- By Format Size
- By End Use
- By Sales Channel
- Key Takeaways
- Eastern Europe Market Analysis and Forecast, By Country
- Historical Market Size Value (USD Million) Trend Analysis By Market Taxonomy, 2021 to 2025
- Market Size Value (USD Million) Forecast By Market Taxonomy, 2026 to 2036
- By Country
- Poland
- Czech Republic
- Romania
- Hungary
- By Format Type
- By Material
- By Format Size
- By End Use
- By Sales Channel
- By Country
- Market Attractiveness Analysis
- By Country
- By Format Type
- By Material
- By Format Size
- By End Use
- By Sales Channel
- Key Takeaways
- East Asia Market Analysis and Forecast, By Country
- Historical Market Size Value (USD Million) Trend Analysis By Market Taxonomy, 2021 to 2025
- Market Size Value (USD Million) Forecast By Market Taxonomy, 2026 to 2036
- By Country
- China
- Japan
- South Korea
- By Format Type
- By Material
- By Format Size
- By End Use
- By Sales Channel
- By Country
- Market Attractiveness Analysis
- By Country
- By Format Type
- By Material
- By Format Size
- By End Use
- By Sales Channel
- Key Takeaways
- South Asia and Pacific Market Analysis and Forecast, By Country
- Historical Market Size Value (USD Million) Trend Analysis By Market Taxonomy, 2021 to 2025
- Market Size Value (USD Million) Forecast By Market Taxonomy, 2026 to 2036
- By Country
- India
- ASEAN
- Australia and New Zealand
- By Format Type
- By Material
- By Format Size
- By End Use
- By Sales Channel
- By Country
- Market Attractiveness Analysis
- By Country
- By Format Type
- By Material
- By Format Size
- By End Use
- By Sales Channel
- Key Takeaways
- Middle East and Africa Market Analysis and Forecast, By Country
- Historical Market Size Value (USD Million) Trend Analysis By Market Taxonomy, 2021 to 2025
- Market Size Value (USD Million) Forecast By Market Taxonomy, 2026 to 2036
- By Country
- GCC Countries
- South Africa
- Türkiye
- Israel
- By Format Type
- By Material
- By Format Size
- By End Use
- By Sales Channel
- By Country
- Market Attractiveness Analysis
- By Country
- By Format Type
- By Material
- By Format Size
- By End Use
- By Sales Channel
- Key Takeaways
- Key Countries Market Analysis
- United States
- Pricing Analysis
- Market Share Analysis, 2025
- By Format Type
- By Material
- By Format Size
- By End Use
- By Sales Channel
- Canada
- Pricing Analysis
- Market Share Analysis, 2025
- By Format Type
- By Material
- By Format Size
- By End Use
- By Sales Channel
- Mexico
- Pricing Analysis
- Market Share Analysis, 2025
- By Format Type
- By Material
- By Format Size
- By End Use
- By Sales Channel
- Brazil
- Pricing Analysis
- Market Share Analysis, 2025
- By Format Type
- By Material
- By Format Size
- By End Use
- By Sales Channel
- Chile
- Pricing Analysis
- Market Share Analysis, 2025
- By Format Type
- By Material
- By Format Size
- By End Use
- By Sales Channel
- Germany
- Pricing Analysis
- Market Share Analysis, 2025
- By Format Type
- By Material
- By Format Size
- By End Use
- By Sales Channel
- United Kingdom
- Pricing Analysis
- Market Share Analysis, 2025
- By Format Type
- By Material
- By Format Size
- By End Use
- By Sales Channel
- Italy
- Pricing Analysis
- Market Share Analysis, 2025
- By Format Type
- By Material
- By Format Size
- By End Use
- By Sales Channel
- Spain
- Pricing Analysis
- Market Share Analysis, 2025
- By Format Type
- By Material
- By Format Size
- By End Use
- By Sales Channel
- France
- Pricing Analysis
- Market Share Analysis, 2025
- By Format Type
- By Material
- By Format Size
- By End Use
- By Sales Channel
- India
- Pricing Analysis
- Market Share Analysis, 2025
- By Format Type
- By Material
- By Format Size
- By End Use
- By Sales Channel
- ASEAN
- Pricing Analysis
- Market Share Analysis, 2025
- By Format Type
- By Material
- By Format Size
- By End Use
- By Sales Channel
- Australia and New Zealand
- Pricing Analysis
- Market Share Analysis, 2025
- By Format Type
- By Material
- By Format Size
- By End Use
- By Sales Channel
- China
- Pricing Analysis
- Market Share Analysis, 2025
- By Format Type
- By Material
- By Format Size
- By End Use
- By Sales Channel
- Japan
- Pricing Analysis
- Market Share Analysis, 2025
- By Format Type
- By Material
- By Format Size
- By End Use
- By Sales Channel
- South Korea
- Pricing Analysis
- Market Share Analysis, 2025
- By Format Type
- By Material
- By Format Size
- By End Use
- By Sales Channel
- Poland
- Pricing Analysis
- Market Share Analysis, 2025
- By Format Type
- By Material
- By Format Size
- By End Use
- By Sales Channel
- Hungary
- Pricing Analysis
- Market Share Analysis, 2025
- By Format Type
- By Material
- By Format Size
- By End Use
- By Sales Channel
- Türkiye
- Pricing Analysis
- Market Share Analysis, 2025
- By Format Type
- By Material
- By Format Size
- By End Use
- By Sales Channel
- South Africa
- Pricing Analysis
- Market Share Analysis, 2025
- By Format Type
- By Material
- By Format Size
- By End Use
- By Sales Channel
- UAE
- Pricing Analysis
- Market Share Analysis, 2025
- By Format Type
- By Material
- By Format Size
- By End Use
- By Sales Channel
- Saudi Arabia
- Pricing Analysis
- Market Share Analysis, 2025
- By Format Type
- By Material
- By Format Size
- By End Use
- By Sales Channel
- United States
- Market Structure Analysis
- Competition Dashboard
- Competition Benchmarking
- Market Share Analysis of Top Players
- By Regional
- By Format Type
- By Material
- By Format Size
- By End Use
- By Sales Channel
- Emerging Startups
- Innovation Benchmarking
- Competition Analysis
- Competition Deep Dive
- Pactiv Evergreen
- Overview
- Product Portfolio
- Profitability by Market Segments
- Sales Footprint
- Strategy Overview
- Marketing Strategy
- Product Strategy
- Channel Strategy
- Genpak
- Dart Container
- Duni
- Novolex
- Berry Global
- Graphic Packaging
- Sabert
- Detmold Group
- Huhtamaki
- Pactiv Evergreen
- Case Studies
- Success Stories
- Recent Developments
- Competition Deep Dive
- Assumptions & Acronyms Used
List of Tables
- Table 1: Global Market Value (USD Million) Forecast by Region, 2021 to 2036
- Table 2: Global Market Value (USD Million) Forecast by Format Type, 2021 to 2036
- Table 3: Global Market Value (USD Million) Forecast by Material, 2021 to 2036
- Table 4: Global Market Value (USD Million) Forecast by Format Size, 2021 to 2036
- Table 5: Global Market Value (USD Million) Forecast by End Use, 2021 to 2036
- Table 6: Global Market Value (USD Million) Forecast by Sales Channel, 2021 to 2036
- Table 7: North America Market Value (USD Million) Forecast by Country, 2021 to 2036
- Table 8: North America Market Value (USD Million) Forecast by Format Type, 2021 to 2036
- Table 9: North America Market Value (USD Million) Forecast by Material, 2021 to 2036
- Table 10: North America Market Value (USD Million) Forecast by Format Size, 2021 to 2036
- Table 11: North America Market Value (USD Million) Forecast by End Use, 2021 to 2036
- Table 12: North America Market Value (USD Million) Forecast by Sales Channel, 2021 to 2036
- Table 13: Latin America Market Value (USD Million) Forecast by Country, 2021 to 2036
- Table 14: Latin America Market Value (USD Million) Forecast by Format Type, 2021 to 2036
- Table 15: Latin America Market Value (USD Million) Forecast by Material, 2021 to 2036
- Table 16: Latin America Market Value (USD Million) Forecast by Format Size, 2021 to 2036
- Table 17: Latin America Market Value (USD Million) Forecast by End Use, 2021 to 2036
- Table 18: Latin America Market Value (USD Million) Forecast by Sales Channel, 2021 to 2036
- Table 19: Western Europe Market Value (USD Million) Forecast by Country, 2021 to 2036
- Table 20: Western Europe Market Value (USD Million) Forecast by Format Type, 2021 to 2036
- Table 21: Western Europe Market Value (USD Million) Forecast by Material, 2021 to 2036
- Table 22: Western Europe Market Value (USD Million) Forecast by Format Size, 2021 to 2036
- Table 23: Western Europe Market Value (USD Million) Forecast by End Use, 2021 to 2036
- Table 24: Western Europe Market Value (USD Million) Forecast by Sales Channel, 2021 to 2036
- Table 25: Eastern Europe Market Value (USD Million) Forecast by Country, 2021 to 2036
- Table 26: Eastern Europe Market Value (USD Million) Forecast by Format Type, 2021 to 2036
- Table 27: Eastern Europe Market Value (USD Million) Forecast by Material, 2021 to 2036
- Table 28: Eastern Europe Market Value (USD Million) Forecast by Format Size, 2021 to 2036
- Table 29: Eastern Europe Market Value (USD Million) Forecast by End Use, 2021 to 2036
- Table 30: Eastern Europe Market Value (USD Million) Forecast by Sales Channel, 2021 to 2036
- Table 31: East Asia Market Value (USD Million) Forecast by Country, 2021 to 2036
- Table 32: East Asia Market Value (USD Million) Forecast by Format Type, 2021 to 2036
- Table 33: East Asia Market Value (USD Million) Forecast by Material, 2021 to 2036
- Table 34: East Asia Market Value (USD Million) Forecast by Format Size, 2021 to 2036
- Table 35: East Asia Market Value (USD Million) Forecast by End Use, 2021 to 2036
- Table 36: East Asia Market Value (USD Million) Forecast by Sales Channel, 2021 to 2036
- Table 37: South Asia and Pacific Market Value (USD Million) Forecast by Country, 2021 to 2036
- Table 38: South Asia and Pacific Market Value (USD Million) Forecast by Format Type, 2021 to 2036
- Table 39: South Asia and Pacific Market Value (USD Million) Forecast by Material, 2021 to 2036
- Table 40: South Asia and Pacific Market Value (USD Million) Forecast by Format Size, 2021 to 2036
- Table 41: South Asia and Pacific Market Value (USD Million) Forecast by End Use, 2021 to 2036
- Table 42: South Asia and Pacific Market Value (USD Million) Forecast by Sales Channel, 2021 to 2036
- Table 43: Middle East and Africa Market Value (USD Million) Forecast by Country, 2021 to 2036
- Table 44: Middle East and Africa Market Value (USD Million) Forecast by Format Type, 2021 to 2036
- Table 45: Middle East and Africa Market Value (USD Million) Forecast by Material, 2021 to 2036
- Table 46: Middle East and Africa Market Value (USD Million) Forecast by Format Size, 2021 to 2036
- Table 47: Middle East and Africa Market Value (USD Million) Forecast by End Use, 2021 to 2036
- Table 48: Middle East and Africa Market Value (USD Million) Forecast by Sales Channel, 2021 to 2036
List of Figures
- Figure 1: Global Market Pricing Analysis
- Figure 2: Global Market Value (USD Million) Forecast 2021-2036
- Figure 3: Global Market Value Share and BPS Analysis by Format Type, 2026 and 2036
- Figure 4: Global Market Y-o-Y Growth Comparison by Format Type, 2026-2036
- Figure 5: Global Market Attractiveness Analysis by Format Type
- Figure 6: Global Market Value Share and BPS Analysis by Material, 2026 and 2036
- Figure 7: Global Market Y-o-Y Growth Comparison by Material, 2026-2036
- Figure 8: Global Market Attractiveness Analysis by Material
- Figure 9: Global Market Value Share and BPS Analysis by Format Size, 2026 and 2036
- Figure 10: Global Market Y-o-Y Growth Comparison by Format Size, 2026-2036
- Figure 11: Global Market Attractiveness Analysis by Format Size
- Figure 12: Global Market Value Share and BPS Analysis by End Use, 2026 and 2036
- Figure 13: Global Market Y-o-Y Growth Comparison by End Use, 2026-2036
- Figure 14: Global Market Attractiveness Analysis by End Use
- Figure 15: Global Market Value Share and BPS Analysis by Sales Channel, 2026 and 2036
- Figure 16: Global Market Y-o-Y Growth Comparison by Sales Channel, 2026-2036
- Figure 17: Global Market Attractiveness Analysis by Sales Channel
- Figure 18: Global Market Value (USD Million) Share and BPS Analysis by Region, 2026 and 2036
- Figure 19: Global Market Y-o-Y Growth Comparison by Region, 2026-2036
- Figure 20: Global Market Attractiveness Analysis by Region
- Figure 21: North America Market Incremental Dollar Opportunity, 2026-2036
- Figure 22: Latin America Market Incremental Dollar Opportunity, 2026-2036
- Figure 23: Western Europe Market Incremental Dollar Opportunity, 2026-2036
- Figure 24: Eastern Europe Market Incremental Dollar Opportunity, 2026-2036
- Figure 25: East Asia Market Incremental Dollar Opportunity, 2026-2036
- Figure 26: South Asia and Pacific Market Incremental Dollar Opportunity, 2026-2036
- Figure 27: Middle East and Africa Market Incremental Dollar Opportunity, 2026-2036
- Figure 28: North America Market Value Share and BPS Analysis by Country, 2026 and 2036
- Figure 29: North America Market Value Share and BPS Analysis by Format Type, 2026 and 2036
- Figure 30: North America Market Y-o-Y Growth Comparison by Format Type, 2026-2036
- Figure 31: North America Market Attractiveness Analysis by Format Type
- Figure 32: North America Market Value Share and BPS Analysis by Material, 2026 and 2036
- Figure 33: North America Market Y-o-Y Growth Comparison by Material, 2026-2036
- Figure 34: North America Market Attractiveness Analysis by Material
- Figure 35: North America Market Value Share and BPS Analysis by Format Size, 2026 and 2036
- Figure 36: North America Market Y-o-Y Growth Comparison by Format Size, 2026-2036
- Figure 37: North America Market Attractiveness Analysis by Format Size
- Figure 38: North America Market Value Share and BPS Analysis by End Use, 2026 and 2036
- Figure 39: North America Market Y-o-Y Growth Comparison by End Use, 2026-2036
- Figure 40: North America Market Attractiveness Analysis by End Use
- Figure 41: North America Market Value Share and BPS Analysis by Sales Channel, 2026 and 2036
- Figure 42: North America Market Y-o-Y Growth Comparison by Sales Channel, 2026-2036
- Figure 43: North America Market Attractiveness Analysis by Sales Channel
- Figure 44: Latin America Market Value Share and BPS Analysis by Country, 2026 and 2036
- Figure 45: Latin America Market Value Share and BPS Analysis by Format Type, 2026 and 2036
- Figure 46: Latin America Market Y-o-Y Growth Comparison by Format Type, 2026-2036
- Figure 47: Latin America Market Attractiveness Analysis by Format Type
- Figure 48: Latin America Market Value Share and BPS Analysis by Material, 2026 and 2036
- Figure 49: Latin America Market Y-o-Y Growth Comparison by Material, 2026-2036
- Figure 50: Latin America Market Attractiveness Analysis by Material
- Figure 51: Latin America Market Value Share and BPS Analysis by Format Size, 2026 and 2036
- Figure 52: Latin America Market Y-o-Y Growth Comparison by Format Size, 2026-2036
- Figure 53: Latin America Market Attractiveness Analysis by Format Size
- Figure 54: Latin America Market Value Share and BPS Analysis by End Use, 2026 and 2036
- Figure 55: Latin America Market Y-o-Y Growth Comparison by End Use, 2026-2036
- Figure 56: Latin America Market Attractiveness Analysis by End Use
- Figure 57: Latin America Market Value Share and BPS Analysis by Sales Channel, 2026 and 2036
- Figure 58: Latin America Market Y-o-Y Growth Comparison by Sales Channel, 2026-2036
- Figure 59: Latin America Market Attractiveness Analysis by Sales Channel
- Figure 60: Western Europe Market Value Share and BPS Analysis by Country, 2026 and 2036
- Figure 61: Western Europe Market Value Share and BPS Analysis by Format Type, 2026 and 2036
- Figure 62: Western Europe Market Y-o-Y Growth Comparison by Format Type, 2026-2036
- Figure 63: Western Europe Market Attractiveness Analysis by Format Type
- Figure 64: Western Europe Market Value Share and BPS Analysis by Material, 2026 and 2036
- Figure 65: Western Europe Market Y-o-Y Growth Comparison by Material, 2026-2036
- Figure 66: Western Europe Market Attractiveness Analysis by Material
- Figure 67: Western Europe Market Value Share and BPS Analysis by Format Size, 2026 and 2036
- Figure 68: Western Europe Market Y-o-Y Growth Comparison by Format Size, 2026-2036
- Figure 69: Western Europe Market Attractiveness Analysis by Format Size
- Figure 70: Western Europe Market Value Share and BPS Analysis by End Use, 2026 and 2036
- Figure 71: Western Europe Market Y-o-Y Growth Comparison by End Use, 2026-2036
- Figure 72: Western Europe Market Attractiveness Analysis by End Use
- Figure 73: Western Europe Market Value Share and BPS Analysis by Sales Channel, 2026 and 2036
- Figure 74: Western Europe Market Y-o-Y Growth Comparison by Sales Channel, 2026-2036
- Figure 75: Western Europe Market Attractiveness Analysis by Sales Channel
- Figure 76: Eastern Europe Market Value Share and BPS Analysis by Country, 2026 and 2036
- Figure 77: Eastern Europe Market Value Share and BPS Analysis by Format Type, 2026 and 2036
- Figure 78: Eastern Europe Market Y-o-Y Growth Comparison by Format Type, 2026-2036
- Figure 79: Eastern Europe Market Attractiveness Analysis by Format Type
- Figure 80: Eastern Europe Market Value Share and BPS Analysis by Material, 2026 and 2036
- Figure 81: Eastern Europe Market Y-o-Y Growth Comparison by Material, 2026-2036
- Figure 82: Eastern Europe Market Attractiveness Analysis by Material
- Figure 83: Eastern Europe Market Value Share and BPS Analysis by Format Size, 2026 and 2036
- Figure 84: Eastern Europe Market Y-o-Y Growth Comparison by Format Size, 2026-2036
- Figure 85: Eastern Europe Market Attractiveness Analysis by Format Size
- Figure 86: Eastern Europe Market Value Share and BPS Analysis by End Use, 2026 and 2036
- Figure 87: Eastern Europe Market Y-o-Y Growth Comparison by End Use, 2026-2036
- Figure 88: Eastern Europe Market Attractiveness Analysis by End Use
- Figure 89: Eastern Europe Market Value Share and BPS Analysis by Sales Channel, 2026 and 2036
- Figure 90: Eastern Europe Market Y-o-Y Growth Comparison by Sales Channel, 2026-2036
- Figure 91: Eastern Europe Market Attractiveness Analysis by Sales Channel
- Figure 92: East Asia Market Value Share and BPS Analysis by Country, 2026 and 2036
- Figure 93: East Asia Market Value Share and BPS Analysis by Format Type, 2026 and 2036
- Figure 94: East Asia Market Y-o-Y Growth Comparison by Format Type, 2026-2036
- Figure 95: East Asia Market Attractiveness Analysis by Format Type
- Figure 96: East Asia Market Value Share and BPS Analysis by Material, 2026 and 2036
- Figure 97: East Asia Market Y-o-Y Growth Comparison by Material, 2026-2036
- Figure 98: East Asia Market Attractiveness Analysis by Material
- Figure 99: East Asia Market Value Share and BPS Analysis by Format Size, 2026 and 2036
- Figure 100: East Asia Market Y-o-Y Growth Comparison by Format Size, 2026-2036
- Figure 101: East Asia Market Attractiveness Analysis by Format Size
- Figure 102: East Asia Market Value Share and BPS Analysis by End Use, 2026 and 2036
- Figure 103: East Asia Market Y-o-Y Growth Comparison by End Use, 2026-2036
- Figure 104: East Asia Market Attractiveness Analysis by End Use
- Figure 105: East Asia Market Value Share and BPS Analysis by Sales Channel, 2026 and 2036
- Figure 106: East Asia Market Y-o-Y Growth Comparison by Sales Channel, 2026-2036
- Figure 107: East Asia Market Attractiveness Analysis by Sales Channel
- Figure 108: South Asia and Pacific Market Value Share and BPS Analysis by Country, 2026 and 2036
- Figure 109: South Asia and Pacific Market Value Share and BPS Analysis by Format Type, 2026 and 2036
- Figure 110: South Asia and Pacific Market Y-o-Y Growth Comparison by Format Type, 2026-2036
- Figure 111: South Asia and Pacific Market Attractiveness Analysis by Format Type
- Figure 112: South Asia and Pacific Market Value Share and BPS Analysis by Material, 2026 and 2036
- Figure 113: South Asia and Pacific Market Y-o-Y Growth Comparison by Material, 2026-2036
- Figure 114: South Asia and Pacific Market Attractiveness Analysis by Material
- Figure 115: South Asia and Pacific Market Value Share and BPS Analysis by Format Size, 2026 and 2036
- Figure 116: South Asia and Pacific Market Y-o-Y Growth Comparison by Format Size, 2026-2036
- Figure 117: South Asia and Pacific Market Attractiveness Analysis by Format Size
- Figure 118: South Asia and Pacific Market Value Share and BPS Analysis by End Use, 2026 and 2036
- Figure 119: South Asia and Pacific Market Y-o-Y Growth Comparison by End Use, 2026-2036
- Figure 120: South Asia and Pacific Market Attractiveness Analysis by End Use
- Figure 121: South Asia and Pacific Market Value Share and BPS Analysis by Sales Channel, 2026 and 2036
- Figure 122: South Asia and Pacific Market Y-o-Y Growth Comparison by Sales Channel, 2026-2036
- Figure 123: South Asia and Pacific Market Attractiveness Analysis by Sales Channel
- Figure 124: Middle East and Africa Market Value Share and BPS Analysis by Country, 2026 and 2036
- Figure 125: Middle East and Africa Market Value Share and BPS Analysis by Format Type, 2026 and 2036
- Figure 126: Middle East and Africa Market Y-o-Y Growth Comparison by Format Type, 2026-2036
- Figure 127: Middle East and Africa Market Attractiveness Analysis by Format Type
- Figure 128: Middle East and Africa Market Value Share and BPS Analysis by Material, 2026 and 2036
- Figure 129: Middle East and Africa Market Y-o-Y Growth Comparison by Material, 2026-2036
- Figure 130: Middle East and Africa Market Attractiveness Analysis by Material
- Figure 131: Middle East and Africa Market Value Share and BPS Analysis by Format Size, 2026 and 2036
- Figure 132: Middle East and Africa Market Y-o-Y Growth Comparison by Format Size, 2026-2036
- Figure 133: Middle East and Africa Market Attractiveness Analysis by Format Size
- Figure 134: Middle East and Africa Market Value Share and BPS Analysis by End Use, 2026 and 2036
- Figure 135: Middle East and Africa Market Y-o-Y Growth Comparison by End Use, 2026-2036
- Figure 136: Middle East and Africa Market Attractiveness Analysis by End Use
- Figure 137: Middle East and Africa Market Value Share and BPS Analysis by Sales Channel, 2026 and 2036
- Figure 138: Middle East and Africa Market Y-o-Y Growth Comparison by Sales Channel, 2026-2036
- Figure 139: Middle East and Africa Market Attractiveness Analysis by Sales Channel
- Figure 140: Global Market - Tier Structure Analysis
- Figure 141: Global Market - Company Share Analysis
Frequently Asked Questions
How Big is the Catering Platters & Lids Market in 2026, and What is Forecast for 2036?
As per FMI, the catering platters & lids market size is USD 245.7 Million in 2026 and is forecast to reach USD 367.2 Million by 2036.
What is the CAGR for the Catering Platters & Lids Market from 2026 to 2036?
A 4.1% CAGR is forecast for 2026 to 2036.
Which Format Type Segment Leads the Catering Platters & Lids Market?
Standard formats will hold 42.0% of Format Type demand in 2026.
Which Material Segment Leads the Catering Platters & Lids Market?
Paperboard will account for 30.0% of Material demand in 2026.
Which Profiled Countries Have the Highest Growth Rates in the Catering Platters & Lids Market?
As per FMI, the UAE leads at a 5.7% CAGR till 2036 followed by Saudi Arabia at 5.4% and the USA at 5.1%.
Which Companies are Active in the Catering Platters & Lids Market?
Pactiv Evergreen, Genpak, Dart Container, Duni, Novolex, Berry Global, Graphic Packaging, Sabert, Detmold Group and Huhtamaki are a few of the notable companies operating in the catering platters & lids market, out of many players covered by FMI.
Preview the report firsthand - request a free sample
Get SampleGet the brochure for pricing and purchase details.
Get PDF
