Reports

- Global Locations -

Headquarters

Future Market Insights, Inc.

Christiana Corporate, 200
Continental Drive, Suite 401,
Newark, Delaware - 19713,
United States

T: +1-845-579-5705

Americas

Future Market Insights, Inc.

616 Corporate Way, Suite 2-9018,
Valley Cottage, NY 10989, United States

T: +1-347-918-3531

MEA

Future Market Insights

1602-6 Jumeirah Bay X2 Tower, Plot No: JLT-PH2-X2A,
Jumeirah Lakes Towers, Dubai,
United Arab Emirates

Europe

Future Market Insights

3rd Floor, 207 Regent Street,
W1B 3HH London
United Kingdom

T: + 44 (0) 20 8123 9659
D: +44 (0) 20 3287 4268

Asia Pacific

Future Market Insights

IndiaLand Global Tech Park, Unit UG-1, Behind Grand HighStreet, Phase 1, Hinjawadi, MH, Pune – 411057, India

CBD Gummies Market Outlook

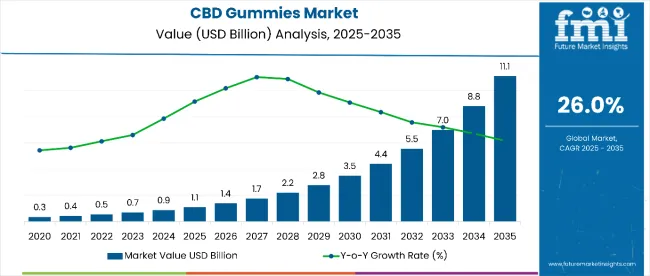
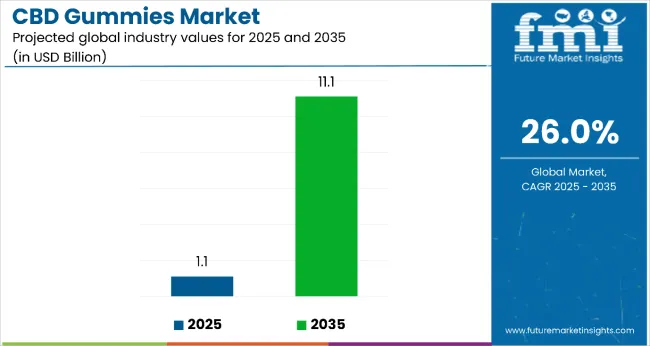
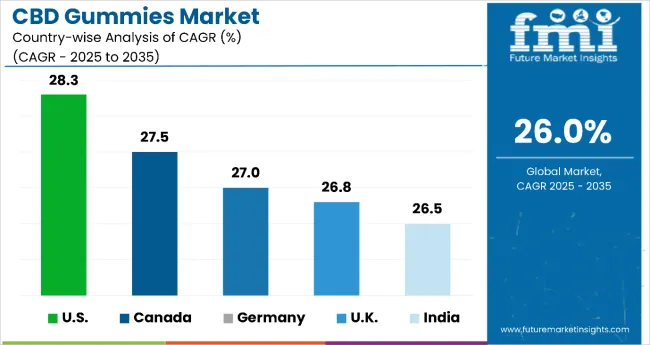
The CBD gummies market is anticipated to be worth US$ 743.5 million in 2023. Revenue from the sales of CBD gummies is forecasted to reach US$ 7,524.5 million by 2033. Exhibiting a remarkable 26% CAGR between 2023 and 2033.

Along with its health benefits, clement CBD regulations for retail CBD based-products such as CBD oil, CBD gummies, CBD beverages, and others contribute to its growth. The prevalence of a high degree of awareness regarding the various benefits of CBD (Cannabidiol), ranging from improving cognitive function to treating skin problems, is aiding its consumption, substantially driving the market trends in recent years.

Several health benefits of CBD gummies include relief from inflammation and pain, identified as the major source of rising demand for CBD gummies in the medical sector. CBD gummies for anxiety have strong evidence of success in popular culture, which is anticipated to be the foremost factor for higher sales of CBD gummies in the local market.

Attributes Details
CBD Gummies Market Share (2022) US$ 715 million
CBD Gummies Market Size Value (2023) US$ 743.5 million
CBD Gummies Market Size Value (2033) US$ 7,524.5 million

Don't pay for what you don't need

Customize your report by selecting specific countries or regions and save 30%!

Global CBD Gummies Market Historical Analysis (2018 to 2022) Vs. Forecast Outlook (2023 to 2033)

The demand for the CBD gummies segment increased by 4% between 2020 and 2022, giving the combined edible CBD market year-over-year growth of 29.0% in 2022, according to the FMI report.

It held more than 55% of the global market in pre-Covid 2019. CBD gummies consumption is increasing rapidly across European markets as manufacturers focus more on products with clean labels and THC content of less than 0.2%.

A few favorable changes in the overall regulations of hemp-based products promote the supply of CBD-based products in the United States market. High CBD-concentrated gummies are projected to register the fastest CAGR of 34.7% from 2021 to 2028 in the region due to increasing awareness about marijuana's benefits for sleep disorders. The conventional distribution channel accounted for 56.4% of sales in 2020. The demand for CBD gummies soared in the UK amid Covid lockdowns.

What are the Driving Factors for the Global CBD Gummies Market in the Forecast Years?

Many different types of medicines are on the market worldwide, including acetaminophen, aspirin, ibuprofen, and naproxen, each of which has quite dangerous adverse effects. On the contrary hand, by increasing endocannabinoid receptor activation, lowering inflammation, and working in conjunction with neurotransmitters, these products can aid in the reduction of chronic pain. Over the projection period, the demand for CBD gummies is expected to increase due to these health advantages.

CBD gummies have quickly become a popular trend and for good reason. They're fun, tasty, and easy to use medications. Plus, they provide all the benefits of CBD oil without any potential drawbacks. Such advantages without any potential damage probability are getting more sales of CBD gummies in the global market.

Nandini Roy Choudhury

Principal Consultant

Talk to Analyst

Find your sweet spots for generating winning opportunities in this market.

What are the Major Challenges Experienced by the CBD Gummies Market Players?

In their report, the WHO concluded that CBD is generally well tolerated with a good safety profile. CBD gummies have also improved hyperactivity and autism in specially-abled children.

However, marijuana is illegal on the federal (USA) level, and it is not legal to give THC to children. Still, CBD-based and hemp-based products below 0.3% THC are legal; hence, it is up to the parent to make a responsible decision regarding CBD gummies for kids.

Based on the Product, Which Segment is Performing Well in the Global CBD Gummies Market?

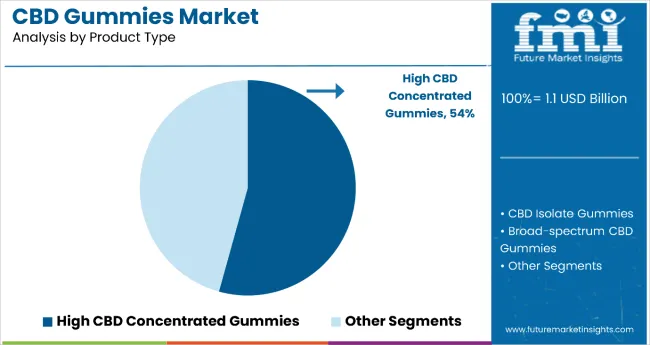
As per the report, high CBD concentrated gummies accounted for the largest share of the global market by contributing nearly 28.2% of the total sales achieved that year.

While CBD isolates gummies account for 25.4% of the market in terms of product type due to increasing demand for gummies with no THC or cannabinoids. By concentration, the low-concentrated CBD gummies held 20.2% in 2020 and are expected to maintain their growth rate in the global CBD gummies industry during the projected years. First-time buyers of CBD gummies prefer low CBD content gummies ranging from 1 to 20 mg per gummy.

Get the data you need at a Fraction of the cost

Personalize your report by choosing insights you need
and save 40%!

Which are the Prominent Distribution Channels of the CBD Gummies Industry?

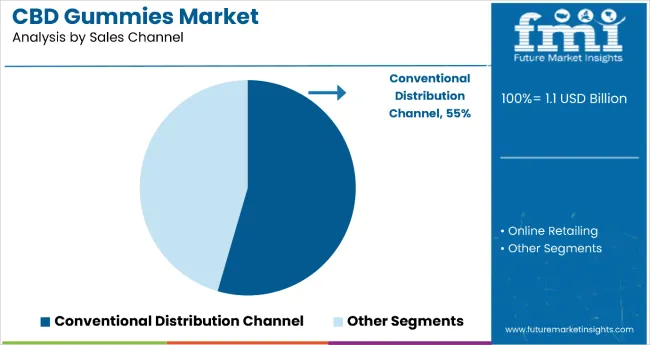
Conventional distribution channels are still the prominent segment channelizing about 56.4% of global sales. Customers favor offline retailers when looking to buy genuine goods. Any CBD product is available from local pharmacies with a special prescription. Furthermore, because head shops are widely distributed across most major cities, they benefit from a sizable established audience and a committed local clientele.

In recent years, the online distribution channel is gaining momentum with a higher growth rate with the proliferation of online platforms. Owing to the pandemic's widespread shutdown of all brick-and-mortar establishments, overall sales through offline channels substantially decreased.

Comparative View of Adjacent CBD Gummies Industry

CBD Gummies Market:

Attributes CBD Gummies Market
CAGR (2023 to 2033) 26%
Market Value (2023) US$ 7,524.5 million
Growth Factor Rising awareness about the health benefits of using cannabinoids has increased the sales of every CBD product.
Future Opportunities The growing trend of legalizing cannabis and other narcotics items is expected to create huge opportunities in the coming days.
Market Trends The emergence of new market players after the legalization is expanding its global market.

CBD Skin Care Market:

Attributes CBD Skin Care Market
CAGR (2023 to 2033) 27.5%
Market Value (2022) US$ 1.8 Billion
Growth Factor The adoption of CBD products by medical professionals worldwide for their patients has driven this market segment in recent years.
Future Opportunities Increasing sales of cosmetic products with the improving living standards across the emerging economies to further boost the market.
Market Trends Sourcing of CBD base material from the appropriate locations at a competitive price.

Cannabis Extract Market:

Attributes Cannabis Extract Market
CAGR (2023 to 2033) 8.5%
Market Value (2022) US$ 22.3 Billion
Growth Factor Cannabis is increasingly used for recreational and therapeutic purposes making its extracts more lucrative in urban areas.
Future Opportunities Government-imposed tariffs on cannabis oil and tinctures have increased revenue-generating potential for other nations.
Market Trends Releasing products to treat various illnesses, including cancer, nausea, and anxiety.

While CBD is an essential component of medical marijuana, it is derived directly from the hemp plant, a cousin of marijuana, or manufactured in a laboratory. The distillery makes the most popular CBD gummies for sleep and anxiety, and its use has escalated in the recent past as per the recommendations of medical professionals. Based on this fact, the global market presents a very lucrative opportunity for existing and new market players over the projected years.

Moreover, to date, there is no evidence of any public health-related problems associated with the use of pure CBD. WHO reports that "In humans, CBD gummies exhibit no effects of any abuse or dependence potential. Rising awareness about this fact is anticipated to favor the market's future trends in the coming days. Manufacturers expect a significant shift in product positioning of CBD in the global market, with the hopes that CBD oil and gummies will become as common as fish oil or multivitamin gummies in the near future.

What is the CBD Gummies Industry Outlook for North America Region?

North America is likely to remain the dominant market through the projected years. In the North America geographical region, the United States is the largest shareholder, with a total contribution of around 42%. The formulation of regulations about the legal or medical use of cannabinoids, particularly in California State, is responsible for higher sales of CBD gummies there.

Likewise, there has been a rapid rise in demand for CBD-based products in Europe. CBD regulations are getting softer. Authorities in E.U. Member States now regard CBD as a "novel product" for food, beverages, and food supplements. In the European CBD gummies industry, Germany is figured out to be the highest contributing market, with a share of around 38%.

What is the CBD Gummies Industry Outlook for Asia Pacific Region?

As per the report, Asia Pacific is the remarkably growing in recent years. In this part of the world, China is the leading player with the

Japan loosened CBD regulations in 2016, but the change in regulation was unknown to many since bans on advertisements continued. It was only in 2018 that an amendment again resulted in the approval of an ad for Elixinol's CBD-based products.

Since then, the nation has recorded a multifold rise in the demand for CBD-based products, attracting investments from many international players in the CBD gummies industry. The positioning of Japan in the product life cycle (PLC) depicts it as a high-potential market.

The region has much slower growth compared to its counterparts, mainly due to a lack of awareness of CBD gummies' benefits and CBD regulations. Inclination towards Western ways of living has fuelled the demand for health-boosting products. Asia Pacific is relatively unexplored as a potential CBD market. Several hemp-based and CBD-based products have business potential in Thailand following the announcement of the new regulatory reforms.

How Strong is the Competitive Landscape for the CBD Gummies Industry?

The 2018 Agriculture Improvement Act, commonly called the 2018 farm bill act, permitted companies to grow and sell hemp-based products sourced from parts of the plant called cannabis Sativa L, including all derivatives and seeds. The market is benefitting from some favorable changes in regulations.

This act includes the removal of hemp from the Controlled Substances Act (CSA), which means that under federal law, cannabis plants and derivatives that constitute less than or equal to 0.3 % dry-weight THC are no longer controlled substances.

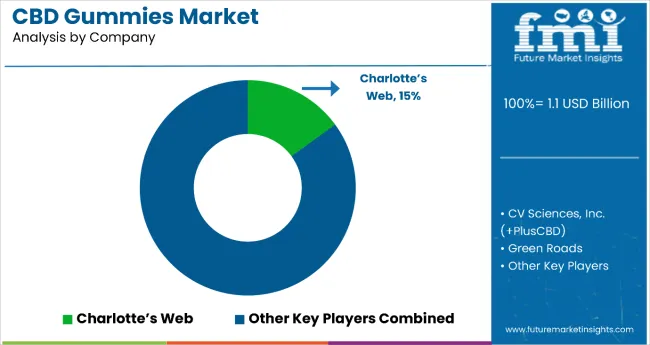
These developments positively affected the market, enabling manufacturers to expand their product portfolio, fuelling the demand for CBD gummies, and encouraging product launches in North America. For instance 2018, CV Sciences, Inc. announced the launch of Plus CBD Gummies at Natural Product Expo East 2018. Plus, CBD Gummies are available in two flavors- Citrus Punch and Cherry Mango.

The product's growing popularity among pet owners is a very recent and lucrative opportunity getting into focus of the new market players. The best CBD dog treats can help with pain management, anxiety, inflammation, arthritis, and seizure disorders. In the U.S., there is a huge market for CBD-based dog foods. Brands like Honestpaws, Holistapet, and cbdMD already produce CBD gummies for dogs making it a growing segment in the global CBD gummies industry.

Several companies have recently launched their line of CBD gummies, including Green Roads and Lord Jones. These companies hope CBD gummies will be as popular as other CBD products, such as oils and tinctures.

In 2018, the Food and Drug Administration (FDA) concluded that CBD-based products can be legally marketed in human food, provided they comply with the requirements. Following this, the use of hemp extracts in food items such as CBD gummies has surged. This inevitably creates incremental prospects for sales uptick of CBD-based products.

Countries in Latin America have legalized cannabis for medical use, including Colombia, Chile, Mexico, Brazil, Peru, and Argentina. In Colombia, CBD-based products, including CBD gummies, can be legally sold through retail channels provided they contain <1% THC (Tetrahydrocannabinol) and are licensed by Colombia's food and drug regulatory agency. Prominent brands from this region include Bluebird Botanicals (Brazil), Green Roads (Chile), and Mary's Nutritionals (Brazil).

The leading firms in the global CBD gummies industry, which have a sizable core audience, well-known brands, extensive networks of distributors, and a constant expansion of their footprint across key areas, provide the most rivalry for the industry's participants.

Champs, Inc. and First Capital Venture Co., a PotNetwork Holdings division and Diamond CBD proprietor, negotiated an exclusive distribution contract in February 2021. This collaborative endeavor aims to increase Diamond CBD's market share by introducing products endorsed by athletes.

Key Players Profiled in the Market Survey

  • Americas
  • CV Sciences
  • Charlotte's Web
  • Verma Farms
  • PureKana
  • Dixie Brands Inc.
  • Premium Jane
  • Kushie Bites
  • Sunday Scaries
  • Hemp Bombs
  • Reliva CBD Wellness
  • Europe
  • CBD Oil Europe
  • Medterra
  • Balance CBD
  • CBDfx
  • CBD Pure
  • Others

Key Segments of the CBD Gummies Market

By Product Type:

  • High CBD Concentrated Gummies
  • CBD isolate Gummies
  • Broad-spectrum CBD Gummies
  • Full-spectrum CBD Gummies

By Sale Channel:

  • Conventional Distribution Channel
  • Supermarket/ Hypermarket
  • Head shops/
  • Smoke shops
  • Local health stores
  • Others
  • Online Retailing

By Packaging:

  • Pouches
  • Bottles
  • Jars
  • Tins
  • Others

By Region:

  • North America
  • Latin America
  • Europe
  • Asia Pacific
  • Middle East and Africa

Frequently Asked Questions

What is the Growth Outlook of the CBD Gummies Market?

The global CBD gummies industry is to grow at 26% during the forecast period.

What is the projected Value of the CBD Gummies Market By 2033?

The global CBD gummies industry is predicted to be valued at US$ 7,524.5 million by 2033.

What is the Current Size of the CBD Gummies Market?

The global CBD gummies market was valued at US$ 743.5 million in 2023.

Which category is the largest Dominant Share Holder in the CBD Gummies Market?

The high CBD concentrated gummies market contributed 28.2% of the global market in 2022.

Table of Content

1. Executive Summary

    1.1. Global Market Outlook

    1.2. Demand-side Trends

    1.3. Supply-side Trends

    1.4. Technology Roadmap Analysis

    1.5. Analysis and Recommendations

2. Market Overview

    2.1. Market Coverage / Taxonomy

    2.2. Market Definition / Scope / Limitations

3. Market Background

    3.1. Market Dynamics

        3.1.1. Drivers

        3.1.2. Restraints

        3.1.3. Opportunity

        3.1.4. Trends

    3.2. Scenario Forecast

        3.2.1. Demand in Optimistic Scenario

        3.2.2. Demand in Likely Scenario

        3.2.3. Demand in Conservative Scenario

    3.3. Opportunity Map Analysis

    3.4. Product Life Cycle Analysis

    3.5. Supply Chain Analysis

        3.5.1. Supply Side Participants and their Roles

            3.5.1.1. Producers

            3.5.1.2. Mid-Level Participants (Traders/ Agents/ Brokers)

            3.5.1.3. Wholesalers and Distributors

        3.5.2. Value Added and Value Created at Node in the Supply Chain

        3.5.3. List of Raw Material Suppliers

        3.5.4. List of Existing and Potential Buyer’s

    3.6. Investment Feasibility Matrix

    3.7. Value Chain Analysis

        3.7.1. Profit Margin Analysis

        3.7.2. Wholesalers and Distributors

        3.7.3. Retailers

    3.8. PESTLE and Porter’s Analysis

    3.9. Regulatory Landscape

        3.9.1. By Key Regions

        3.9.2. By Key Countries

    3.10. Regional Parent Market Outlook

    3.11. Production and Consumption Statistics

    3.12. Import and Export Statistics

4. Global Market Analysis 2018 to 2022 and Forecast, 2023 to 2033

    4.1. Historical Market Size Value (US$ Million) & Volume (Units) Analysis, 2018 to 2022

    4.2. Current and Future Market Size Value (US$ Million) & Volume (Units) Projections, 2023 to 2033

        4.2.1. Y-o-Y Growth Trend Analysis

        4.2.2. Absolute $ Opportunity Analysis

5. Global Market Analysis 2018 to 2022 and Forecast 2023 to 2033, By Product Type

    5.1. Introduction / Key Findings

    5.2. Historical Market Size Value (US$ Million) & Volume (Units) Analysis By Product Type, 2018 to 2022

    5.3. Current and Future Market Size Value (US$ Million) & Volume (Units) Analysis and Forecast By Product Type, 2023 to 2033

        5.3.1. High CBD Concentrated Gummies

        5.3.2. CBD isolate Gummies

        5.3.3. Broad-spectrum CBD Gummies

        5.3.4. Full-spectrum CBD Gummies

    5.4. Y-o-Y Growth Trend Analysis By Product Type, 2018 to 2022

    5.5. Absolute $ Opportunity Analysis By Product Type, 2023 to 2033

6. Global Market Analysis 2018 to 2022 and Forecast 2023 to 2033, By Sale Channel

    6.1. Introduction / Key Findings

    6.2. Historical Market Size Value (US$ Million) & Volume (Units) Analysis By Sale Channel, 2018 to 2022

    6.3. Current and Future Market Size Value (US$ Million) & Volume (Units) Analysis and Forecast By Sale Channel, 2023 to 2033

        6.3.1. Conventional Distribution Channel

            6.3.1.1. Supermarket/ Hypermarket

            6.3.1.2. Head shops/

            6.3.1.3. Smoke shops

            6.3.1.4. Local health stores

            6.3.1.5. Others

        6.3.2. Online Retailing

    6.4. Y-o-Y Growth Trend Analysis By Sale Channel, 2018 to 2022

    6.5. Absolute $ Opportunity Analysis By Sale Channel, 2023 to 2033

7. Global Market Analysis 2018 to 2022 and Forecast 2023 to 2033, By Packaging

    7.1. Introduction / Key Findings

    7.2. Historical Market Size Value (US$ Million) & Volume (Units) Analysis By Packaging, 2018 to 2022

    7.3. Current and Future Market Size Value (US$ Million) & Volume (Units) Analysis and Forecast By Packaging, 2023 to 2033

        7.3.1. Pouches

        7.3.2. Bottles

        7.3.3. Jars

        7.3.4. Tins

        7.3.5. Others

    7.4. Y-o-Y Growth Trend Analysis By Packaging, 2018 to 2022

    7.5. Absolute $ Opportunity Analysis By Packaging, 2023 to 2033

8. Global Market Analysis 2018 to 2022 and Forecast 2023 to 2033, By Region

    8.1. Introduction

    8.2. Historical Market Size Value (US$ Million) & Volume (Units) Analysis By Region, 2018 to 2022

    8.3. Current Market Size Value (US$ Million) & Volume (Units) Analysis and Forecast By Region, 2023 to 2033

        8.3.1. North America

        8.3.2. Latin America

        8.3.3. Western Europe

        8.3.4. Eastern Europe

        8.3.5. South Asia and Pacific

        8.3.6. East Asia

        8.3.7. Middle East and Africa

    8.4. Market Attractiveness Analysis By Region

9. North America Market Analysis 2018 to 2022 and Forecast 2023 to 2033, By Country

    9.1. Historical Market Size Value (US$ Million) & Volume (Units) Trend Analysis By Market Taxonomy, 2018 to 2022

    9.2. Market Size Value (US$ Million) & Volume (Units) Forecast By Market Taxonomy, 2023 to 2033

        9.2.1. By Country

            9.2.1.1. USA

            9.2.1.2. Canada

        9.2.2. By Product Type

        9.2.3. By Sale Channel

        9.2.4. By Packaging

    9.3. Market Attractiveness Analysis

        9.3.1. By Country

        9.3.2. By Product Type

        9.3.3. By Sale Channel

        9.3.4. By Packaging

    9.4. Key Takeaways

10. Latin America Market Analysis 2018 to 2022 and Forecast 2023 to 2033, By Country

    10.1. Historical Market Size Value (US$ Million) & Volume (Units) Trend Analysis By Market Taxonomy, 2018 to 2022

    10.2. Market Size Value (US$ Million) & Volume (Units) Forecast By Market Taxonomy, 2023 to 2033

        10.2.1. By Country

            10.2.1.1. Brazil

            10.2.1.2. Mexico

            10.2.1.3. Rest of Latin America

        10.2.2. By Product Type

        10.2.3. By Sale Channel

        10.2.4. By Packaging

    10.3. Market Attractiveness Analysis

        10.3.1. By Country

        10.3.2. By Product Type

        10.3.3. By Sale Channel

        10.3.4. By Packaging

    10.4. Key Takeaways

11. Western Europe Market Analysis 2018 to 2022 and Forecast 2023 to 2033, By Country

    11.1. Historical Market Size Value (US$ Million) & Volume (Units) Trend Analysis By Market Taxonomy, 2018 to 2022

    11.2. Market Size Value (US$ Million) & Volume (Units) Forecast By Market Taxonomy, 2023 to 2033

        11.2.1. By Country

            11.2.1.1. Germany

            11.2.1.2. UK

            11.2.1.3. France

            11.2.1.4. Spain

            11.2.1.5. Italy

            11.2.1.6. Rest of Western Europe

        11.2.2. By Product Type

        11.2.3. By Sale Channel

        11.2.4. By Packaging

    11.3. Market Attractiveness Analysis

        11.3.1. By Country

        11.3.2. By Product Type

        11.3.3. By Sale Channel

        11.3.4. By Packaging

    11.4. Key Takeaways

12. Eastern Europe Market Analysis 2018 to 2022 and Forecast 2023 to 2033, By Country

    12.1. Historical Market Size Value (US$ Million) & Volume (Units) Trend Analysis By Market Taxonomy, 2018 to 2022

    12.2. Market Size Value (US$ Million) & Volume (Units) Forecast By Market Taxonomy, 2023 to 2033

        12.2.1. By Country

            12.2.1.1. Poland

            12.2.1.2. Russia

            12.2.1.3. Czech Republic

            12.2.1.4. Romania

            12.2.1.5. Rest of Eastern Europe

        12.2.2. By Product Type

        12.2.3. By Sale Channel

        12.2.4. By Packaging

    12.3. Market Attractiveness Analysis

        12.3.1. By Country

        12.3.2. By Product Type

        12.3.3. By Sale Channel

        12.3.4. By Packaging

    12.4. Key Takeaways

13. South Asia and Pacific Market Analysis 2018 to 2022 and Forecast 2023 to 2033, By Country

    13.1. Historical Market Size Value (US$ Million) & Volume (Units) Trend Analysis By Market Taxonomy, 2018 to 2022

    13.2. Market Size Value (US$ Million) & Volume (Units) Forecast By Market Taxonomy, 2023 to 2033

        13.2.1. By Country

            13.2.1.1. India

            13.2.1.2. Bangladesh

            13.2.1.3. Australia

            13.2.1.4. New Zealand

            13.2.1.5. Rest of South Asia and Pacific

        13.2.2. By Product Type

        13.2.3. By Sale Channel

        13.2.4. By Packaging

    13.3. Market Attractiveness Analysis

        13.3.1. By Country

        13.3.2. By Product Type

        13.3.3. By Sale Channel

        13.3.4. By Packaging

    13.4. Key Takeaways

14. East Asia Market Analysis 2018 to 2022 and Forecast 2023 to 2033, By Country

    14.1. Historical Market Size Value (US$ Million) & Volume (Units) Trend Analysis By Market Taxonomy, 2018 to 2022

    14.2. Market Size Value (US$ Million) & Volume (Units) Forecast By Market Taxonomy, 2023 to 2033

        14.2.1. By Country

            14.2.1.1. China

            14.2.1.2. Japan

            14.2.1.3. South Korea

        14.2.2. By Product Type

        14.2.3. By Sale Channel

        14.2.4. By Packaging

    14.3. Market Attractiveness Analysis

        14.3.1. By Country

        14.3.2. By Product Type

        14.3.3. By Sale Channel

        14.3.4. By Packaging

    14.4. Key Takeaways

15. Middle East and Africa Market Analysis 2018 to 2022 and Forecast 2023 to 2033, By Country

    15.1. Historical Market Size Value (US$ Million) & Volume (Units) Trend Analysis By Market Taxonomy, 2018 to 2022

    15.2. Market Size Value (US$ Million) & Volume (Units) Forecast By Market Taxonomy, 2023 to 2033

        15.2.1. By Country

            15.2.1.1. GCC Countries

            15.2.1.2. South Africa

            15.2.1.3. Israel

            15.2.1.4. Rest of MEA

        15.2.2. By Product Type

        15.2.3. By Sale Channel

        15.2.4. By Packaging

    15.3. Market Attractiveness Analysis

        15.3.1. By Country

        15.3.2. By Product Type

        15.3.3. By Sale Channel

        15.3.4. By Packaging

    15.4. Key Takeaways

16. Key Countries Market Analysis

    16.1. USA

        16.1.1. Pricing Analysis

        16.1.2. Market Share Analysis, 2022

            16.1.2.1. By Product Type

            16.1.2.2. By Sale Channel

            16.1.2.3. By Packaging

    16.2. Canada

        16.2.1. Pricing Analysis

        16.2.2. Market Share Analysis, 2022

            16.2.2.1. By Product Type

            16.2.2.2. By Sale Channel

            16.2.2.3. By Packaging

    16.3. Brazil

        16.3.1. Pricing Analysis

        16.3.2. Market Share Analysis, 2022

            16.3.2.1. By Product Type

            16.3.2.2. By Sale Channel

            16.3.2.3. By Packaging

    16.4. Mexico

        16.4.1. Pricing Analysis

        16.4.2. Market Share Analysis, 2022

            16.4.2.1. By Product Type

            16.4.2.2. By Sale Channel

            16.4.2.3. By Packaging

    16.5. Germany

        16.5.1. Pricing Analysis

        16.5.2. Market Share Analysis, 2022

            16.5.2.1. By Product Type

            16.5.2.2. By Sale Channel

            16.5.2.3. By Packaging

    16.6. UK

        16.6.1. Pricing Analysis

        16.6.2. Market Share Analysis, 2022

            16.6.2.1. By Product Type

            16.6.2.2. By Sale Channel

            16.6.2.3. By Packaging

    16.7. France

        16.7.1. Pricing Analysis

        16.7.2. Market Share Analysis, 2022

            16.7.2.1. By Product Type

            16.7.2.2. By Sale Channel

            16.7.2.3. By Packaging

    16.8. Spain

        16.8.1. Pricing Analysis

        16.8.2. Market Share Analysis, 2022

            16.8.2.1. By Product Type

            16.8.2.2. By Sale Channel

            16.8.2.3. By Packaging

    16.9. Italy

        16.9.1. Pricing Analysis

        16.9.2. Market Share Analysis, 2022

            16.9.2.1. By Product Type

            16.9.2.2. By Sale Channel

            16.9.2.3. By Packaging

    16.10. Poland

        16.10.1. Pricing Analysis

        16.10.2. Market Share Analysis, 2022

            16.10.2.1. By Product Type

            16.10.2.2. By Sale Channel

            16.10.2.3. By Packaging

    16.11. Russia

        16.11.1. Pricing Analysis

        16.11.2. Market Share Analysis, 2022

            16.11.2.1. By Product Type

            16.11.2.2. By Sale Channel

            16.11.2.3. By Packaging

    16.12. Czech Republic

        16.12.1. Pricing Analysis

        16.12.2. Market Share Analysis, 2022

            16.12.2.1. By Product Type

            16.12.2.2. By Sale Channel

            16.12.2.3. By Packaging

    16.13. Romania

        16.13.1. Pricing Analysis

        16.13.2. Market Share Analysis, 2022

            16.13.2.1. By Product Type

            16.13.2.2. By Sale Channel

            16.13.2.3. By Packaging

    16.14. India

        16.14.1. Pricing Analysis

        16.14.2. Market Share Analysis, 2022

            16.14.2.1. By Product Type

            16.14.2.2. By Sale Channel

            16.14.2.3. By Packaging

    16.15. Bangladesh

        16.15.1. Pricing Analysis

        16.15.2. Market Share Analysis, 2022

            16.15.2.1. By Product Type

            16.15.2.2. By Sale Channel

            16.15.2.3. By Packaging

    16.16. Australia

        16.16.1. Pricing Analysis

        16.16.2. Market Share Analysis, 2022

            16.16.2.1. By Product Type

            16.16.2.2. By Sale Channel

            16.16.2.3. By Packaging

    16.17. New Zealand

        16.17.1. Pricing Analysis

        16.17.2. Market Share Analysis, 2022

            16.17.2.1. By Product Type

            16.17.2.2. By Sale Channel

            16.17.2.3. By Packaging

    16.18. China

        16.18.1. Pricing Analysis

        16.18.2. Market Share Analysis, 2022

            16.18.2.1. By Product Type

            16.18.2.2. By Sale Channel

            16.18.2.3. By Packaging

    16.19. Japan

        16.19.1. Pricing Analysis

        16.19.2. Market Share Analysis, 2022

            16.19.2.1. By Product Type

            16.19.2.2. By Sale Channel

            16.19.2.3. By Packaging

    16.20. South Korea

        16.20.1. Pricing Analysis

        16.20.2. Market Share Analysis, 2022

            16.20.2.1. By Product Type

            16.20.2.2. By Sale Channel

            16.20.2.3. By Packaging

    16.21. GCC Countries

        16.21.1. Pricing Analysis

        16.21.2. Market Share Analysis, 2022

            16.21.2.1. By Product Type

            16.21.2.2. By Sale Channel

            16.21.2.3. By Packaging

    16.22. South Africa

        16.22.1. Pricing Analysis

        16.22.2. Market Share Analysis, 2022

            16.22.2.1. By Product Type

            16.22.2.2. By Sale Channel

            16.22.2.3. By Packaging

    16.23. Israel

        16.23.1. Pricing Analysis

        16.23.2. Market Share Analysis, 2022

            16.23.2.1. By Product Type

            16.23.2.2. By Sale Channel

            16.23.2.3. By Packaging

17. Market Structure Analysis

    17.1. Competition Dashboard

    17.2. Competition Benchmarking

    17.3. Market Share Analysis of Top Players

        17.3.1. By Regional

        17.3.2. By Product Type

        17.3.3. By Sale Channel

        17.3.4. By Packaging

18. Competition Analysis

    18.1. Competition Deep Dive

        18.1.1. CV Sciences

            18.1.1.1. Overview

            18.1.1.2. Product Portfolio

            18.1.1.3. Profitability by Market Segments

            18.1.1.4. Sales Footprint

            18.1.1.5. Strategy Overview

                18.1.1.5.1. Marketing Strategy

                18.1.1.5.2. Product Strategy

                18.1.1.5.3. Channel Strategy

        18.1.2. Charlotte's Web

            18.1.2.1. Overview

            18.1.2.2. Product Portfolio

            18.1.2.3. Profitability by Market Segments

            18.1.2.4. Sales Footprint

            18.1.2.5. Strategy Overview

                18.1.2.5.1. Marketing Strategy

                18.1.2.5.2. Product Strategy

                18.1.2.5.3. Channel Strategy

        18.1.3. Verma Farms

            18.1.3.1. Overview

            18.1.3.2. Product Portfolio

            18.1.3.3. Profitability by Market Segments

            18.1.3.4. Sales Footprint

            18.1.3.5. Strategy Overview

                18.1.3.5.1. Marketing Strategy

                18.1.3.5.2. Product Strategy

                18.1.3.5.3. Channel Strategy

        18.1.4. PureKana

            18.1.4.1. Overview

            18.1.4.2. Product Portfolio

            18.1.4.3. Profitability by Market Segments

            18.1.4.4. Sales Footprint

            18.1.4.5. Strategy Overview

                18.1.4.5.1. Marketing Strategy

                18.1.4.5.2. Product Strategy

                18.1.4.5.3. Channel Strategy

        18.1.5. Dixie Brands Inc.

            18.1.5.1. Overview

            18.1.5.2. Product Portfolio

            18.1.5.3. Profitability by Market Segments

            18.1.5.4. Sales Footprint

            18.1.5.5. Strategy Overview

                18.1.5.5.1. Marketing Strategy

                18.1.5.5.2. Product Strategy

                18.1.5.5.3. Channel Strategy

        18.1.6. Premium Jane/li>

            18.1.6.1. Overview

            18.1.6.2. Product Portfolio

            18.1.6.3. Profitability by Market Segments

            18.1.6.4. Sales Footprint

            18.1.6.5. Strategy Overview

                18.1.6.5.1. Marketing Strategy

                18.1.6.5.2. Product Strategy

                18.1.6.5.3. Channel Strategy

        18.1.7. Kushie Bites

            18.1.7.1. Overview

            18.1.7.2. Product Portfolio

            18.1.7.3. Profitability by Market Segments

            18.1.7.4. Sales Footprint

            18.1.7.5. Strategy Overview

                18.1.7.5.1. Marketing Strategy

                18.1.7.5.2. Product Strategy

                18.1.7.5.3. Channel Strategy

        18.1.8. Sunday Scaries

            18.1.8.1. Overview

            18.1.8.2. Product Portfolio

            18.1.8.3. Profitability by Market Segments

            18.1.8.4. Sales Footprint

            18.1.8.5. Strategy Overview

                18.1.8.5.1. Marketing Strategy

                18.1.8.5.2. Product Strategy

                18.1.8.5.3. Channel Strategy

        18.1.9. Hemp Bombs

            18.1.9.1. Overview

            18.1.9.2. Product Portfolio

            18.1.9.3. Profitability by Market Segments

            18.1.9.4. Sales Footprint

            18.1.9.5. Strategy Overview

                18.1.9.5.1. Marketing Strategy

                18.1.9.5.2. Product Strategy

                18.1.9.5.3. Channel Strategy

        18.1.10. Reliva CBD Wellness

            18.1.10.1. Overview

            18.1.10.2. Product Portfolio

            18.1.10.3. Profitability by Market Segments

            18.1.10.4. Sales Footprint

            18.1.10.5. Strategy Overview

                18.1.10.5.1. Marketing Strategy

                18.1.10.5.2. Product Strategy

                18.1.10.5.3. Channel Strategy

        18.1.11. CBD Oil Europe

            18.1.11.1. Overview

            18.1.11.2. Product Portfolio

            18.1.11.3. Profitability by Market Segments

            18.1.11.4. Sales Footprint

            18.1.11.5. Strategy Overview

                18.1.11.5.1. Marketing Strategy

                18.1.11.5.2. Product Strategy

                18.1.11.5.3. Channel Strategy

        18.1.12. Medterra

            18.1.12.1. Overview

            18.1.12.2. Product Portfolio

            18.1.12.3. Profitability by Market Segments

            18.1.12.4. Sales Footprint

            18.1.12.5. Strategy Overview

                18.1.12.5.1. Marketing Strategy

                18.1.12.5.2. Product Strategy

                18.1.12.5.3. Channel Strategy

        18.1.13. Balance CBD

            18.1.13.1. Overview

            18.1.13.2. Product Portfolio

            18.1.13.3. Profitability by Market Segments

            18.1.13.4. Sales Footprint

            18.1.13.5. Strategy Overview

                18.1.13.5.1. Marketing Strategy

                18.1.13.5.2. Product Strategy

                18.1.13.5.3. Channel Strategy

        18.1.14. CBDfx

            18.1.14.1. Overview

            18.1.14.2. Product Portfolio

            18.1.14.3. Profitability by Market Segments

            18.1.14.4. Sales Footprint

            18.1.14.5. Strategy Overview

                18.1.14.5.1. Marketing Strategy

                18.1.14.5.2. Product Strategy

                18.1.14.5.3. Channel Strategy

        18.1.15. CBD Pure

            18.1.15.1. Overview

            18.1.15.2. Product Portfolio

            18.1.15.3. Profitability by Market Segments

            18.1.15.4. Sales Footprint

            18.1.15.5. Strategy Overview

                18.1.15.5.1. Marketing Strategy

                18.1.15.5.2. Product Strategy

                18.1.15.5.3. Channel Strategy

19. Assumptions & Acronyms Used

20. Research Methodology

Don't pay for what you don't need

Customize your report by selecting specific countries or regions and save 30%!

List of Tables

Table 1: Global Market Value (US$ Million) Forecast by Region, 2018 to 2033

Table 2: Global Market Volume (Units) Forecast by Region, 2018 to 2033

Table 3: Global Market Value (US$ Million) Forecast by Product Type, 2018 to 2033

Table 4: Global Market Volume (Units) Forecast by Product Type, 2018 to 2033

Table 5: Global Market Value (US$ Million) Forecast by Sale Channel, 2018 to 2033

Table 6: Global Market Volume (Units) Forecast by Sale Channel, 2018 to 2033

Table 7: Global Market Value (US$ Million) Forecast by Packaging, 2018 to 2033

Table 8: Global Market Volume (Units) Forecast by Packaging, 2018 to 2033

Table 9: North America Market Value (US$ Million) Forecast by Country, 2018 to 2033

Table 10: North America Market Volume (Units) Forecast by Country, 2018 to 2033

Table 11: North America Market Value (US$ Million) Forecast by Product Type, 2018 to 2033

Table 12: North America Market Volume (Units) Forecast by Product Type, 2018 to 2033

Table 13: North America Market Value (US$ Million) Forecast by Sale Channel, 2018 to 2033

Table 14: North America Market Volume (Units) Forecast by Sale Channel, 2018 to 2033

Table 15: North America Market Value (US$ Million) Forecast by Packaging, 2018 to 2033

Table 16: North America Market Volume (Units) Forecast by Packaging, 2018 to 2033

Table 17: Latin America Market Value (US$ Million) Forecast by Country, 2018 to 2033

Table 18: Latin America Market Volume (Units) Forecast by Country, 2018 to 2033

Table 19: Latin America Market Value (US$ Million) Forecast by Product Type, 2018 to 2033

Table 20: Latin America Market Volume (Units) Forecast by Product Type, 2018 to 2033

Table 21: Latin America Market Value (US$ Million) Forecast by Sale Channel, 2018 to 2033

Table 22: Latin America Market Volume (Units) Forecast by Sale Channel, 2018 to 2033

Table 23: Latin America Market Value (US$ Million) Forecast by Packaging, 2018 to 2033

Table 24: Latin America Market Volume (Units) Forecast by Packaging, 2018 to 2033

Table 25: Western Europe Market Value (US$ Million) Forecast by Country, 2018 to 2033

Table 26: Western Europe Market Volume (Units) Forecast by Country, 2018 to 2033

Table 27: Western Europe Market Value (US$ Million) Forecast by Product Type, 2018 to 2033

Table 28: Western Europe Market Volume (Units) Forecast by Product Type, 2018 to 2033

Table 29: Western Europe Market Value (US$ Million) Forecast by Sale Channel, 2018 to 2033

Table 30: Western Europe Market Volume (Units) Forecast by Sale Channel, 2018 to 2033

Table 31: Western Europe Market Value (US$ Million) Forecast by Packaging, 2018 to 2033

Table 32: Western Europe Market Volume (Units) Forecast by Packaging, 2018 to 2033

Table 33: Eastern Europe Market Value (US$ Million) Forecast by Country, 2018 to 2033

Table 34: Eastern Europe Market Volume (Units) Forecast by Country, 2018 to 2033

Table 35: Eastern Europe Market Value (US$ Million) Forecast by Product Type, 2018 to 2033

Table 36: Eastern Europe Market Volume (Units) Forecast by Product Type, 2018 to 2033

Table 37: Eastern Europe Market Value (US$ Million) Forecast by Sale Channel, 2018 to 2033

Table 38: Eastern Europe Market Volume (Units) Forecast by Sale Channel, 2018 to 2033

Table 39: Eastern Europe Market Value (US$ Million) Forecast by Packaging, 2018 to 2033

Table 40: Eastern Europe Market Volume (Units) Forecast by Packaging, 2018 to 2033

Table 41: South Asia and Pacific Market Value (US$ Million) Forecast by Country, 2018 to 2033

Table 42: South Asia and Pacific Market Volume (Units) Forecast by Country, 2018 to 2033

Table 43: South Asia and Pacific Market Value (US$ Million) Forecast by Product Type, 2018 to 2033

Table 44: South Asia and Pacific Market Volume (Units) Forecast by Product Type, 2018 to 2033

Table 45: South Asia and Pacific Market Value (US$ Million) Forecast by Sale Channel, 2018 to 2033

Table 46: South Asia and Pacific Market Volume (Units) Forecast by Sale Channel, 2018 to 2033

Table 47: South Asia and Pacific Market Value (US$ Million) Forecast by Packaging, 2018 to 2033

Table 48: South Asia and Pacific Market Volume (Units) Forecast by Packaging, 2018 to 2033

Table 49: East Asia Market Value (US$ Million) Forecast by Country, 2018 to 2033

Table 50: East Asia Market Volume (Units) Forecast by Country, 2018 to 2033

Table 51: East Asia Market Value (US$ Million) Forecast by Product Type, 2018 to 2033

Table 52: East Asia Market Volume (Units) Forecast by Product Type, 2018 to 2033

Table 53: East Asia Market Value (US$ Million) Forecast by Sale Channel, 2018 to 2033

Table 54: East Asia Market Volume (Units) Forecast by Sale Channel, 2018 to 2033

Table 55: East Asia Market Value (US$ Million) Forecast by Packaging, 2018 to 2033

Table 56: East Asia Market Volume (Units) Forecast by Packaging, 2018 to 2033

Table 57: Middle East and Africa Market Value (US$ Million) Forecast by Country, 2018 to 2033

Table 58: Middle East and Africa Market Volume (Units) Forecast by Country, 2018 to 2033

Table 59: Middle East and Africa Market Value (US$ Million) Forecast by Product Type, 2018 to 2033

Table 60: Middle East and Africa Market Volume (Units) Forecast by Product Type, 2018 to 2033

Table 61: Middle East and Africa Market Value (US$ Million) Forecast by Sale Channel, 2018 to 2033

Table 62: Middle East and Africa Market Volume (Units) Forecast by Sale Channel, 2018 to 2033

Table 63: Middle East and Africa Market Value (US$ Million) Forecast by Packaging, 2018 to 2033

Table 64: Middle East and Africa Market Volume (Units) Forecast by Packaging, 2018 to 2033
Nandini Roy Choudhury

Principal Consultant

Talk to Analyst

Find your sweet spots for generating winning opportunities in this market.

List of Charts

Figure 1: Global Market Value (US$ Million) by Product Type, 2023 to 2033

Figure 2: Global Market Value (US$ Million) by Sale Channel, 2023 to 2033

Figure 3: Global Market Value (US$ Million) by Packaging, 2023 to 2033

Figure 4: Global Market Value (US$ Million) by Region, 2023 to 2033

Figure 5: Global Market Value (US$ Million) Analysis by Region, 2018 to 2033

Figure 6: Global Market Volume (Units) Analysis by Region, 2018 to 2033

Figure 7: Global Market Value Share (%) and BPS Analysis by Region, 2023 to 2033

Figure 8: Global Market Y-o-Y Growth (%) Projections by Region, 2023 to 2033

Figure 9: Global Market Value (US$ Million) Analysis by Product Type, 2018 to 2033

Figure 10: Global Market Volume (Units) Analysis by Product Type, 2018 to 2033

Figure 11: Global Market Value Share (%) and BPS Analysis by Product Type, 2023 to 2033

Figure 12: Global Market Y-o-Y Growth (%) Projections by Product Type, 2023 to 2033

Figure 13: Global Market Value (US$ Million) Analysis by Sale Channel, 2018 to 2033

Figure 14: Global Market Volume (Units) Analysis by Sale Channel, 2018 to 2033

Figure 15: Global Market Value Share (%) and BPS Analysis by Sale Channel, 2023 to 2033

Figure 16: Global Market Y-o-Y Growth (%) Projections by Sale Channel, 2023 to 2033

Figure 17: Global Market Value (US$ Million) Analysis by Packaging, 2018 to 2033

Figure 18: Global Market Volume (Units) Analysis by Packaging, 2018 to 2033

Figure 19: Global Market Value Share (%) and BPS Analysis by Packaging, 2023 to 2033

Figure 20: Global Market Y-o-Y Growth (%) Projections by Packaging, 2023 to 2033

Figure 21: Global Market Attractiveness by Product Type, 2023 to 2033

Figure 22: Global Market Attractiveness by Sale Channel, 2023 to 2033

Figure 23: Global Market Attractiveness by Packaging, 2023 to 2033

Figure 24: Global Market Attractiveness by Region, 2023 to 2033

Figure 25: North America Market Value (US$ Million) by Product Type, 2023 to 2033

Figure 26: North America Market Value (US$ Million) by Sale Channel, 2023 to 2033

Figure 27: North America Market Value (US$ Million) by Packaging, 2023 to 2033

Figure 28: North America Market Value (US$ Million) by Country, 2023 to 2033

Figure 29: North America Market Value (US$ Million) Analysis by Country, 2018 to 2033

Figure 30: North America Market Volume (Units) Analysis by Country, 2018 to 2033

Figure 31: North America Market Value Share (%) and BPS Analysis by Country, 2023 to 2033

Figure 32: North America Market Y-o-Y Growth (%) Projections by Country, 2023 to 2033

Figure 33: North America Market Value (US$ Million) Analysis by Product Type, 2018 to 2033

Figure 34: North America Market Volume (Units) Analysis by Product Type, 2018 to 2033

Figure 35: North America Market Value Share (%) and BPS Analysis by Product Type, 2023 to 2033

Figure 36: North America Market Y-o-Y Growth (%) Projections by Product Type, 2023 to 2033

Figure 37: North America Market Value (US$ Million) Analysis by Sale Channel, 2018 to 2033

Figure 38: North America Market Volume (Units) Analysis by Sale Channel, 2018 to 2033

Figure 39: North America Market Value Share (%) and BPS Analysis by Sale Channel, 2023 to 2033

Figure 40: North America Market Y-o-Y Growth (%) Projections by Sale Channel, 2023 to 2033

Figure 41: North America Market Value (US$ Million) Analysis by Packaging, 2018 to 2033

Figure 42: North America Market Volume (Units) Analysis by Packaging, 2018 to 2033

Figure 43: North America Market Value Share (%) and BPS Analysis by Packaging, 2023 to 2033

Figure 44: North America Market Y-o-Y Growth (%) Projections by Packaging, 2023 to 2033

Figure 45: North America Market Attractiveness by Product Type, 2023 to 2033

Figure 46: North America Market Attractiveness by Sale Channel, 2023 to 2033

Figure 47: North America Market Attractiveness by Packaging, 2023 to 2033

Figure 48: North America Market Attractiveness by Country, 2023 to 2033

Figure 49: Latin America Market Value (US$ Million) by Product Type, 2023 to 2033

Figure 50: Latin America Market Value (US$ Million) by Sale Channel, 2023 to 2033

Figure 51: Latin America Market Value (US$ Million) by Packaging, 2023 to 2033

Figure 52: Latin America Market Value (US$ Million) by Country, 2023 to 2033

Figure 53: Latin America Market Value (US$ Million) Analysis by Country, 2018 to 2033

Figure 54: Latin America Market Volume (Units) Analysis by Country, 2018 to 2033

Figure 55: Latin America Market Value Share (%) and BPS Analysis by Country, 2023 to 2033

Figure 56: Latin America Market Y-o-Y Growth (%) Projections by Country, 2023 to 2033

Figure 57: Latin America Market Value (US$ Million) Analysis by Product Type, 2018 to 2033

Figure 58: Latin America Market Volume (Units) Analysis by Product Type, 2018 to 2033

Figure 59: Latin America Market Value Share (%) and BPS Analysis by Product Type, 2023 to 2033

Figure 60: Latin America Market Y-o-Y Growth (%) Projections by Product Type, 2023 to 2033

Figure 61: Latin America Market Value (US$ Million) Analysis by Sale Channel, 2018 to 2033

Figure 62: Latin America Market Volume (Units) Analysis by Sale Channel, 2018 to 2033

Figure 63: Latin America Market Value Share (%) and BPS Analysis by Sale Channel, 2023 to 2033

Figure 64: Latin America Market Y-o-Y Growth (%) Projections by Sale Channel, 2023 to 2033

Figure 65: Latin America Market Value (US$ Million) Analysis by Packaging, 2018 to 2033

Figure 66: Latin America Market Volume (Units) Analysis by Packaging, 2018 to 2033

Figure 67: Latin America Market Value Share (%) and BPS Analysis by Packaging, 2023 to 2033

Figure 68: Latin America Market Y-o-Y Growth (%) Projections by Packaging, 2023 to 2033

Figure 69: Latin America Market Attractiveness by Product Type, 2023 to 2033

Figure 70: Latin America Market Attractiveness by Sale Channel, 2023 to 2033

Figure 71: Latin America Market Attractiveness by Packaging, 2023 to 2033

Figure 72: Latin America Market Attractiveness by Country, 2023 to 2033

Figure 73: Western Europe Market Value (US$ Million) by Product Type, 2023 to 2033

Figure 74: Western Europe Market Value (US$ Million) by Sale Channel, 2023 to 2033

Figure 75: Western Europe Market Value (US$ Million) by Packaging, 2023 to 2033

Figure 76: Western Europe Market Value (US$ Million) by Country, 2023 to 2033

Figure 77: Western Europe Market Value (US$ Million) Analysis by Country, 2018 to 2033

Figure 78: Western Europe Market Volume (Units) Analysis by Country, 2018 to 2033

Figure 79: Western Europe Market Value Share (%) and BPS Analysis by Country, 2023 to 2033

Figure 80: Western Europe Market Y-o-Y Growth (%) Projections by Country, 2023 to 2033

Figure 81: Western Europe Market Value (US$ Million) Analysis by Product Type, 2018 to 2033

Figure 82: Western Europe Market Volume (Units) Analysis by Product Type, 2018 to 2033

Figure 83: Western Europe Market Value Share (%) and BPS Analysis by Product Type, 2023 to 2033

Figure 84: Western Europe Market Y-o-Y Growth (%) Projections by Product Type, 2023 to 2033

Figure 85: Western Europe Market Value (US$ Million) Analysis by Sale Channel, 2018 to 2033

Figure 86: Western Europe Market Volume (Units) Analysis by Sale Channel, 2018 to 2033

Figure 87: Western Europe Market Value Share (%) and BPS Analysis by Sale Channel, 2023 to 2033

Figure 88: Western Europe Market Y-o-Y Growth (%) Projections by Sale Channel, 2023 to 2033

Figure 89: Western Europe Market Value (US$ Million) Analysis by Packaging, 2018 to 2033

Figure 90: Western Europe Market Volume (Units) Analysis by Packaging, 2018 to 2033

Figure 91: Western Europe Market Value Share (%) and BPS Analysis by Packaging, 2023 to 2033

Figure 92: Western Europe Market Y-o-Y Growth (%) Projections by Packaging, 2023 to 2033

Figure 93: Western Europe Market Attractiveness by Product Type, 2023 to 2033

Figure 94: Western Europe Market Attractiveness by Sale Channel, 2023 to 2033

Figure 95: Western Europe Market Attractiveness by Packaging, 2023 to 2033

Figure 96: Western Europe Market Attractiveness by Country, 2023 to 2033

Figure 97: Eastern Europe Market Value (US$ Million) by Product Type, 2023 to 2033

Figure 98: Eastern Europe Market Value (US$ Million) by Sale Channel, 2023 to 2033

Figure 99: Eastern Europe Market Value (US$ Million) by Packaging, 2023 to 2033

Figure 100: Eastern Europe Market Value (US$ Million) by Country, 2023 to 2033

Figure 101: Eastern Europe Market Value (US$ Million) Analysis by Country, 2018 to 2033

Figure 102: Eastern Europe Market Volume (Units) Analysis by Country, 2018 to 2033

Figure 103: Eastern Europe Market Value Share (%) and BPS Analysis by Country, 2023 to 2033

Figure 104: Eastern Europe Market Y-o-Y Growth (%) Projections by Country, 2023 to 2033

Figure 105: Eastern Europe Market Value (US$ Million) Analysis by Product Type, 2018 to 2033

Figure 106: Eastern Europe Market Volume (Units) Analysis by Product Type, 2018 to 2033

Figure 107: Eastern Europe Market Value Share (%) and BPS Analysis by Product Type, 2023 to 2033

Figure 108: Eastern Europe Market Y-o-Y Growth (%) Projections by Product Type, 2023 to 2033

Figure 109: Eastern Europe Market Value (US$ Million) Analysis by Sale Channel, 2018 to 2033

Figure 110: Eastern Europe Market Volume (Units) Analysis by Sale Channel, 2018 to 2033

Figure 111: Eastern Europe Market Value Share (%) and BPS Analysis by Sale Channel, 2023 to 2033

Figure 112: Eastern Europe Market Y-o-Y Growth (%) Projections by Sale Channel, 2023 to 2033

Figure 113: Eastern Europe Market Value (US$ Million) Analysis by Packaging, 2018 to 2033

Figure 114: Eastern Europe Market Volume (Units) Analysis by Packaging, 2018 to 2033

Figure 115: Eastern Europe Market Value Share (%) and BPS Analysis by Packaging, 2023 to 2033

Figure 116: Eastern Europe Market Y-o-Y Growth (%) Projections by Packaging, 2023 to 2033

Figure 117: Eastern Europe Market Attractiveness by Product Type, 2023 to 2033

Figure 118: Eastern Europe Market Attractiveness by Sale Channel, 2023 to 2033

Figure 119: Eastern Europe Market Attractiveness by Packaging, 2023 to 2033

Figure 120: Eastern Europe Market Attractiveness by Country, 2023 to 2033

Figure 121: South Asia and Pacific Market Value (US$ Million) by Product Type, 2023 to 2033

Figure 122: South Asia and Pacific Market Value (US$ Million) by Sale Channel, 2023 to 2033

Figure 123: South Asia and Pacific Market Value (US$ Million) by Packaging, 2023 to 2033

Figure 124: South Asia and Pacific Market Value (US$ Million) by Country, 2023 to 2033

Figure 125: South Asia and Pacific Market Value (US$ Million) Analysis by Country, 2018 to 2033

Figure 126: South Asia and Pacific Market Volume (Units) Analysis by Country, 2018 to 2033

Figure 127: South Asia and Pacific Market Value Share (%) and BPS Analysis by Country, 2023 to 2033

Figure 128: South Asia and Pacific Market Y-o-Y Growth (%) Projections by Country, 2023 to 2033

Figure 129: South Asia and Pacific Market Value (US$ Million) Analysis by Product Type, 2018 to 2033

Figure 130: South Asia and Pacific Market Volume (Units) Analysis by Product Type, 2018 to 2033

Figure 131: South Asia and Pacific Market Value Share (%) and BPS Analysis by Product Type, 2023 to 2033

Figure 132: South Asia and Pacific Market Y-o-Y Growth (%) Projections by Product Type, 2023 to 2033

Figure 133: South Asia and Pacific Market Value (US$ Million) Analysis by Sale Channel, 2018 to 2033

Figure 134: South Asia and Pacific Market Volume (Units) Analysis by Sale Channel, 2018 to 2033

Figure 135: South Asia and Pacific Market Value Share (%) and BPS Analysis by Sale Channel, 2023 to 2033

Figure 136: South Asia and Pacific Market Y-o-Y Growth (%) Projections by Sale Channel, 2023 to 2033

Figure 137: South Asia and Pacific Market Value (US$ Million) Analysis by Packaging, 2018 to 2033

Figure 138: South Asia and Pacific Market Volume (Units) Analysis by Packaging, 2018 to 2033

Figure 139: South Asia and Pacific Market Value Share (%) and BPS Analysis by Packaging, 2023 to 2033

Figure 140: South Asia and Pacific Market Y-o-Y Growth (%) Projections by Packaging, 2023 to 2033

Figure 141: South Asia and Pacific Market Attractiveness by Product Type, 2023 to 2033

Figure 142: South Asia and Pacific Market Attractiveness by Sale Channel, 2023 to 2033

Figure 143: South Asia and Pacific Market Attractiveness by Packaging, 2023 to 2033

Figure 144: South Asia and Pacific Market Attractiveness by Country, 2023 to 2033

Figure 145: East Asia Market Value (US$ Million) by Product Type, 2023 to 2033

Figure 146: East Asia Market Value (US$ Million) by Sale Channel, 2023 to 2033

Figure 147: East Asia Market Value (US$ Million) by Packaging, 2023 to 2033

Figure 148: East Asia Market Value (US$ Million) by Country, 2023 to 2033

Figure 149: East Asia Market Value (US$ Million) Analysis by Country, 2018 to 2033

Figure 150: East Asia Market Volume (Units) Analysis by Country, 2018 to 2033

Figure 151: East Asia Market Value Share (%) and BPS Analysis by Country, 2023 to 2033

Figure 152: East Asia Market Y-o-Y Growth (%) Projections by Country, 2023 to 2033

Figure 153: East Asia Market Value (US$ Million) Analysis by Product Type, 2018 to 2033

Figure 154: East Asia Market Volume (Units) Analysis by Product Type, 2018 to 2033

Figure 155: East Asia Market Value Share (%) and BPS Analysis by Product Type, 2023 to 2033

Figure 156: East Asia Market Y-o-Y Growth (%) Projections by Product Type, 2023 to 2033

Figure 157: East Asia Market Value (US$ Million) Analysis by Sale Channel, 2018 to 2033

Figure 158: East Asia Market Volume (Units) Analysis by Sale Channel, 2018 to 2033

Figure 159: East Asia Market Value Share (%) and BPS Analysis by Sale Channel, 2023 to 2033

Figure 160: East Asia Market Y-o-Y Growth (%) Projections by Sale Channel, 2023 to 2033

Figure 161: East Asia Market Value (US$ Million) Analysis by Packaging, 2018 to 2033

Figure 162: East Asia Market Volume (Units) Analysis by Packaging, 2018 to 2033

Figure 163: East Asia Market Value Share (%) and BPS Analysis by Packaging, 2023 to 2033

Figure 164: East Asia Market Y-o-Y Growth (%) Projections by Packaging, 2023 to 2033

Figure 165: East Asia Market Attractiveness by Product Type, 2023 to 2033

Figure 166: East Asia Market Attractiveness by Sale Channel, 2023 to 2033

Figure 167: East Asia Market Attractiveness by Packaging, 2023 to 2033

Figure 168: East Asia Market Attractiveness by Country, 2023 to 2033

Figure 169: Middle East and Africa Market Value (US$ Million) by Product Type, 2023 to 2033

Figure 170: Middle East and Africa Market Value (US$ Million) by Sale Channel, 2023 to 2033

Figure 171: Middle East and Africa Market Value (US$ Million) by Packaging, 2023 to 2033

Figure 172: Middle East and Africa Market Value (US$ Million) by Country, 2023 to 2033

Figure 173: Middle East and Africa Market Value (US$ Million) Analysis by Country, 2018 to 2033

Figure 174: Middle East and Africa Market Volume (Units) Analysis by Country, 2018 to 2033

Figure 175: Middle East and Africa Market Value Share (%) and BPS Analysis by Country, 2023 to 2033

Figure 176: Middle East and Africa Market Y-o-Y Growth (%) Projections by Country, 2023 to 2033

Figure 177: Middle East and Africa Market Value (US$ Million) Analysis by Product Type, 2018 to 2033

Figure 178: Middle East and Africa Market Volume (Units) Analysis by Product Type, 2018 to 2033

Figure 179: Middle East and Africa Market Value Share (%) and BPS Analysis by Product Type, 2023 to 2033

Figure 180: Middle East and Africa Market Y-o-Y Growth (%) Projections by Product Type, 2023 to 2033

Figure 181: Middle East and Africa Market Value (US$ Million) Analysis by Sale Channel, 2018 to 2033

Figure 182: Middle East and Africa Market Volume (Units) Analysis by Sale Channel, 2018 to 2033

Figure 183: Middle East and Africa Market Value Share (%) and BPS Analysis by Sale Channel, 2023 to 2033

Figure 184: Middle East and Africa Market Y-o-Y Growth (%) Projections by Sale Channel, 2023 to 2033

Figure 185: Middle East and Africa Market Value (US$ Million) Analysis by Packaging, 2018 to 2033

Figure 186: Middle East and Africa Market Volume (Units) Analysis by Packaging, 2018 to 2033

Figure 187: Middle East and Africa Market Value Share (%) and BPS Analysis by Packaging, 2023 to 2033

Figure 188: Middle East and Africa Market Y-o-Y Growth (%) Projections by Packaging, 2023 to 2033

Figure 189: Middle East and Africa Market Attractiveness by Product Type, 2023 to 2033

Figure 190: Middle East and Africa Market Attractiveness by Sale Channel, 2023 to 2033

Figure 191: Middle East and Africa Market Attractiveness by Packaging, 2023 to 2033

Figure 192: Middle East and Africa Market Attractiveness by Country, 2023 to 2033

Recommendations

Food and Beverage

Jellies and Gummies Market

Published : May 2023

Food and Beverage

CoQ10 Gummies Market

Published : October 2022

Explore Food and Beverage Insights

View Reports