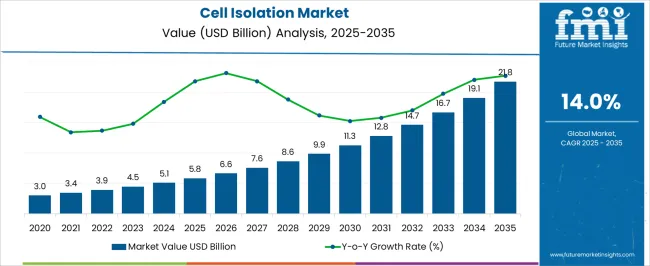
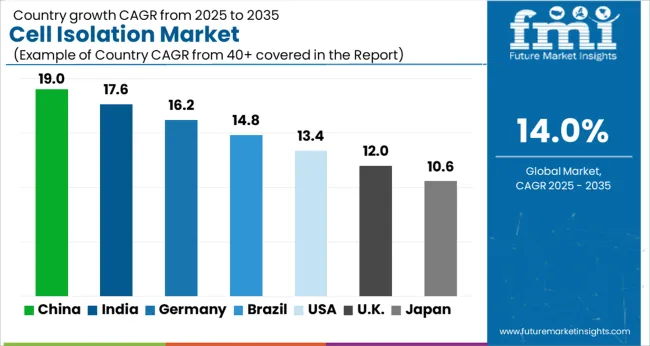
The cell isolation market is estimated at USD 5.1 billion by 2024. The market valuation is expected to be USD 19.1 billion by 2034, registering an impressive CAGR of 14.1%.
The market is a rapidly growing sector driven by advancements in biomedical research and clinical applications. It involves separating specific cell types from heterogeneous samples, enabling precise analysis and experimentation.
Key factors propelling market growth include rising demand for personalized medicine, increasing prevalence of chronic diseases, and expanding research in areas like cancer and regenerative medicine.
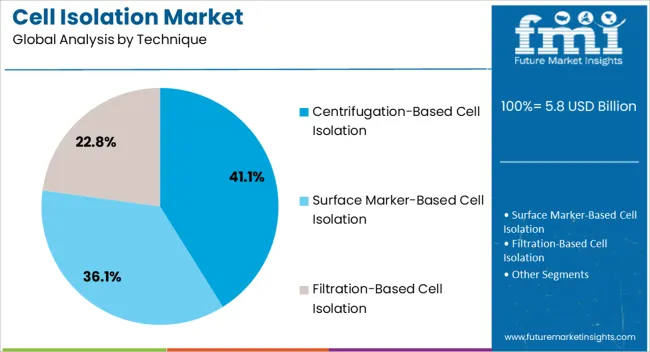
Traditional methods, such as centrifugation and filtration, coexist with innovative technologies like magnetic-activated cell sorting (MACS) and fluorescence-activated cell sorting (FACS).
The market is characterized by competitive dynamics, with key players continuously introducing novel isolation techniques and automation to enhance efficiency.
As the demand for targeted cell isolation solutions escalates, the market is poised for sustained expansion, offering promising opportunities for companies developing and supplying cell isolation technologies.
Key Market Trends and Highlights
Attributes | Key Insights |
---|---|
Market Estimated Size in 2024 | USD 5.1 billion |
Projected Market Size in 2034 | USD 19.1 billion |
Value-based CAGR from 2024 to 2034 | 14.1% |
The scope for global cell isolation market insights expanded at an 18.9% CAGR between 2019 and 2023. The market is anticipated to develop at a CAGR of 14.1% over the forecast period from 2024 to 2034.
Historical CAGR from 2019 to 2023 | 18.9% |
---|---|
Forecast CAGR from 2024 to 2034 | 14.1% |
Between 2019 and 2023, the global market experienced substantial growth, marked by a CAGR of 18.9%. This period witnessed a surge in demand for advanced cell isolation technologies, driven by increased focus on personalized medicine, rising prevalence of chronic diseases, and continuous advancements in biomedical research.
The market expansion during these years reflected the dynamic nature of the biomedical sector, with researchers and healthcare professionals increasingly relying on precise cell isolation methods to propel their studies and therapeutic developments.
The industry is expected to maintain robust growth, albeit at a slightly moderated pace, with a forecasted CAGR of 14.1% from 2024 to 2034. This projection indicates a positive trajectory, suggesting sustained demand for cell isolation technologies.
Factors contributing to this forecasted growth include an ongoing emphasis on personalized medicine, the persistent rise in chronic diseases globally, and the evolution of innovative isolation techniques.
As the market enters the forecast period, the anticipated expansion underscores the enduring significance of cell isolation in advancing biomedical research and meeting the evolving needs of the healthcare industry.
Attributes | Details |
---|---|
Drivers |
|
The table below highlights CAGRs from the five countries spearheaded by the United States, Japan, China, the United Kingdom, and South Korea. The market in South Korea is dynamic and rapidly advancing, poised for significant growth with a 15.7% CAGR by 2034. Embracing innovation, the country thus, contributes to diverse industries, showcasing a thriving landscape in its economic evolution.
Countries | CAGRs from 2024 to 2034 |
---|---|
The United States | 14.2% |
Japan | 15.4% |
China | 14.4% |
The United Kingdom | 15.5% |
South Korea | 15.7% |
In the United States, the market experiences significant utilization due to the robust biomedical research infrastructure and a thriving healthcare industry.
The demand for cell isolation technologies is driven by extensive research in cancer biology, regenerative medicine, and personalized medicine.
The United States is a global hub for cutting-edge research. Adopting advanced cell isolation methods is pivotal for exploring disease mechanisms, developing targeted therapies, and advancing clinical applications.
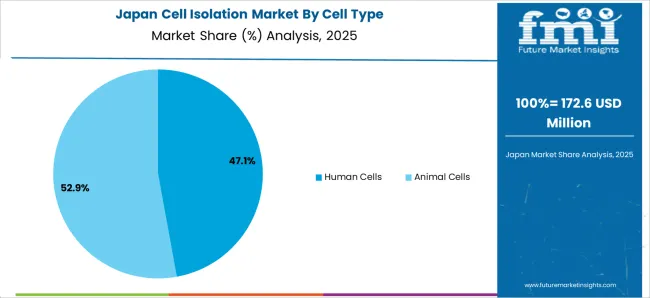
The strong emphasis on technological innovation and its leading position in life sciences contribute to the widespread use of cell isolation technologies. The country focuses on precision medicine and advanced healthcare solutions propels the demand for precise cell isolation methods.
The commitment to regenerative medicine and its aging population drive the need for efficient cell isolation techniques in therapeutic applications. This makes it a key market for the continued growth of cell isolation technologies.
The market in China is experiencing substantial growth due to the expanding biomedical research landscape and increasing investments in healthcare infrastructure of the country.
The large population and rising incidences of chronic diseases fuel the demand for advanced cell isolation methods for research and clinical applications. The commitment to scientific innovation and the integration of cell isolation technologies in disease studies contribute to the major utilization within the country.
The prominence of scientific research, particularly in fields like genomics and precision medicine, drives the extensive use of cell isolation technologies.
The well-established healthcare system of the country and focus on translational research contribute to the high demand for advanced cell isolation methods.
The commitment to staying at the forefront of biomedical advancements ensures a sustained need for precise cell isolation techniques in various research and clinical applications.
The dynamic research environment and technological innovation contribute to the significant adoption of cell isolation technologies. The growing interest in personalized medicine, regenerative medicine, and biotechnology fuels the demand for advanced cell isolation methods.
The strategic investments in research and development and a focus on advancing healthcare solutions position cell isolation technologies as crucial tools for advancing scientific understanding and clinical applications within the country.
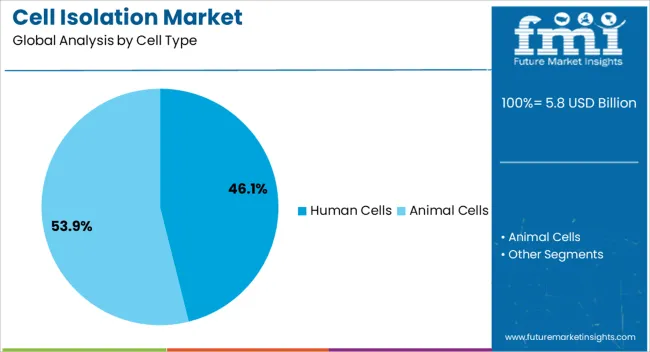
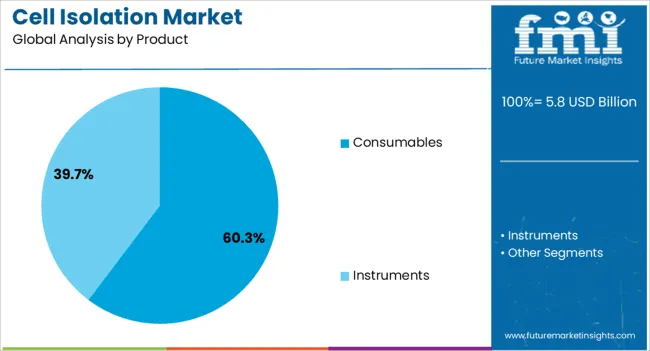
The table below provides an overview of the cell isolation landscape on the basis of cell type and product type. Human cells are projected to lead the cell type market at a 13.9% CAGR by 2034, while consumables in the product type category are likely to expand at a CAGR of 13.6% by 2034.
The increasing emphasis on personalized medicine and the intricate study of human biology propels the prominence of human cells in the cell isolation landscape. The driving force behind the substantial growth of consumables in the market lies in the integral role these materials play in supporting isolation processes.
Category | CAGR by 2034 |
---|---|
Human Cells | 13.9% |
Consumables | 13.6% |
The cell isolation landscape is categorized based on cell types, with human cells emerging as a prominent segment poised for substantial growth. Projections indicate a CAGR of 13.9% for human cells by 2034.
This signifies a robust and sustained demand for technologies specifically tailored to isolating human cells for various biomedical research and clinical applications.
The increasing focus on personalized medicine and the intricate study of human cell behavior drive the demand for advanced cell isolation techniques, positioning human cells as a pivotal and evolving segment within the broader market.
The market is further delineated based on product types, with consumables significantly shaping the landscape. Projections suggest a noteworthy CAGR of 13.6% for consumables by 2034, highlighting their integral role in cell isolation processes.
Consumables encompass a range of materials essential for cell isolation protocols, including reagents, buffers, and disposable instruments. The consistent demand for these consumables is attributed to the ongoing advancements in isolation technologies and the increasing adoption of automated systems.
As consumables witness sustained growth, they underscore the crucial support infrastructure required for efficient and scalable cell isolation processes across diverse applications in research, diagnostics, and therapeutic development.
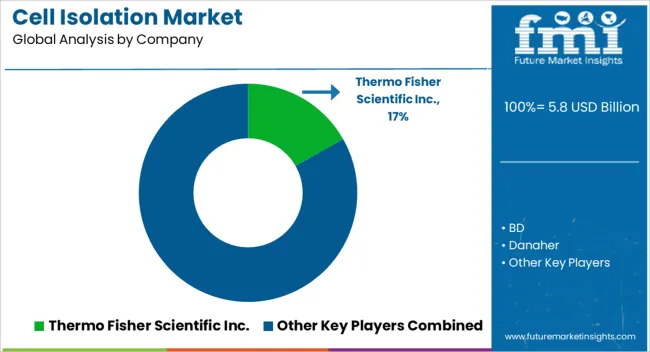
The cell isolation market boasts a dynamic and competitive landscape characterized by prominent players striving for innovation and market dominance.
The key players engage in strategic collaborations, mergers, and acquisitions to expand their product portfolios and geographic presence. The competitive arena is further fueled by the influx of new entrants, fostering a climate of innovation and pushing established players to adapt swiftly to emerging trends, ensuring sustained growth in this dynamic market.
Emphasis is placed on automation and user-friendly solutions to enhance efficiency. Strategic partnerships with research institutions and healthcare organizations are integral to market strategies, facilitating the integration of novel technologies into diverse applications.
Some recent developments in the cell isolation domain are as follows:
Attributes | Details |
---|---|
Estimated Market Size in 2024 | USD 5.1 billion |
Projected Market Valuation in 2034 | USD 19.1 billion |
CAGR Share from 2024 to 2034 | 14.1% |
Forecast Period | 2024 to 2034 |
Historical Data Available for | 2019 to 2023 |
Market Analysis | Value in USD billion |
Key Regions Covered | North America; Latin America; Western Europe; Eastern Europe; South Asia and Pacific; East Asia; Middle East and Africa |
Key Market Segments Covered | By Cell Type, By Product, By Technique, By End-user, By Application, By Region |
Key Countries Profiled | The United States, Canada, Brazil, Mexico, Germany, The United Kingdom, France, Spain, Italy, Poland, Russia, Czech Republic, Romania, India, Bangladesh, Australia, New Zealand, China, Japan, South Korea, GCC Countries, South Africa, Israel |
Key Companies Profiled | Thermo Fisher Scientific Inc.; BD; Danaher; Terumo Corp.; STEMCELL Technologies Inc.; Bio-Rad Laboratories Inc.; Merck KGaA; Agilent Technologies Inc.; Corning Inc.; Akadeum Life Sciences |
Table 1: Global Market Value (US$ Million) Forecast by Region, 2019 to 2034
Table 2: Global Market Value (US$ Million) Forecast by Cell Type, 2019 to 2034
Table 3: Global Market Value (US$ Million) Forecast by Product, 2019 to 2034
Table 4: Global Market Value (US$ Million) Forecast by Technique, 2019 to 2034
Table 5: Global Market Value (US$ Million) Forecast by End User, 2019 to 2034
Table 6: Global Market Value (US$ Million) Forecast by Application, 2019 to 2034
Table 7: North America Market Value (US$ Million) Forecast by Country, 2019 to 2034
Table 8: North America Market Value (US$ Million) Forecast by Cell Type, 2019 to 2034
Table 9: North America Market Value (US$ Million) Forecast by Product, 2019 to 2034
Table 10: North America Market Value (US$ Million) Forecast by Technique, 2019 to 2034
Table 11: North America Market Value (US$ Million) Forecast by End User, 2019 to 2034
Table 12: North America Market Value (US$ Million) Forecast by Application, 2019 to 2034
Table 13: Latin America Market Value (US$ Million) Forecast by Country, 2019 to 2034
Table 14: Latin America Market Value (US$ Million) Forecast by Cell Type, 2019 to 2034
Table 15: Latin America Market Value (US$ Million) Forecast by Product, 2019 to 2034
Table 16: Latin America Market Value (US$ Million) Forecast by Technique, 2019 to 2034
Table 17: Latin America Market Value (US$ Million) Forecast by End User, 2019 to 2034
Table 18: Latin America Market Value (US$ Million) Forecast by Application, 2019 to 2034
Table 19: Western Europe Market Value (US$ Million) Forecast by Country, 2019 to 2034
Table 20: Western Europe Market Value (US$ Million) Forecast by Cell Type, 2019 to 2034
Table 21: Western Europe Market Value (US$ Million) Forecast by Product, 2019 to 2034
Table 22: Western Europe Market Value (US$ Million) Forecast by Technique, 2019 to 2034
Table 23: Western Europe Market Value (US$ Million) Forecast by End User, 2019 to 2034
Table 24: Western Europe Market Value (US$ Million) Forecast by Application, 2019 to 2034
Table 25: Eastern Europe Market Value (US$ Million) Forecast by Country, 2019 to 2034
Table 26: Eastern Europe Market Value (US$ Million) Forecast by Cell Type, 2019 to 2034
Table 27: Eastern Europe Market Value (US$ Million) Forecast by Product, 2019 to 2034
Table 28: Eastern Europe Market Value (US$ Million) Forecast by Technique, 2019 to 2034
Table 29: Eastern Europe Market Value (US$ Million) Forecast by End User, 2019 to 2034
Table 30: Eastern Europe Market Value (US$ Million) Forecast by Application, 2019 to 2034
Table 31: South Asia and Pacific Market Value (US$ Million) Forecast by Country, 2019 to 2034
Table 32: South Asia and Pacific Market Value (US$ Million) Forecast by Cell Type, 2019 to 2034
Table 33: South Asia and Pacific Market Value (US$ Million) Forecast by Product, 2019 to 2034
Table 34: South Asia and Pacific Market Value (US$ Million) Forecast by Technique, 2019 to 2034
Table 35: South Asia and Pacific Market Value (US$ Million) Forecast by End User, 2019 to 2034
Table 36: South Asia and Pacific Market Value (US$ Million) Forecast by Application, 2019 to 2034
Table 37: East Asia Market Value (US$ Million) Forecast by Country, 2019 to 2034
Table 38: East Asia Market Value (US$ Million) Forecast by Cell Type, 2019 to 2034
Table 39: East Asia Market Value (US$ Million) Forecast by Product, 2019 to 2034
Table 40: East Asia Market Value (US$ Million) Forecast by Technique, 2019 to 2034
Table 41: East Asia Market Value (US$ Million) Forecast by End User, 2019 to 2034
Table 42: East Asia Market Value (US$ Million) Forecast by Application, 2019 to 2034
Table 43: Middle East and Africa Market Value (US$ Million) Forecast by Country, 2019 to 2034
Table 44: Middle East and Africa Market Value (US$ Million) Forecast by Cell Type, 2019 to 2034
Table 45: Middle East and Africa Market Value (US$ Million) Forecast by Product, 2019 to 2034
Table 46: Middle East and Africa Market Value (US$ Million) Forecast by Technique, 2019 to 2034
Table 47: Middle East and Africa Market Value (US$ Million) Forecast by End User, 2019 to 2034
Table 48: Middle East and Africa Market Value (US$ Million) Forecast by Application, 2019 to 2034
Figure 1: Global Market Value (US$ Million) by Cell Type, 2024 to 2034
Figure 2: Global Market Value (US$ Million) by Product, 2024 to 2034
Figure 3: Global Market Value (US$ Million) by Technique, 2024 to 2034
Figure 4: Global Market Value (US$ Million) by End User, 2024 to 2034
Figure 5: Global Market Value (US$ Million) by Application, 2024 to 2034
Figure 6: Global Market Value (US$ Million) by Region, 2024 to 2034
Figure 7: Global Market Value (US$ Million) Analysis by Region, 2019 to 2034
Figure 8: Global Market Value Share (%) and BPS Analysis by Region, 2024 to 2034
Figure 9: Global Market Y-o-Y Growth (%) Projections by Region, 2024 to 2034
Figure 10: Global Market Value (US$ Million) Analysis by Cell Type, 2019 to 2034
Figure 11: Global Market Value Share (%) and BPS Analysis by Cell Type, 2024 to 2034
Figure 12: Global Market Y-o-Y Growth (%) Projections by Cell Type, 2024 to 2034
Figure 13: Global Market Value (US$ Million) Analysis by Product, 2019 to 2034
Figure 14: Global Market Value Share (%) and BPS Analysis by Product, 2024 to 2034
Figure 15: Global Market Y-o-Y Growth (%) Projections by Product, 2024 to 2034
Figure 16: Global Market Value (US$ Million) Analysis by Technique, 2019 to 2034
Figure 17: Global Market Value Share (%) and BPS Analysis by Technique, 2024 to 2034
Figure 18: Global Market Y-o-Y Growth (%) Projections by Technique, 2024 to 2034
Figure 19: Global Market Value (US$ Million) Analysis by End User, 2019 to 2034
Figure 20: Global Market Value Share (%) and BPS Analysis by End User, 2024 to 2034
Figure 21: Global Market Y-o-Y Growth (%) Projections by End User, 2024 to 2034
Figure 22: Global Market Value (US$ Million) Analysis by Application, 2019 to 2034
Figure 23: Global Market Value Share (%) and BPS Analysis by Application, 2024 to 2034
Figure 24: Global Market Y-o-Y Growth (%) Projections by Application, 2024 to 2034
Figure 25: Global Market Attractiveness by Cell Type, 2024 to 2034
Figure 26: Global Market Attractiveness by Product, 2024 to 2034
Figure 27: Global Market Attractiveness by Technique, 2024 to 2034
Figure 28: Global Market Attractiveness by End User, 2024 to 2034
Figure 29: Global Market Attractiveness by Application, 2024 to 2034
Figure 30: Global Market Attractiveness by Region, 2024 to 2034
Figure 31: North America Market Value (US$ Million) by Cell Type, 2024 to 2034
Figure 32: North America Market Value (US$ Million) by Product, 2024 to 2034
Figure 33: North America Market Value (US$ Million) by Technique, 2024 to 2034
Figure 34: North America Market Value (US$ Million) by End User, 2024 to 2034
Figure 35: North America Market Value (US$ Million) by Application, 2024 to 2034
Figure 36: North America Market Value (US$ Million) by Country, 2024 to 2034
Figure 37: North America Market Value (US$ Million) Analysis by Country, 2019 to 2034
Figure 38: North America Market Value Share (%) and BPS Analysis by Country, 2024 to 2034
Figure 39: North America Market Y-o-Y Growth (%) Projections by Country, 2024 to 2034
Figure 40: North America Market Value (US$ Million) Analysis by Cell Type, 2019 to 2034
Figure 41: North America Market Value Share (%) and BPS Analysis by Cell Type, 2024 to 2034
Figure 42: North America Market Y-o-Y Growth (%) Projections by Cell Type, 2024 to 2034
Figure 43: North America Market Value (US$ Million) Analysis by Product, 2019 to 2034
Figure 44: North America Market Value Share (%) and BPS Analysis by Product, 2024 to 2034
Figure 45: North America Market Y-o-Y Growth (%) Projections by Product, 2024 to 2034
Figure 46: North America Market Value (US$ Million) Analysis by Technique, 2019 to 2034
Figure 47: North America Market Value Share (%) and BPS Analysis by Technique, 2024 to 2034
Figure 48: North America Market Y-o-Y Growth (%) Projections by Technique, 2024 to 2034
Figure 49: North America Market Value (US$ Million) Analysis by End User, 2019 to 2034
Figure 50: North America Market Value Share (%) and BPS Analysis by End User, 2024 to 2034
Figure 51: North America Market Y-o-Y Growth (%) Projections by End User, 2024 to 2034
Figure 52: North America Market Value (US$ Million) Analysis by Application, 2019 to 2034
Figure 53: North America Market Value Share (%) and BPS Analysis by Application, 2024 to 2034
Figure 54: North America Market Y-o-Y Growth (%) Projections by Application, 2024 to 2034
Figure 55: North America Market Attractiveness by Cell Type, 2024 to 2034
Figure 56: North America Market Attractiveness by Product, 2024 to 2034
Figure 57: North America Market Attractiveness by Technique, 2024 to 2034
Figure 58: North America Market Attractiveness by End User, 2024 to 2034
Figure 59: North America Market Attractiveness by Application, 2024 to 2034
Figure 60: North America Market Attractiveness by Country, 2024 to 2034
Figure 61: Latin America Market Value (US$ Million) by Cell Type, 2024 to 2034
Figure 62: Latin America Market Value (US$ Million) by Product, 2024 to 2034
Figure 63: Latin America Market Value (US$ Million) by Technique, 2024 to 2034
Figure 64: Latin America Market Value (US$ Million) by End User, 2024 to 2034
Figure 65: Latin America Market Value (US$ Million) by Application, 2024 to 2034
Figure 66: Latin America Market Value (US$ Million) by Country, 2024 to 2034
Figure 67: Latin America Market Value (US$ Million) Analysis by Country, 2019 to 2034
Figure 68: Latin America Market Value Share (%) and BPS Analysis by Country, 2024 to 2034
Figure 69: Latin America Market Y-o-Y Growth (%) Projections by Country, 2024 to 2034
Figure 70: Latin America Market Value (US$ Million) Analysis by Cell Type, 2019 to 2034
Figure 71: Latin America Market Value Share (%) and BPS Analysis by Cell Type, 2024 to 2034
Figure 72: Latin America Market Y-o-Y Growth (%) Projections by Cell Type, 2024 to 2034
Figure 73: Latin America Market Value (US$ Million) Analysis by Product, 2019 to 2034
Figure 74: Latin America Market Value Share (%) and BPS Analysis by Product, 2024 to 2034
Figure 75: Latin America Market Y-o-Y Growth (%) Projections by Product, 2024 to 2034
Figure 76: Latin America Market Value (US$ Million) Analysis by Technique, 2019 to 2034
Figure 77: Latin America Market Value Share (%) and BPS Analysis by Technique, 2024 to 2034
Figure 78: Latin America Market Y-o-Y Growth (%) Projections by Technique, 2024 to 2034
Figure 79: Latin America Market Value (US$ Million) Analysis by End User, 2019 to 2034
Figure 80: Latin America Market Value Share (%) and BPS Analysis by End User, 2024 to 2034
Figure 81: Latin America Market Y-o-Y Growth (%) Projections by End User, 2024 to 2034
Figure 82: Latin America Market Value (US$ Million) Analysis by Application, 2019 to 2034
Figure 83: Latin America Market Value Share (%) and BPS Analysis by Application, 2024 to 2034
Figure 84: Latin America Market Y-o-Y Growth (%) Projections by Application, 2024 to 2034
Figure 85: Latin America Market Attractiveness by Cell Type, 2024 to 2034
Figure 86: Latin America Market Attractiveness by Product, 2024 to 2034
Figure 87: Latin America Market Attractiveness by Technique, 2024 to 2034
Figure 88: Latin America Market Attractiveness by End User, 2024 to 2034
Figure 89: Latin America Market Attractiveness by Application, 2024 to 2034
Figure 90: Latin America Market Attractiveness by Country, 2024 to 2034
Figure 91: Western Europe Market Value (US$ Million) by Cell Type, 2024 to 2034
Figure 92: Western Europe Market Value (US$ Million) by Product, 2024 to 2034
Figure 93: Western Europe Market Value (US$ Million) by Technique, 2024 to 2034
Figure 94: Western Europe Market Value (US$ Million) by End User, 2024 to 2034
Figure 95: Western Europe Market Value (US$ Million) by Application, 2024 to 2034
Figure 96: Western Europe Market Value (US$ Million) by Country, 2024 to 2034
Figure 97: Western Europe Market Value (US$ Million) Analysis by Country, 2019 to 2034
Figure 98: Western Europe Market Value Share (%) and BPS Analysis by Country, 2024 to 2034
Figure 99: Western Europe Market Y-o-Y Growth (%) Projections by Country, 2024 to 2034
Figure 100: Western Europe Market Value (US$ Million) Analysis by Cell Type, 2019 to 2034
Figure 101: Western Europe Market Value Share (%) and BPS Analysis by Cell Type, 2024 to 2034
Figure 102: Western Europe Market Y-o-Y Growth (%) Projections by Cell Type, 2024 to 2034
Figure 103: Western Europe Market Value (US$ Million) Analysis by Product, 2019 to 2034
Figure 104: Western Europe Market Value Share (%) and BPS Analysis by Product, 2024 to 2034
Figure 105: Western Europe Market Y-o-Y Growth (%) Projections by Product, 2024 to 2034
Figure 106: Western Europe Market Value (US$ Million) Analysis by Technique, 2019 to 2034
Figure 107: Western Europe Market Value Share (%) and BPS Analysis by Technique, 2024 to 2034
Figure 108: Western Europe Market Y-o-Y Growth (%) Projections by Technique, 2024 to 2034
Figure 109: Western Europe Market Value (US$ Million) Analysis by End User, 2019 to 2034
Figure 110: Western Europe Market Value Share (%) and BPS Analysis by End User, 2024 to 2034
Figure 111: Western Europe Market Y-o-Y Growth (%) Projections by End User, 2024 to 2034
Figure 112: Western Europe Market Value (US$ Million) Analysis by Application, 2019 to 2034
Figure 113: Western Europe Market Value Share (%) and BPS Analysis by Application, 2024 to 2034
Figure 114: Western Europe Market Y-o-Y Growth (%) Projections by Application, 2024 to 2034
Figure 115: Western Europe Market Attractiveness by Cell Type, 2024 to 2034
Figure 116: Western Europe Market Attractiveness by Product, 2024 to 2034
Figure 117: Western Europe Market Attractiveness by Technique, 2024 to 2034
Figure 118: Western Europe Market Attractiveness by End User, 2024 to 2034
Figure 119: Western Europe Market Attractiveness by Application, 2024 to 2034
Figure 120: Western Europe Market Attractiveness by Country, 2024 to 2034
Figure 121: Eastern Europe Market Value (US$ Million) by Cell Type, 2024 to 2034
Figure 122: Eastern Europe Market Value (US$ Million) by Product, 2024 to 2034
Figure 123: Eastern Europe Market Value (US$ Million) by Technique, 2024 to 2034
Figure 124: Eastern Europe Market Value (US$ Million) by End User, 2024 to 2034
Figure 125: Eastern Europe Market Value (US$ Million) by Application, 2024 to 2034
Figure 126: Eastern Europe Market Value (US$ Million) by Country, 2024 to 2034
Figure 127: Eastern Europe Market Value (US$ Million) Analysis by Country, 2019 to 2034
Figure 128: Eastern Europe Market Value Share (%) and BPS Analysis by Country, 2024 to 2034
Figure 129: Eastern Europe Market Y-o-Y Growth (%) Projections by Country, 2024 to 2034
Figure 130: Eastern Europe Market Value (US$ Million) Analysis by Cell Type, 2019 to 2034
Figure 131: Eastern Europe Market Value Share (%) and BPS Analysis by Cell Type, 2024 to 2034
Figure 132: Eastern Europe Market Y-o-Y Growth (%) Projections by Cell Type, 2024 to 2034
Figure 133: Eastern Europe Market Value (US$ Million) Analysis by Product, 2019 to 2034
Figure 134: Eastern Europe Market Value Share (%) and BPS Analysis by Product, 2024 to 2034
Figure 135: Eastern Europe Market Y-o-Y Growth (%) Projections by Product, 2024 to 2034
Figure 136: Eastern Europe Market Value (US$ Million) Analysis by Technique, 2019 to 2034
Figure 137: Eastern Europe Market Value Share (%) and BPS Analysis by Technique, 2024 to 2034
Figure 138: Eastern Europe Market Y-o-Y Growth (%) Projections by Technique, 2024 to 2034
Figure 139: Eastern Europe Market Value (US$ Million) Analysis by End User, 2019 to 2034
Figure 140: Eastern Europe Market Value Share (%) and BPS Analysis by End User, 2024 to 2034
Figure 141: Eastern Europe Market Y-o-Y Growth (%) Projections by End User, 2024 to 2034
Figure 142: Eastern Europe Market Value (US$ Million) Analysis by Application, 2019 to 2034
Figure 143: Eastern Europe Market Value Share (%) and BPS Analysis by Application, 2024 to 2034
Figure 144: Eastern Europe Market Y-o-Y Growth (%) Projections by Application, 2024 to 2034
Figure 145: Eastern Europe Market Attractiveness by Cell Type, 2024 to 2034
Figure 146: Eastern Europe Market Attractiveness by Product, 2024 to 2034
Figure 147: Eastern Europe Market Attractiveness by Technique, 2024 to 2034
Figure 148: Eastern Europe Market Attractiveness by End User, 2024 to 2034
Figure 149: Eastern Europe Market Attractiveness by Application, 2024 to 2034
Figure 150: Eastern Europe Market Attractiveness by Country, 2024 to 2034
Figure 151: South Asia and Pacific Market Value (US$ Million) by Cell Type, 2024 to 2034
Figure 152: South Asia and Pacific Market Value (US$ Million) by Product, 2024 to 2034
Figure 153: South Asia and Pacific Market Value (US$ Million) by Technique, 2024 to 2034
Figure 154: South Asia and Pacific Market Value (US$ Million) by End User, 2024 to 2034
Figure 155: South Asia and Pacific Market Value (US$ Million) by Application, 2024 to 2034
Figure 156: South Asia and Pacific Market Value (US$ Million) by Country, 2024 to 2034
Figure 157: South Asia and Pacific Market Value (US$ Million) Analysis by Country, 2019 to 2034
Figure 158: South Asia and Pacific Market Value Share (%) and BPS Analysis by Country, 2024 to 2034
Figure 159: South Asia and Pacific Market Y-o-Y Growth (%) Projections by Country, 2024 to 2034
Figure 160: South Asia and Pacific Market Value (US$ Million) Analysis by Cell Type, 2019 to 2034
Figure 161: South Asia and Pacific Market Value Share (%) and BPS Analysis by Cell Type, 2024 to 2034
Figure 162: South Asia and Pacific Market Y-o-Y Growth (%) Projections by Cell Type, 2024 to 2034
Figure 163: South Asia and Pacific Market Value (US$ Million) Analysis by Product, 2019 to 2034
Figure 164: South Asia and Pacific Market Value Share (%) and BPS Analysis by Product, 2024 to 2034
Figure 165: South Asia and Pacific Market Y-o-Y Growth (%) Projections by Product, 2024 to 2034
Figure 166: South Asia and Pacific Market Value (US$ Million) Analysis by Technique, 2019 to 2034
Figure 167: South Asia and Pacific Market Value Share (%) and BPS Analysis by Technique, 2024 to 2034
Figure 168: South Asia and Pacific Market Y-o-Y Growth (%) Projections by Technique, 2024 to 2034
Figure 169: South Asia and Pacific Market Value (US$ Million) Analysis by End User, 2019 to 2034
Figure 170: South Asia and Pacific Market Value Share (%) and BPS Analysis by End User, 2024 to 2034
Figure 171: South Asia and Pacific Market Y-o-Y Growth (%) Projections by End User, 2024 to 2034
Figure 172: South Asia and Pacific Market Value (US$ Million) Analysis by Application, 2019 to 2034
Figure 173: South Asia and Pacific Market Value Share (%) and BPS Analysis by Application, 2024 to 2034
Figure 174: South Asia and Pacific Market Y-o-Y Growth (%) Projections by Application, 2024 to 2034
Figure 175: South Asia and Pacific Market Attractiveness by Cell Type, 2024 to 2034
Figure 176: South Asia and Pacific Market Attractiveness by Product, 2024 to 2034
Figure 177: South Asia and Pacific Market Attractiveness by Technique, 2024 to 2034
Figure 178: South Asia and Pacific Market Attractiveness by End User, 2024 to 2034
Figure 179: South Asia and Pacific Market Attractiveness by Application, 2024 to 2034
Figure 180: South Asia and Pacific Market Attractiveness by Country, 2024 to 2034
Figure 181: East Asia Market Value (US$ Million) by Cell Type, 2024 to 2034
Figure 182: East Asia Market Value (US$ Million) by Product, 2024 to 2034
Figure 183: East Asia Market Value (US$ Million) by Technique, 2024 to 2034
Figure 184: East Asia Market Value (US$ Million) by End User, 2024 to 2034
Figure 185: East Asia Market Value (US$ Million) by Application, 2024 to 2034
Figure 186: East Asia Market Value (US$ Million) by Country, 2024 to 2034
Figure 187: East Asia Market Value (US$ Million) Analysis by Country, 2019 to 2034
Figure 188: East Asia Market Value Share (%) and BPS Analysis by Country, 2024 to 2034
Figure 189: East Asia Market Y-o-Y Growth (%) Projections by Country, 2024 to 2034
Figure 190: East Asia Market Value (US$ Million) Analysis by Cell Type, 2019 to 2034
Figure 191: East Asia Market Value Share (%) and BPS Analysis by Cell Type, 2024 to 2034
Figure 192: East Asia Market Y-o-Y Growth (%) Projections by Cell Type, 2024 to 2034
Figure 193: East Asia Market Value (US$ Million) Analysis by Product, 2019 to 2034
Figure 194: East Asia Market Value Share (%) and BPS Analysis by Product, 2024 to 2034
Figure 195: East Asia Market Y-o-Y Growth (%) Projections by Product, 2024 to 2034
Figure 196: East Asia Market Value (US$ Million) Analysis by Technique, 2019 to 2034
Figure 197: East Asia Market Value Share (%) and BPS Analysis by Technique, 2024 to 2034
Figure 198: East Asia Market Y-o-Y Growth (%) Projections by Technique, 2024 to 2034
Figure 199: East Asia Market Value (US$ Million) Analysis by End User, 2019 to 2034
Figure 200: East Asia Market Value Share (%) and BPS Analysis by End User, 2024 to 2034
Figure 201: East Asia Market Y-o-Y Growth (%) Projections by End User, 2024 to 2034
Figure 202: East Asia Market Value (US$ Million) Analysis by Application, 2019 to 2034
Figure 203: East Asia Market Value Share (%) and BPS Analysis by Application, 2024 to 2034
Figure 204: East Asia Market Y-o-Y Growth (%) Projections by Application, 2024 to 2034
Figure 205: East Asia Market Attractiveness by Cell Type, 2024 to 2034
Figure 206: East Asia Market Attractiveness by Product, 2024 to 2034
Figure 207: East Asia Market Attractiveness by Technique, 2024 to 2034
Figure 208: East Asia Market Attractiveness by End User, 2024 to 2034
Figure 209: East Asia Market Attractiveness by Application, 2024 to 2034
Figure 210: East Asia Market Attractiveness by Country, 2024 to 2034
Figure 211: Middle East and Africa Market Value (US$ Million) by Cell Type, 2024 to 2034
Figure 212: Middle East and Africa Market Value (US$ Million) by Product, 2024 to 2034
Figure 213: Middle East and Africa Market Value (US$ Million) by Technique, 2024 to 2034
Figure 214: Middle East and Africa Market Value (US$ Million) by End User, 2024 to 2034
Figure 215: Middle East and Africa Market Value (US$ Million) by Application, 2024 to 2034
Figure 216: Middle East and Africa Market Value (US$ Million) by Country, 2024 to 2034
Figure 217: Middle East and Africa Market Value (US$ Million) Analysis by Country, 2019 to 2034
Figure 218: Middle East and Africa Market Value Share (%) and BPS Analysis by Country, 2024 to 2034
Figure 219: Middle East and Africa Market Y-o-Y Growth (%) Projections by Country, 2024 to 2034
Figure 220: Middle East and Africa Market Value (US$ Million) Analysis by Cell Type, 2019 to 2034
Figure 221: Middle East and Africa Market Value Share (%) and BPS Analysis by Cell Type, 2024 to 2034
Figure 222: Middle East and Africa Market Y-o-Y Growth (%) Projections by Cell Type, 2024 to 2034
Figure 223: Middle East and Africa Market Value (US$ Million) Analysis by Product, 2019 to 2034
Figure 224: Middle East and Africa Market Value Share (%) and BPS Analysis by Product, 2024 to 2034
Figure 225: Middle East and Africa Market Y-o-Y Growth (%) Projections by Product, 2024 to 2034
Figure 226: Middle East and Africa Market Value (US$ Million) Analysis by Technique, 2019 to 2034
Figure 227: Middle East and Africa Market Value Share (%) and BPS Analysis by Technique, 2024 to 2034
Figure 228: Middle East and Africa Market Y-o-Y Growth (%) Projections by Technique, 2024 to 2034
Figure 229: Middle East and Africa Market Value (US$ Million) Analysis by End User, 2019 to 2034
Figure 230: Middle East and Africa Market Value Share (%) and BPS Analysis by End User, 2024 to 2034
Figure 231: Middle East and Africa Market Y-o-Y Growth (%) Projections by End User, 2024 to 2034
Figure 232: Middle East and Africa Market Value (US$ Million) Analysis by Application, 2019 to 2034
Figure 233: Middle East and Africa Market Value Share (%) and BPS Analysis by Application, 2024 to 2034
Figure 234: Middle East and Africa Market Y-o-Y Growth (%) Projections by Application, 2024 to 2034
Figure 235: Middle East and Africa Market Attractiveness by Cell Type, 2024 to 2034
Figure 236: Middle East and Africa Market Attractiveness by Product, 2024 to 2034
Figure 237: Middle East and Africa Market Attractiveness by Technique, 2024 to 2034
Figure 238: Middle East and Africa Market Attractiveness by End User, 2024 to 2034
Figure 239: Middle East and Africa Market Attractiveness by Application, 2024 to 2034
Figure 240: Middle East and Africa Market Attractiveness by Country, 2024 to 2034
By 2024, the cell isolation landscape is anticipated to be valued at USD 5.1 billion.
The cell isolation market is projected to flourish at a CAGR of 14.1% from 2024 to 2034.
By 2034, the cell isolation market will generate USD 19.1 billion in value terms.
The human cells segment is anticipated to expand at 13.9% CAGR by 2034.
With a CAGR of 13.6%, consumables are expected to dominate the market for cell isolation.
Explore Similar Insights
Thank you!
You will receive an email from our Business Development Manager. Please be sure to check your SPAM/JUNK folder too.