

- Market Size (2026)
- USD 956.5 Mn
- Forecast (2036)
- USD 4797.8 Mn
- CAGR (2026 to 2036)
- 17.5%
How big is the Cellgorithm Platform Cell Therapy Market in 2026?
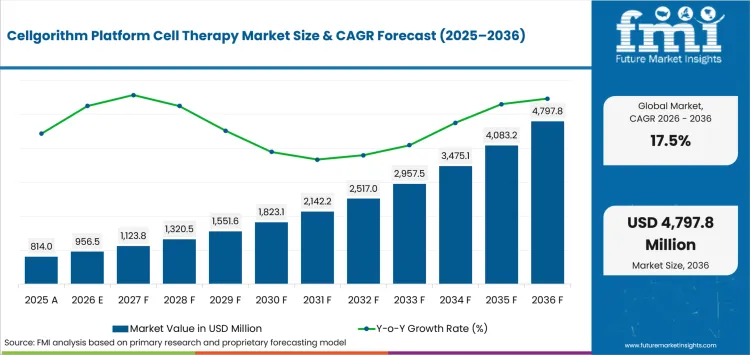
USD 956.5 million in 2026 and USD 4,797.8 million by 2036 at a 17.5% CAGR.
Cellgorithm platform cell therapy demand is projected to expand at 17.5% CAGR, driven by the need to shorten cell differentiation without losing control of identity and function. Revenue is forecast to rise from USD 956.5 million in 2026 to USD 4,797.8 million by 2036, supported by collaboration income and enabling manufacturing services. For instance, Syntax Bio describes Cellgorithm as a CRISPR-based system that programs gene activation in sequence and reduces repeated media steps. The method places stem cell therapies within a programmable workflow that connects early discovery with later process transfer.
US programs operate within a broad FDA pathway for cell and gene therapies, whereas UK programs can draw on a denser network of licensed advanced-therapy facilities. Germany places more weight on national coordination and regulated transfer, whereas South Korea offers public stem-cell banks and a national GMP facility. Breakthrough T1D announced a USD 856,250 award in December 2025 for a Cellgorithm pancreatic cell replacement project. The operational test is whether timed gene activation can be converted into repeatable cell identity assays and batch records. Providers in cell therapy manufacturing therefore need to connect cell programming with closed processing and release testing. Revenue depends on that handoff since research speed alone does not create a clinically usable product.
| Metric | Value |
|---|---|
| 2025 Market Size | USD 814.0 million |
| 2026 Market Size | USD 956.5 million |
| 2036 Market Size | USD 4,797.8 million |
| Forecast CAGR (2026-2036) | 17.5% |
| Therapy Type Focus | Autologous Cell Therapy |
| Autologous Cell Therapy Share (2026) | 39.0% |
| Application Focus | Oncology |
| Oncology Share (2026) | 37.3% |
| End User Focus | Hospitals |
| Hospitals Share (2026) | 31.7% |
Summary of the Cellgorithm Platform Cell Therapy Market
| Market Signal | Commercial Impact |
| Demand and Growth Drivers | Cell programming creates commercial value when a shorter differentiation cycle produces records that remain usable during process transfer and quality review.
|
| Product and Segment View | The segment mix reflects where programmable differentiation meets established treatment routes and regulated clinical handling.
|
| Geography and Growth Outlook | Country performance differs according to regulatory pathways and access to cell processing infrastructure in each national market.
|
| Competitive Structure | Syntax Bio is one of the key players in the sector whereas the other companies supply tools or services that support cell therapy development and regulated manufacturing transfer.
|
| Analyst Perspective | Commercial value depends on proving that faster cell programming remains reproducible after the method moves into regulated manufacturing and formal quality review.
|
How is the Cellgorithm platform cell therapy market segmented?
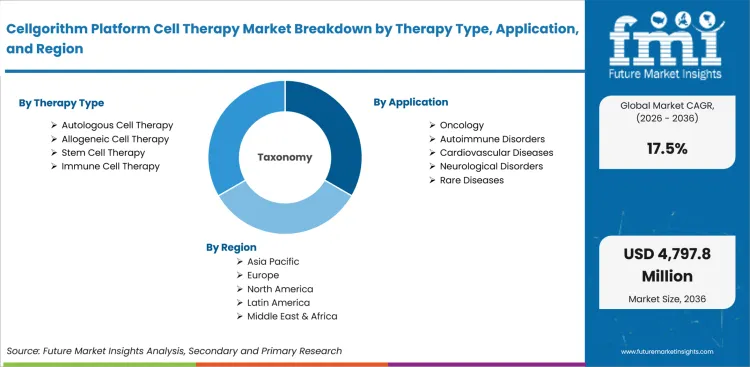
The market is segmented by therapy type, application, end user, cell source, and region.
Therapy type separates patient-derived products from donor-derived programs and stem-cell programs that use reusable starting material. Application analysis follows the diseases that determine target cell function and the clinical evidence required for use. End-user categories identify the organizations that administer treatment or develop the manufacturing process under regulated controls. Cell-source analysis distinguishes marrow and blood routes from cord cells and induced pluripotent stem cells used in repeatable differentiation programs.
Cellgorithm changes the differentiation stage, but every category still depends on collection quality and downstream release evidence. Regional analysis shows how regulation and manufacturing capacity affect adoption across countries with different transfer pathways. The final segmentation connects programmable differentiation with wider cell and gene therapy manufacturing routes that carry a research method into regulated production.
What supports demand for Autologous Cell Therapy within the Therapy Type category?
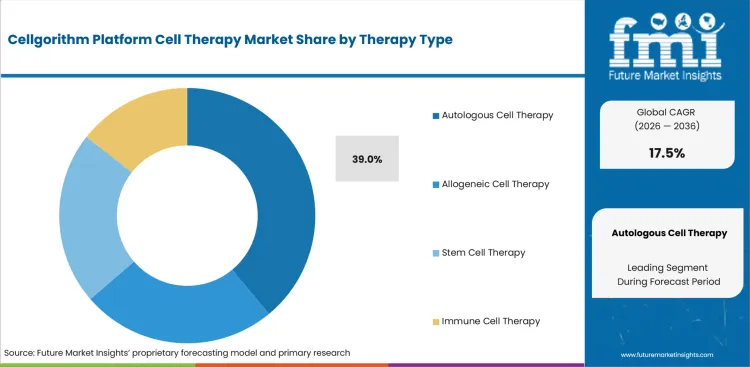
Autologous therapies keep one patient connected to one manufacturing record from collection through infusion and follow-up care. The FDA reported in December 2025 that Waskyra uses a patient’s own genetically corrected hematopoietic stem cells and was assessed across 27 patients. The Waskyra approval shows why identity and traceability remain central even when a platform shortens differentiation. Related CAR T-cell therapies reinforce the need for closed handling and clear chain-of-identity records during individualized production.
- Based on therapy type, autologous cell therapy is projected to account for 39.0% share in 2026, supported by patient-specific manufacturing routes through 2036. Each batch follows one patient and therefore places greater value on traceability and controlled handoffs between collection sites and manufacturing facilities. Program planners must test chain-of-identity controls at every transfer point before wider routine clinical use.
- Hospital cell-processing teams favor autologous programs when the therapy uses established collection and reinfusion pathways. Cellgorithm can shorten the differentiation stage, but the production record still has to preserve patient identity and explain cell function before release. Collection schedules and individualized testing keep this route closely tied to hospital capacity and manufacturing coordination.
How does Oncology shape demand within the Application category?
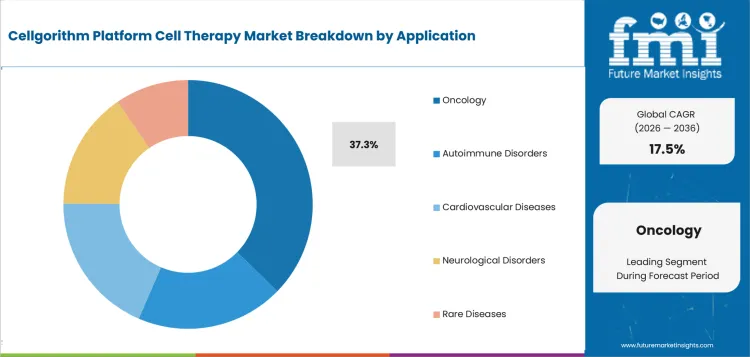
Oncology provides a commercial route for cell products that can show defined anti-tumor activity within regulated clinical programs. The FDA reported in February 2024 that Amtagvi produced a 31.5% objective response rate among 73 patients treated at the recommended dose. The result shows why therapy developers need cell identity and function evidence that connects manufacturing with clinical outcomes. Engineered cell therapy programs extend that need to edited or programmed cells with tighter release criteria.
- By application, oncology is estimated to hold 37.3% share in 2026, attributable to established immune-cell treatment programs during the forecast period. Cancer programs provide clear targets for function testing and already use regulated manufacturing routes that can absorb improved cell programming methods. Program teams can compare functional performance against defined clinical endpoints during early partner selection and later manufacturing review.
- Cancer centers purchase cell therapies through programs that combine clinical selection with specialist manufacturing coordination. A programmable differentiation platform gains value when it improves the consistency of the intended cell population without weakening potency testing or post-treatment monitoring. Clear functional assays then connect faster cell generation with the clinical outcome that supports continued investment.
How do hospitals evaluate cell therapy platforms within the End User category?
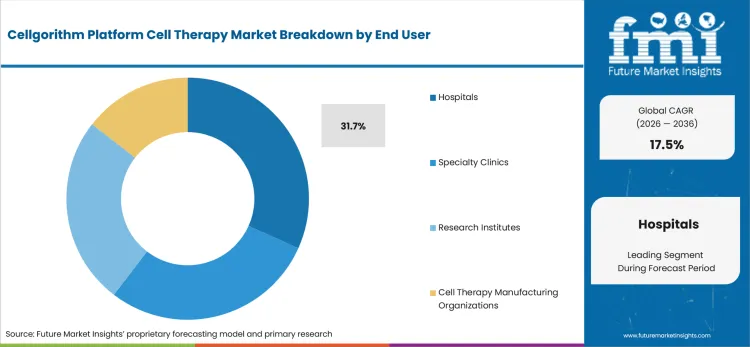
Hospitals carry the final clinical responsibility for infusion and adverse-event management during treatment and long-term follow-up. The FDA listed six approved BCMA-directed or CD19-directed autologous CAR T-cell products in April 2024 and required lifelong monitoring for secondary malignancies. The requirement explains why hospital adoption depends on treatment protocols and follow-up capacity beyond the manufacturing site. Related cell therapy systems must therefore preserve product identity and communicate release information clearly to clinical teams.
- In 2026, hospitals are expected to represent 31.7% share, owing to infusion and monitoring duties over the forecast period. Their role extends beyond administration into conditioning and adverse-event management, with records that connect each dose to its manufacturing history. Scheduling pressure makes reliable delivery records part of the platform qualification decision for hospital treatment teams.
- Hospital pharmacy and transplant teams compare platform-supported products through scheduling needs and monitoring burden across the complete treatment pathway. Faster cell generation improves the operating case when the final product arrives with documentation that supports safe handling and clear escalation routes. Hospitals therefore assess manufacturing records alongside infusion capacity and post-treatment monitoring resources during platform selection.
What makes Bone Marrow Cells central to the Cell Source category?
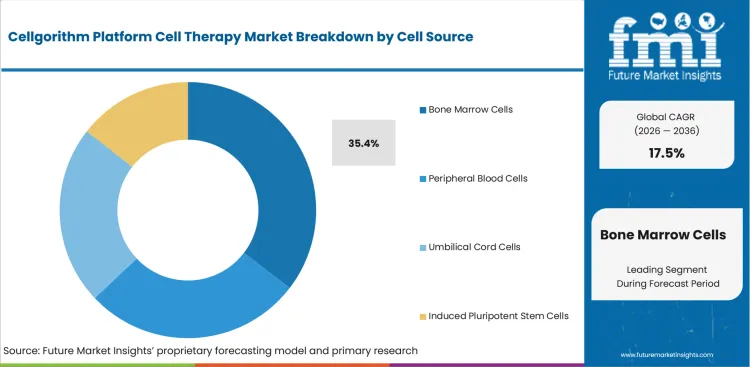
Bone marrow remains a familiar source for hematopoietic and mesenchymal cell programs that rely on established collection practice. Health Resources and Services Administration data updated in November 2025 showed that bone marrow accounted for 23% of related-donor hematopoietic transplants performed during 2024. The reported share confirms an active clinical route for marrow-derived starting material and later processing. Hematopoietic stem cell transplantation experience gives developers a practical reference for collection quality and later cell handling.
- By cell source, bone marrow cells are forecast to represent 35.4% share in 2026, reinforced by transplant experience by 2036. Established collection routes and clinical familiarity make marrow a practical starting material for programs that need documented cell recovery and regulated downstream processing. The source still requires qualification that reflects donor variation and the collection practices used at each site.
- Transplant centers choose marrow when the target cell population and collection route fit the treatment design. Cellgorithm has to improve differentiation without weakening source qualification since starting-material variability can affect expansion and the final functional profile. Development teams therefore need source criteria that remain useful after the process moves into controlled manufacturing.
What are the drivers, restraints, and opportunities in the Cellgorithm platform cell therapy market?
Programmable gene activation supports faster protocol design; phase-appropriate CMC evidence limits transfer; media and cell-engineering partnerships create commercial openings.
- Driver: Timed gene activation reduces repeated manual steps and gives therapy teams a clearer route for testing differentiation sequences.
- Restraint: Faster differentiation does not remove the need to prove cell identity and manufacturing control during regulated development.
- Opportunity: Partnerships can combine Cellgorithm with qualified media and engineered iPSC starting cells for disease-specific programs.
Programmable control is a factor supporting growth as it turns a long sequence of manual differentiation steps into a defined genetic program. Clarke and colleagues published the underlying multistep activation system in Science Advances during December 2025. The research showed sequential endogenous gene activation in human cells and provided the technical basis for Cellgorithm. Therapy developers can use the method to test lineage decisions more directly during early process design. Related bioreactor analytics platforms become relevant when teams move from gene timing into process monitoring and release evidence.
Manufacturing evidence limits growth because faster research methods still need phase-appropriate controls for clinical use. The FDA stated in June 2026 that first-in-human Phase 1 submissions can reduce application development time by up to 12 months under clarified CMC flexibilities. The agency still requires minimum information that protects product quality during first-in-human clinical development work. Cellgorithm projects therefore need identity and potency measures that explain what the programmed cells became. Adoption slows when a partner cannot translate gene timing into a repeatable release strategy for clinical batches.
Partnership design creates an emerging opportunity by pairing cell programming with media or engineered starting cells used in development. Ajinomoto Health & Nutrition North America announced in June 2026 that it would provide StemFit media for compatibility and workflow testing on Cellgorithm. Syntax Bio evaluates media performance and produces supporting data for its expanding cell therapy collaboration pipeline. The collaboration gives therapy programs a clearer route from differentiation research toward later manufacturing decisions. Commercial value depends on whether the combined workflow reduces process variation without creating a closed supplier dependency.
Which country CAGRs are profiled in the Cellgorithm platform cell therapy market?
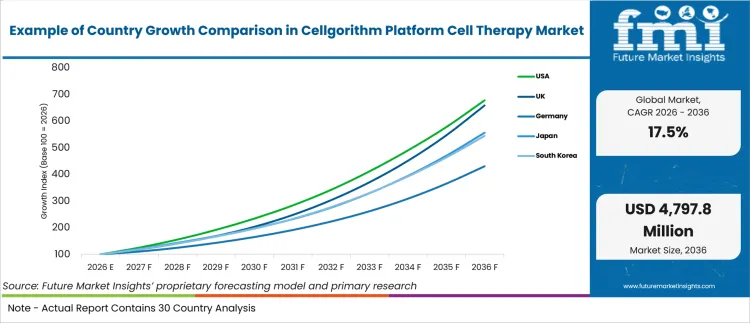
| Country | CAGR |
|---|---|
| USA | 21.1% |
| UK | 20.7% |
| Germany | 15.7% |
| Japan | 18.7% |
| South Korea | 18.5% |
How do country-level CAGRs compare in the Cellgorithm platform cell therapy market?
The comparison spans 5.4 percentage points and separates two compact clusters from Germany’s distinct position. The USA and UK remain closely aligned owing to deeper regulatory experience and broader manufacturing networks. Japan and South Korea form another compressed pair supported by iPSC capability and public stem-cell infrastructure. Germany’s pronounced step-down reflects slower regulated transfer rather than limited biomedical research or technical capacity.
- The USA converts extensive FDA review experience into quicker platform partnerships and phase-appropriate manufacturing decisions.
- UK adoption benefits from licensed advanced-therapy facilities that connect research programs with documented GMP production.
- Japan follows a product-oriented route built around iPSC approvals and defined post-approval evidence requirements.
- South Korea uses public cell banks and national GMP resources to lower early development barriers.
- Germany depends on coordinated research funding and formal technology transfer before programmable differentiation reaches clinical production.
Comparable CAGRs still create different entry conditions because identity assays and release evidence follow national requirements. Platform providers must align deployment timing with local manufacturing readiness and regulatory documentation expectations. The full report provides country-level CAGR analysis across North America, Latin America, Europe, East Asia, South Asia, Oceania and the Middle East and Africa.
- US therapy programs draw on an established FDA review pathway and a broad network of cell-processing organizations. By 2036, the USA is projected to grow at 21.1% CAGR, driven by regulatory experience and active cell therapy development. The FDA reported in January 2026 that its Center for Biologics Evaluation and Research had approved close to 50 cell and gene therapies over the prior decade. FDA approval experience gives domestic sponsors more reference points for phase-appropriate manufacturing discussions and release planning. Syntax Bio is based in Chicago and can work directly with domestic therapy developers during early collaboration design. Investment decisions should test whether Cellgorithm shortens protocol work without adding uncertainty to identity assays or later technology transfer.
- UK cell therapy programs benefit from a concentrated network of licensed advanced-therapy facilities and clinical development groups. The UK outlook is anticipated to advance at 20.7% CAGR over the forecast period, supported by manufacturing infrastructure and an established medicines regulator. The Cell and Gene Therapy Catapult reported in November 2024 that the country had 32 MHRA-licensed GMP facilities and six commercially licensed products produced domestically. The licensed operating base gives platform companies several routes for pilot transfer and qualified manufacturing partner selection. Local developers should compare the programming method with the cleanroom and quality systems already available before committing to a production design.
- Germany combines strong biomedical research with a national effort to improve technology transfer and GMP capacity. Adoption of the Cellgorithm platform in Germany is estimated to expand at 15.7% CAGR through 2036, attributable to coordinated research and regulated manufacturing work. The Berlin Institute of Health reported in June 2024 that more than 150 experts prepared a strategy across eight action areas with EUR 48 million in funding through 2026. The national program gives therapy developers a structured route for discussing standards and transfer barriers with research institutions and manufacturers. German institutions favor partners that document comparability from research batches into later clinical production and formal release testing.
- Japan has moved iPSC-derived regenerative products from research programs into conditional commercial use under national approval pathways. Cellgorithm platform demand in Japan is forecast to rise at 18.7% CAGR during the forecast period, aided by national iPSC experience and defined post-approval evidence routes. The Japan Agency for Medical Research and Development reported in March 2026 that two iPSC-based products received approval on March 6 for ischemic cardiomyopathy and Parkinson’s disease. FUJIFILM Cellular Dynamics and Takara Bio provide local or regional iPSC capabilities for cell sourcing and process development. Platform selection should focus on disease-specific function and evidence that the programmed cells retain the intended phenotype after scale-up.
- South Korea offers public stem-cell resources that can lower the starting barrier for domestic regenerative medicine programs. The South Korean sector is projected to record 18.5% CAGR by 2036, underpinned by national cell banking and GMP support. The Korea National Institute of Health reported in March 2026 that its stem-cell bank held 128 pluripotent lines and made 45 available for distribution. The collection gives local researchers a defined source for early testing and comparison across pluripotent cell programs. Miltenyi Biotec and other processing providers can support transfer into controlled workflows that generate traceable production records. Commercial adoption depends on moving public research methods into sponsor-owned quality systems that support repeatable release and long-term supply.
Who are the notable companies in the Cellgorithm platform cell therapy market?
Lonza, Thermo Fisher Scientific, Cytiva, Catalent, a Novo Holdings company, Bio-Techne, Miltenyi Biotec, FUJIFILM Cellular Dynamics, Takara Bio, Sartorius, and Rose BioSolutions support related manufacturing tools or services.
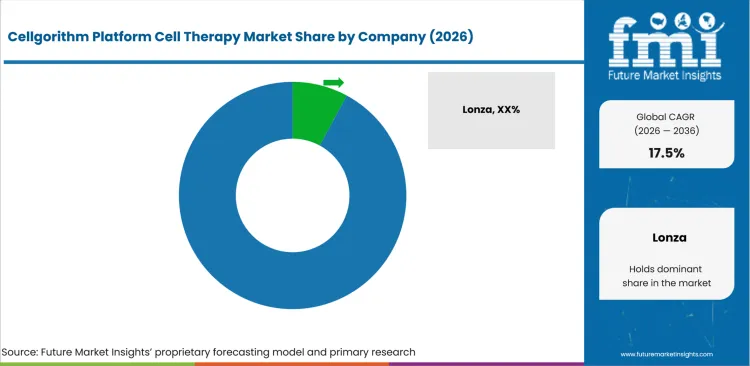
Syntax Bio controls the programmable differentiation technology and defines the platform scope through its collaboration model. Lonza and Miltenyi Biotec compete through closed cell-processing equipment, whereas Thermo Fisher Scientific and Bio-Techne supply materials used during expansion and transfer. FUJIFILM Cellular Dynamics and Takara Bio provide stem-cell development capabilities for programs that need reusable iPSC starting material.
Catalent remains active as a Novo Holdings company, and Rose BioSolutions offers external manufacturing support for sponsors with limited internal capacity. Partner selection therefore depends on how each organization connects its capability with programmable cell design and quality control. The wider automated cell processing systems category shows why closed handling and data capture can influence partner selection after the differentiation method is chosen.
- Syntax Bio works with organizations that can test Cellgorithm against specific starting cells and process materials.Lonza and Miltenyi Biotec provide closed cell-processing systems that fit patient-specific production and preserve traceable records through each batch. Cytiva and Sartorius supply automated platforms that support parallel batches and controlled expansion after programmed differentiation enters manufacturing. Their commercial position depends on product-specific validation with the selected cell source and intended manufacturing route.
- Thermo Fisher Scientific and Bio-Techne supply media or ancillary materials that support clinical manufacturing and later process transfer. Their value depends on compatibility data that shows each material performs consistently with the Cellgorithm sequence and later release tests. Qualified supply records and formal change-control procedures therefore become part of every detailed partner review.
- FUJIFILM Cellular Dynamics and Takara Bio support iPSC development or manufacturing services for programs that need reusable starting cells. Catalent and Rose BioSolutions compete in biologics contract manufacturing for programs that need external process transfer and regulated capacity. Sponsor selection depends on source control and documented manufacturing comparability across development and production sites.
Competitive Benchmarking: Cellgorithm Platform Cell Therapy Market
| Company | Programmable Cell Design | Closed Cell Processing | GMP Transfer Support | Geographic Reach |
|---|---|---|---|---|
| Syntax Bio | High | Low | Low | North America |
| Lonza | Low | High | High | Global |
| Thermo Fisher Scientific | Low | High | High | Global |
| Cytiva | Low | High | High | Global |
| Catalent, a Novo Holdings company | Low | Medium | High | Global |
| Bio-Techne | Low | Low | Medium | Global |
| Miltenyi Biotec | Low | High | High | Global |
| FUJIFILM Cellular Dynamics | High | Medium | High | North America and Asia |
| Takara Bio | Medium | Medium | High | Asia and North America |
| Sartorius | Low | High | High | Global |
| Rose BioSolutions | Low | Medium | High | North America and Europe |
Scoring basis: High indicates a documented core capability in the named function, whereas Medium indicates direct support through an adjacent cell-therapy product or service. Low indicates limited public evidence that the company supports the exact function within Cellgorithm-related development or manufacturing.
Source basis: Official company pages and dated corporate announcements support every capability comparison shown in the table. The ratings describe capability coverage and do not represent audited market share or ownership of the Cellgorithm platform.
Key Developments in the Cellgorithm Platform Cell Therapy Market
- July 2026, Applied StemCell and Syntax Bio: Applied StemCell announced a collaboration that evaluates engineered iPSC and hypoimmunogenic cell platforms with Cellgorithm. The companies plan to combine genome engineering with programmable differentiation for research and future manufacturing workflows. The development broadens the starting-cell options available for Cellgorithm projects and creates a direct test of whether the platform can operate with engineered iPSC materials.
- May 2026, FUJIFILM Cellular Dynamics: FUJIFILM opened a 175,000-square-foot iPSC development and manufacturing facility in Madison. The company stated that the site is designed to increase capacity for iPSC products and services by four times. The facility gives therapy programs access to a larger source-development base and strengthens FUJIFILM’s ability to support transfer from iPSC research into future cell therapy manufacturing.
- March 2026, Sartorius: Sartorius launched the Eveo platform to support parallel autologous cell therapy production within a smaller cleanroom footprint. The company stated that one operator can process eight patient batches within the cleanroom space previously used for two batches. The design addresses labor and footprint limits that become important after a programmable cell method moves from research into patient-specific production.
- December 2025, Lonza: Lonza received an FDA Advanced Manufacturing Technologies designation for its Cocoon closed automated cell therapy platform. The designation supports earlier communication with the agency about manufacturing technology and its use in development programs. For Cellgorithm partners, Cocoon represents one possible route for carrying programmed cells into a controlled patient-specific workflow with clearer process records. The platform fit still needs product-specific validation before a sponsor relies on that manufacturing route.
Key Players in the Cellgorithm Platform Cell Therapy Market
Platform Owner
- Syntax Bio
Manufacturing Platforms and Process Tools
- Lonza
- Thermo Fisher Scientific
- Cytiva
- Miltenyi Biotec
- Sartorius
Stem-Cell Materials and Development
- Bio-Techne
- FUJIFILM Cellular Dynamics
- Takara Bio
Contract Development and Manufacturing
- Catalent, a Novo Holdings company
- Rose BioSolutions
Cellgorithm Platform Cell Therapy Market - Report Scope
| Coverage field | Report scope |
|---|---|
| Market breakdown | Therapy Type, Application, End User, Cell Source, and Region. |
| Quantitative Units | Revenue in USD Million, CAGR in %. |
| Market Definition | The category covers Cellgorithm programming and enabling technologies used to design, transfer, or manufacture cell therapies through controlled cell differentiation. |
| Regions Covered | North America, Latin America, Europe, East Asia, South Asia, Oceania, and Middle East and Africa. |
| Countries Covered | USA, UK, Germany, Japan, and South Korea, with 5+ countries within the regional model. |
| Key Companies Profiled | Syntax Bio, Lonza, Thermo Fisher Scientific, Cytiva, Catalent, a Novo Holdings company, Bio-Techne, Miltenyi Biotec, FUJIFILM Cellular Dynamics, Takara Bio, Sartorius, and Rose BioSolutions |
| Forecast Period | 2026 to 2036. |
| Approach | Hybrid bottom-up and top-down market sizing supported by primary interviews and official desk research. |
Cellgorithm Platform Cell Therapy Market - Research Methodology
| Method | Approach |
|---|---|
| Primary Research | FMI analysts gathered input from manufacturers, service providers, technology developers, distributors, end users, procurement teams, and subject-matter experts. Interviews examined purchasing decisions, product or service evaluation, adoption barriers, approval requirements, pricing considerations, and expectations for technical or commercial support. Respondents were also asked what evidence is required before a trial, pilot, or initial order develops into regular purchasing. |
| Desk Research | Desk research covered government statistics, regulatory publications, trade data, industry associations, technical literature, standards, company filings, product information, and official corporate announcements. Sources were reviewed for relevance, publication date, geographic coverage, and consistency with the defined market scope. Claims relating to performance, applications, approvals, capacity, investment, and commercial activity were retained only when supported by credible public evidence. |
| Market Sizing and Forecasting | The market model combined the baseline value with historical performance, segment structure, pricing and volume indicators, adoption levels, company participation, and country-level demand conditions. Forecast assumptions considered economic activity, investment trends, regulatory developments, technology adoption, purchasing cycles, supply availability, and barriers to wider market use. Segment and regional estimates were reconciled before the final market total was calculated. |
| Data Validation | Estimates were checked against multiple independent indicators, including public data, company activity, trade patterns, industry developments, and findings from primary interviews. Validation also tested whether products, services, applications, and company revenues fell within the defined market boundaries. Adjacent categories, unsupported claims, overlapping revenues, and activities without direct market relevance were excluded to reduce double counting and maintain consistency across segments and countries. |
Cellgorithm Platform Cell Therapy Market by Segments
Cellgorithm Platform Cell Therapy Market segmented by Therapy Type:
- Autologous Cell Therapy
- Allogeneic Cell Therapy
- Stem Cell Therapy
- Immune Cell Therapy
Cellgorithm Platform Cell Therapy Market segmented by Application:
- Oncology
- Autoimmune Disorders
- Cardiovascular Diseases
- Neurological Disorders
- Rare Diseases
Cellgorithm Platform Cell Therapy Market segmented by End User:
- Hospitals
- Specialty Clinics
- Research Institutes
- Cell Therapy Manufacturing Organizations
Cellgorithm Platform Cell Therapy Market segmented by Cell Source:
- Bone Marrow Cells
- Peripheral Blood Cells
- Umbilical Cord Cells
- Induced Pluripotent Stem Cells
Cellgorithm Platform Cell Therapy Market by Region:
- North America
- USA
- Canada
- Latin America
- Brazil
- Mexico
- Argentina
- Europe
- UK
- Germany
- France
- Italy
- Spain
- Benelux
- Nordics
- East Asia
- Japan
- South Korea
- China
- South Asia
- India
- ASEAN
- Oceania
- Australia
- New Zealand
- Middle East and Africa
- GCC Countries
- South Africa
- Israel
Research Sources and Bibliography
- Applied StemCell. (July 2026). Applied StemCell and Syntax Bio collaborate to advance next-generation regenerative medicine.
- Ajinomoto Health & Nutrition North America, Inc.. (June 2026). Syntax Bio, Ajinomoto Health & Nutrition North America, Inc. Collaborate to Evaluate Stem Cell Culture Technologies Using Cellgorithm Platform.
- Berlin Institute of Health at Charité. (June 2024). New perspectives for patients: National Strategy for Gene and Cell Therapies presented to the BMBF.
- Breakthrough T1D. (December 2025). Syntax Bio receives award from Breakthrough T1D to advance pancreatic beta cell therapy for type 1 diabetes.
- Health Resources and Services Administration. (November 2025). Transplant activity report.
- Cell and Gene Therapy Catapult. (November 2024). Cell and gene therapy industry continues to expand manufacturing infrastructure in the UK.
- Clarke et al. (December 2025). Programmable multistep CRISPR gene activation via control of RNA polymerase III termination.
- FUJIFILM Cellular Dynamics. (May 2026). FUJIFILM Cellular Dynamics launches new iPSC manufacturing facility in Madison.
- Japan Agency for Medical Research and Development. (March 2026). Japan’s R&D and Application Practices toward the Realization of induced Pluripotent Stem Cell (iPS Cell) Therapy.
- Korea National Institute of Health. (March 2026). National Stem Cell Bank.
- Lonza. (December 2025). Lonza’s Cocoon Platform Receives Advanced Manufacturing Technologies (AMT) Designation from the USA FDA.
- Sartorius. (March 2026). Sartorius launches next-generation platform to boost efficiency in cell therapy production.
- Syntax Bio. (July 2026). Syntax Bio | Synthetic biology company programming stem cells.
- USA Food and Drug Administration. (February 2024). FDA approves first cellular therapy to treat patients with unresectable or metastatic melanoma.
- USA Food and Drug Administration. (April 2024). FDA requires boxed warning for T cell malignancies following selected autologous CAR T-cell immunotherapies.
- USA Food and Drug Administration. (December 2025). FDA approves first gene therapy treatment for Wiskott-Aldrich syndrome.
- USA Food and Drug Administration. (January 2026). FDA increases flexibility on requirements for cell and gene therapies to advance innovation.
- USA Food and Drug Administration. (June 2026). Phase 1 IND chemistry, manufacturing, and controls flexibilities.
- Bio-Techne. (Accessed July 2026). GMP Cytokine and Growth Factor Manufacturing Facility for Cell Therapy.
- Catalent. (Accessed July 2026). Cell therapy CGMP manufacturing.
- Rose BioSolutions. (Accessed July 2026). Cell therapy manufacturing services.
- Cytiva. (May 2024). Cytiva unveils new cell therapy manufacturing platform.
- Miltenyi Biotec. (Accessed July 2026). Automated cell manufacturing | CliniMACS Prodigy Platform | Miltenyi Biotec | USA.
- Novo Holdings. (December 2024). Novo Holdings completes acquisition of Catalent.
- Takara Bio. (Accessed July 2026). Contract development and manufacturing services.
- Thermo Fisher Scientific. (Accessed July 2026). Cell and gene therapy manufacturing process and solutions.
This bibliography is provided for reader reference and is not exhaustive. The full report contains the complete reference list and detailed citations.
This Report Answers
- How large is the Cellgorithm platform cell therapy market in 2026 and 2036?
- Which therapy type accounts for the specified share in 2026?
- Why does oncology account for the specified application share?
- How do hospitals influence platform qualification and clinical use?
- Which cell sources create the clearest routes for programmable differentiation?
- How do the five profiled country CAGRs compare?
- Which companies own the platform and which provide enabling capabilities?
- What manufacturing evidence limits transfer from research into clinical production?
- Which recent company developments change the commercial position of the market?
- What should therapy developers assess before signing a Cellgorithm collaboration?
Frequently Asked Questions
What is driving growth in the Cellgorithm Platform Cell Therapy Market?
Programmable differentiation shortens protocol work by replacing repeated manual steps with timed gene activation across defined cell programs. Manufacturing partnerships extend revenue after research methods move into controlled production and formal quality review.
Who are the key players in the Cellgorithm Platform Cell Therapy Market?
Syntax Bio owns Cellgorithm and defines the programmable differentiation platform through its collaboration and licensing model. The other profiled companies provide cell-processing equipment and materials or regulated manufacturing services for therapy programs.
What is a notable restraint in the Cellgorithm Platform Cell Therapy Market?
Faster differentiation still needs clear identity and potency evidence before a programmed cell product enters regulated clinical manufacturing. Weak release methods can delay technology transfer and reduce the value created by a shorter research cycle.
Why should executives track the Cellgorithm Platform Cell Therapy Market?
The platform connects cell design decisions with manufacturing investment and later quality-control obligations across partnered therapy programs. Collaboration terms determine who owns performance data and who carries transfer risk during clinical development.
What business problem does the Cellgorithm Platform Cell Therapy Market address?
Cellgorithm replaces repeated manual differentiation steps with timed gene activation that controls a planned sequence of cell-state changes. The method addresses long development cycles and variable output that can weaken comparisons across research batches.
What should therapy development teams evaluate in the Cellgorithm Platform Cell Therapy Market?
Therapy development teams should compare cell identity and functional performance across representative batches from the intended starting source. They should test compatibility with closed processing systems and later release controls before selecting a manufacturing partner.
What limits return on investment in the Cellgorithm Platform Cell Therapy Market?
Returns weaken when faster research methods cannot survive technology transfer into a controlled manufacturing process. Added assays and process redesign can offset savings created by a shorter differentiation cycle during development.
What supports long-term commercial confidence in the Cellgorithm Platform Cell Therapy Market?
Commercial confidence improves when platform data remain consistent across cell sources and qualified manufacturing sites. Clear partner roles support later regulatory decisions and reduce supply risk during process transfer work.
Preview the report firsthand - request a free sample
Get SampleGet the brochure for pricing and purchase details.
Get PDFTable of Content
- Key Takeaways
- Market Size and CAGR
- Top Growth Driver
- Fastest Growing Segment
- Leading Region
- Key Companies
- Emerging Opportunities
- Executive Summary
- Global Market Outlook
- Demand-side Trends
- Supply-side Trends
- Technology Roadmap Analysis
- Analysis and Recommendations
- Analyst Perspective (What is happening? Why now? What should investors know?)
- Key Questions Answered
- How large is the market?
- What is the CAGR?
- What are key trends?
- Which region dominates?
- Who are the leaders?
- Market Overview
- Market Coverage / Taxonomy
- Market Definition / Scope / Limitations
- Research Methodology
- Chapter Orientation
- Analytical Lens and Working Hypotheses
- Market Structure, Signals, and Trend Drivers
- Benchmarking and Cross-market Comparability
- Market Sizing, Forecasting, and Opportunity Mapping
- Research Design and Evidence Framework
- Desk Research Programme (Secondary Evidence)
- Expert Input and Fieldwork (Primary Evidence)
- Tooling, Models, and Reference Databases
- Data Engineering and Model Build
- Quality Assurance and Audit Trail
- Market Background
- Market Dynamics (Drivers, Restraints, Opportunity, Trends)
- Scenario Forecast (Optimistic, Likely, Conservative)
- Impact Analysis
- AI Impact
- Sustainability Impact
- Regulatory Impact
- Technology Impact
- Consumer / Buyer Analysis
- Purchase Drivers
- Adoption Barriers
- Buyer Journey
- Opportunity Map Analysis
- Product Life Cycle Analysis
- Supply Chain Analysis
- Investment Feasibility Matrix
- Value Chain Analysis
- PESTLE and Porter's Analysis
- Regulatory Landscape
- Regional Parent Market Outlook
- Production and Consumption Statistics
- Import and Export Statistics
- Global Market Analysis and Forecast, 2021 to 2036
- Historical Market Size Value (USD Million) Analysis, 2021 to 2025
- Current and Future Market Size Value (USD Million) Projections, 2026 to 2036
- Y-o-Y Growth Trend Analysis
- Absolute $ Opportunity Analysis
- Global Market Pricing Analysis, 2021 to 2036
- Global Market Analysis and Forecast, By Therapy Type, 2021 to 2036
- Introduction / Key Findings
- Historical Market Size Value (USD Million) Analysis By Therapy Type, 2021 to 2025
- Current and Future Market Size Value (USD Million) Analysis and Forecast By Therapy Type, 2026 to 2036
- Autologous Cell Therapy
- Allogeneic Cell Therapy
- Stem Cell Therapy
- Immune Cell Therapy
- Autologous Cell Therapy
- Y-o-Y Growth Trend Analysis By Therapy Type, 2021 to 2025
- Absolute $ Opportunity Analysis By Therapy Type, 2026 to 2036
- Global Market Analysis and Forecast, By Application, 2021 to 2036
- Introduction / Key Findings
- Historical Market Size Value (USD Million) Analysis By Application, 2021 to 2025
- Current and Future Market Size Value (USD Million) Analysis and Forecast By Application, 2026 to 2036
- Oncology
- Autoimmune Disorders
- Cardiovascular Diseases
- Neurological Disorders
- Rare Diseases
- Oncology
- Y-o-Y Growth Trend Analysis By Application, 2021 to 2025
- Absolute $ Opportunity Analysis By Application, 2026 to 2036
- Global Market Analysis and Forecast, By End User, 2021 to 2036
- Introduction / Key Findings
- Historical Market Size Value (USD Million) Analysis By End User, 2021 to 2025
- Current and Future Market Size Value (USD Million) Analysis and Forecast By End User, 2026 to 2036
- Hospitals
- Specialty Clinics
- Research Institutes
- Cell Therapy Manufacturing Organizations
- Hospitals
- Y-o-Y Growth Trend Analysis By End User, 2021 to 2025
- Absolute $ Opportunity Analysis By End User, 2026 to 2036
- Global Market Analysis and Forecast, By Cell Source, 2021 to 2036
- Introduction / Key Findings
- Historical Market Size Value (USD Million) Analysis By Cell Source, 2021 to 2025
- Current and Future Market Size Value (USD Million) Analysis and Forecast By Cell Source, 2026 to 2036
- Bone Marrow Cells
- Peripheral Blood Cells
- Umbilical Cord Cells
- Induced Pluripotent Stem Cells
- Bone Marrow Cells
- Y-o-Y Growth Trend Analysis By Cell Source, 2021 to 2025
- Absolute $ Opportunity Analysis By Cell Source, 2026 to 2036
- Global Market Analysis and Forecast, By Region, 2021 to 2036
- Introduction
- Historical Market Size Value (USD Million) Analysis By Region, 2021 to 2025
- Current Market Size Value (USD Million) Analysis and Forecast By Region, 2026 to 2036
- North America
- Latin America
- Western Europe
- Eastern Europe
- East Asia
- South Asia and Pacific
- Middle East & Africa
- Market Attractiveness Analysis By Region
- North America Market Analysis and Forecast, By Country, 2021 to 2036
- Historical Market Size Value (USD Million) Trend Analysis By Market Taxonomy, 2021 to 2025
- Market Size Value (USD Million) Forecast By Market Taxonomy, 2026 to 2036
- By Country
- USA
- Canada
- By Therapy Type
- By Application
- By End User
- By Cell Source
- By Country
- Market Attractiveness Analysis
- By Country
- By Therapy Type
- By Application
- By End User
- By Cell Source
- Key Takeaways
- Latin America Market Analysis and Forecast, By Country
- Historical Market Size Value (USD Million) Trend Analysis By Market Taxonomy, 2021 to 2025
- Market Size Value (USD Million) Forecast By Market Taxonomy, 2026 to 2036
- By Country
- Brazil
- Mexico
- Chile
- Rest of Latin America
- By Therapy Type
- By Application
- By End User
- By Cell Source
- By Country
- Market Attractiveness Analysis
- By Country
- By Therapy Type
- By Application
- By End User
- By Cell Source
- Key Takeaways
- Western Europe Market Analysis and Forecast, By Country
- Historical Market Size Value (USD Million) Trend Analysis By Market Taxonomy, 2021 to 2025
- Market Size Value (USD Million) Forecast By Market Taxonomy, 2026 to 2036
- By Country
- Germany
- UK
- Italy
- Spain
- France
- Nordic
- BENELUX
- Rest of Western Europe
- By Therapy Type
- By Application
- By End User
- By Cell Source
- By Country
- Market Attractiveness Analysis
- By Country
- By Therapy Type
- By Application
- By End User
- By Cell Source
- Key Takeaways
- Eastern Europe Market Analysis and Forecast, By Country
- Historical Market Size Value (USD Million) Trend Analysis By Market Taxonomy, 2021 to 2025
- Market Size Value (USD Million) Forecast By Market Taxonomy, 2026 to 2036
- By Country
- Russia
- Poland
- Hungary
- Balkan & Baltic
- Rest of Eastern Europe
- By Therapy Type
- By Application
- By End User
- By Cell Source
- By Country
- Market Attractiveness Analysis
- By Country
- By Therapy Type
- By Application
- By End User
- By Cell Source
- Key Takeaways
- East Asia Market Analysis and Forecast, By Country
- Historical Market Size Value (USD Million) Trend Analysis By Market Taxonomy, 2021 to 2025
- Market Size Value (USD Million) Forecast By Market Taxonomy, 2026 to 2036
- By Country
- China
- Japan
- South Korea
- By Therapy Type
- By Application
- By End User
- By Cell Source
- By Country
- Market Attractiveness Analysis
- By Country
- By Therapy Type
- By Application
- By End User
- By Cell Source
- Key Takeaways
- South Asia and Pacific Market Analysis and Forecast, By Country
- Historical Market Size Value (USD Million) Trend Analysis By Market Taxonomy, 2021 to 2025
- Market Size Value (USD Million) Forecast By Market Taxonomy, 2026 to 2036
- By Country
- India
- ASEAN
- Australia & New Zealand
- Rest of South Asia and Pacific
- By Therapy Type
- By Application
- By End User
- By Cell Source
- By Country
- Market Attractiveness Analysis
- By Country
- By Therapy Type
- By Application
- By End User
- By Cell Source
- Key Takeaways
- Middle East & Africa Market Analysis and Forecast, By Country
- Historical Market Size Value (USD Million) Trend Analysis By Market Taxonomy, 2021 to 2025
- Market Size Value (USD Million) Forecast By Market Taxonomy, 2026 to 2036
- By Country
- Kingdom of Saudi Arabia
- Other GCC Countries
- Türkiye
- South Africa
- Other African Union
- Rest of Middle East & Africa
- By Therapy Type
- By Application
- By End User
- By Cell Source
- By Country
- Market Attractiveness Analysis
- By Country
- By Therapy Type
- By Application
- By End User
- By Cell Source
- Key Takeaways
- Key Countries Market Analysis
- USA
- Pricing Analysis
- Market Share Analysis, 2025
- By Therapy Type
- By Application
- By End User
- By Cell Source
- Canada
- Pricing Analysis
- Market Share Analysis, 2025
- By Therapy Type
- By Application
- By End User
- By Cell Source
- Mexico
- Pricing Analysis
- Market Share Analysis, 2025
- By Therapy Type
- By Application
- By End User
- By Cell Source
- Brazil
- Pricing Analysis
- Market Share Analysis, 2025
- By Therapy Type
- By Application
- By End User
- By Cell Source
- Chile
- Pricing Analysis
- Market Share Analysis, 2025
- By Therapy Type
- By Application
- By End User
- By Cell Source
- Germany
- Pricing Analysis
- Market Share Analysis, 2025
- By Therapy Type
- By Application
- By End User
- By Cell Source
- UK
- Pricing Analysis
- Market Share Analysis, 2025
- By Therapy Type
- By Application
- By End User
- By Cell Source
- Italy
- Pricing Analysis
- Market Share Analysis, 2025
- By Therapy Type
- By Application
- By End User
- By Cell Source
- Spain
- Pricing Analysis
- Market Share Analysis, 2025
- By Therapy Type
- By Application
- By End User
- By Cell Source
- France
- Pricing Analysis
- Market Share Analysis, 2025
- By Therapy Type
- By Application
- By End User
- By Cell Source
- India
- Pricing Analysis
- Market Share Analysis, 2025
- By Therapy Type
- By Application
- By End User
- By Cell Source
- ASEAN
- Pricing Analysis
- Market Share Analysis, 2025
- By Therapy Type
- By Application
- By End User
- By Cell Source
- Australia & New Zealand
- Pricing Analysis
- Market Share Analysis, 2025
- By Therapy Type
- By Application
- By End User
- By Cell Source
- China
- Pricing Analysis
- Market Share Analysis, 2025
- By Therapy Type
- By Application
- By End User
- By Cell Source
- Japan
- Pricing Analysis
- Market Share Analysis, 2025
- By Therapy Type
- By Application
- By End User
- By Cell Source
- South Korea
- Pricing Analysis
- Market Share Analysis, 2025
- By Therapy Type
- By Application
- By End User
- By Cell Source
- Russia
- Pricing Analysis
- Market Share Analysis, 2025
- By Therapy Type
- By Application
- By End User
- By Cell Source
- Poland
- Pricing Analysis
- Market Share Analysis, 2025
- By Therapy Type
- By Application
- By End User
- By Cell Source
- Hungary
- Pricing Analysis
- Market Share Analysis, 2025
- By Therapy Type
- By Application
- By End User
- By Cell Source
- Kingdom of Saudi Arabia
- Pricing Analysis
- Market Share Analysis, 2025
- By Therapy Type
- By Application
- By End User
- By Cell Source
- Türkiye
- Pricing Analysis
- Market Share Analysis, 2025
- By Therapy Type
- By Application
- By End User
- By Cell Source
- South Africa
- Pricing Analysis
- Market Share Analysis, 2025
- By Therapy Type
- By Application
- By End User
- By Cell Source
- USA
- Market Structure Analysis
- Competition Dashboard
- Competition Benchmarking
- Market Share Analysis of Top Players
- By Regional
- By Therapy Type
- By Application
- By End User
- By Cell Source
- Emerging Startups
- Innovation Benchmarking
- Competition Analysis
- Competition Deep Dive
- Lonza
- Overview
- Product Portfolio
- Profitability by Market Segments
- Sales Footprint
- Strategy Overview
- Marketing Strategy
- Product Strategy
- Channel Strategy
- Thermo Fisher Scientific
- Cytiva
- Catalent
- Bio-Techne
- Miltenyi Biotec
- FUJIFILM Cellular Dynamics
- Takara Bio
- Sartorius
- Charles River Laboratories
- Lonza
- Case Studies
- Success Stories
- Recent Developments
- Competition Deep Dive
- Assumptions & Acronyms Used


