

- Market Size (2026)
- USD 12.5 Bn
- Forecast (2036)
- USD 21.6 Bn
- CAGR (2026 to 2036)
- 5.6%
Chassis Bushing and Mount Replacement Parts Market Size, Market Forecast and Outlook By FMI
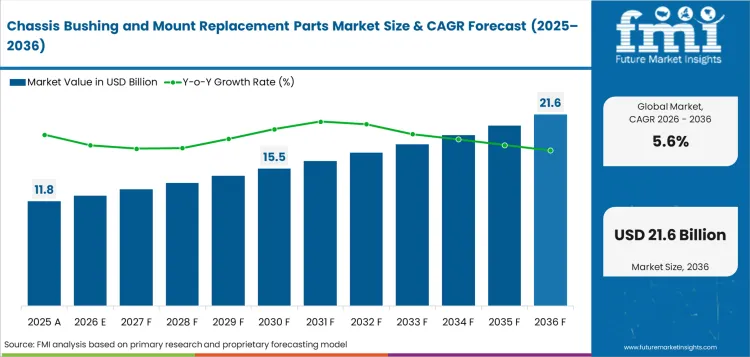
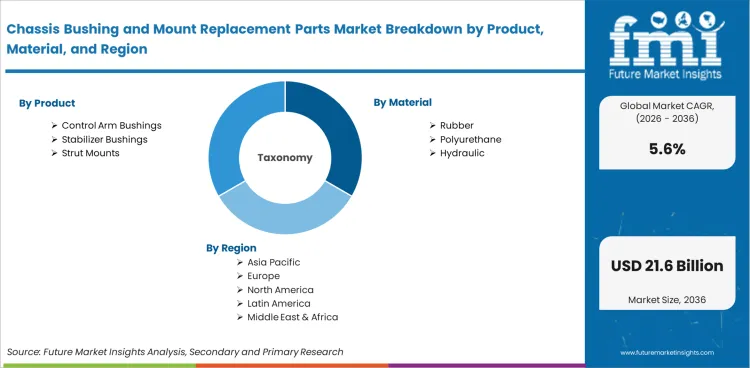
The chassis bushing and mount replacement parts market was valued at USD 11.8 billion in 2025. Industry revenue is expected to reach USD 12.5 billion in 2026 and rise to USD 21.6 billion by 2036 at 5.6% CAGR. Rubber is expected to account for 64.3% share of material in 2026. Passenger cars are forecast to account for 61.8% share of vehicle type in 2026.
Summary of Chassis Bushing and Mount Replacement Parts Market
- Demand and Growth Drivers
- Aging vehicle fleets raise replacement frequency as rubber bushings crack after long service exposure.
- Higher vehicle miles increase control arm and stabilizer bushing wear during daily driving.
- Electric vehicles need mount parts tuned for lower cabin vibration and heavier battery platforms.
- Product and Segment View
- Rubber is projected to account for 64.3% share in 2026 as factory-style replacement remains the main repair choice.
- Passenger cars are expected to account for 61.8% share in 2026 with broad service demand across used vehicles.
- Direct replacement is expected to represent 67.4% share in 2026 as most repairs restore original ride feel.
- Geography and Competitive Outlook
- China demand is projected to record 6.8% CAGR by 2036 with a large vehicle parc and high new vehicle output.
- India is expected to expand at 6.4% CAGR by 2036 as service networks grow around passenger cars and utility vehicles.
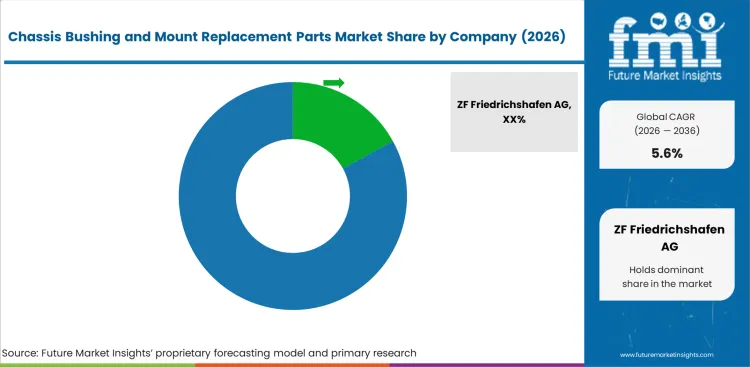
- ZF Friedrichshafen AG and Tenneco Inc. anchor premium chassis coverage through TRW and MOOG aftermarket portfolios.
- Analyst Opinion
- Nikhil Kaitwade, Principal Consultant for Automotive at FMI, opines, "Chassis bushings and mounts may appear as straightforward rubber components, but today's aftermarket reality is far more sophisticated. Technicians are increasingly opting for complete arms and pre-assembled kits to minimize labor-intensive pressing work. Vehicle age driving consistent replacement demand influences precise fitment as the decisive factor in supplier selection. Suppliers who combine deep catalog coverage with broad vehicle application and clear installation support are the ones best positioned to capture loyalty and repeat repair business.”
- Chassis Bushing and Mount Replacement Parts Market Value Analysis
- Revenue is tied to replacement parts installed during steering and suspension service. Adjacent automotive suspension systems provide a boundary check for total undercar value.
- Average selling price rises once bushings are supplied within full control arm assemblies. Suspension control arms support value checks once bushings come pre-pressed.
- Repair labor affects product selection as workshops avoid loose bushings that need extra press work.
- Fleet maintenance programs promote repeat orders for direct-fit mounts and chassis repair kits.
Key Takeaways, Market Size, and Forecast
- The chassis bushing and mount replacement parts market size stood at USD 11.8 billion in 2025.
- Industry value is projected to reach USD 21.6 billion by 2036 as aging vehicles raise suspension repair frequency.
- From 2026 to 2036, the sector is projected to expand at 5.6% CAGR.
- Industry revenue is forecast to create incremental opportunity of USD 9.1 billion from 2026 to 2036.
- Rubber is likely to account for 64.3% share in 2026 led by workshops preferring factory-like ride feel.
- Passenger cars are expected to represent 61.8% share in 2026 with high repair volumes.
- China is projected to record 6.8% CAGR by 2036, followed by India at 6.4% CAGR across the forecast decade.
Repair shops need bushings integrating correctly the first, without creating repeat work after installation. Mevotech added 193 part numbers in April 2025 with 58 first-to-market parts for wider late-model vehicle coverage. Such coverage gives distributors a stronger reason to stock suppliers matching newer vehicles without long part searches. A March 2025 recall by the National Highway Traffic Safety Administration covered 275 Lemförder and TRW track control arms with a short bushing inner sleeve. Such kind of issue reflects why sleeve size checks and traceability are important before parts reach workshops. Electric vehicles generate another repair need since quieter cabins make small vibration problems easier to notice. Vibracoustic said in June 2024, its decoupling system isolates air conditioning and pump hardware mounted to the chassis. Suppliers offering fit-checked control arm kits and better vibration control can reduce returns for workshops.
Chassis Bushing and Mount Replacement Parts Market Definition
Chassis bushing and mount replacement parts cover rubber-metal and hydraulic components used to isolate vibration in vehicle suspension and powertrain areas. Scope includes car bushings sold for repair channels and excludes factory installation during new vehicle assembly. Revenue includes aftermarket replacement parts and kits. Full shock absorbers and complete brake parts are excluded unless sold inside a bushing or mount repair assembly.
Chassis Bushing and Mount Replacement Parts Market Inclusions
Scope includes direct replacement bushings and pre-assembled control arms sold for repair. Drivetrain isolation mounting systems are counted only if supplied as replacement mounts for road vehicles. Air suspension system components are counted only if a bushing or mount is supplied within the repair kit. Sales through workshops and online platforms are included. Passenger cars and commercial vehicles are part of the coverage.
Chassis Bushing and Mount Replacement Parts Market Exclusions
Scope excludes original equipment parts installed during new vehicle assembly. Machine mounts are outside the scope unless supplied for road vehicle repair. Automotive brackets are excluded unless bundled with a defined bushing or mount assembly. Two-wheeler aftermarket components are outside four-wheel sizing. Motorcycle suspension systems are counted separately from chassis bushing repair for cars and commercial vehicles.
Chassis Bushing and Mount Replacement Parts Market Research Methodology
- Primary Research: FMI analysts reviewed workshop service behavior, parts distributor coverage, and fleet maintenance buying across key vehicle classes.
- Desk Research: Official vehicle fleet data, vehicle miles data, and company launch announcements supported demand checks and supplier mapping.
- Market Sizing and Forecasting: Forecast values used vehicle parc and replacement interval. Automotive NVH materials demand supported mount value checks.
- Data Validation: Checks compared 2026 value with 2036 value and tested CAGR consistency. Engine and transmission mount fasteners supported adjacent repair checks.
Why is the Chassis Bushing and Mount Replacement Parts Market Growing?
- Older vehicles create steady repair work as rubber and bonded mounts lose isolation after years of road exposure.
- Workshop demand favors parts that fit correctly and reduce repeat suspension complaints after repair.
- Electric vehicles raise attention on mount quality as quieter cabins make small vibration faults easier to notice.
Replacement activity is expected to stay positive as inspection checks and repair labor make worn bushings difficult to ignore. United Kingdom Driver and Vehicle Standards Agency data published in October 2025 showed body, chassis and structure defects across 3.18% of class 3 and 4 MOT tests in April to June 2025. Such figure influences replacement demand since chassis defects often push owners toward workshop inspection before small noises become safety issues. Clear inspection limits give repair shops a stronger case for replacing worn bushes before annual tests. Electric vehicle platforms keep mount design important because a 2024 peer-reviewed study on hybrid electric vehicle powertrain mounting systems links mount design with lower vibration and noise. Quieter cabins make small mount faults easier to notice, so suppliers with accurate fitment and stable rubber-metal parts are expected to achieve repeat repair orders.
Market Segmentation Analysis
- Rubber is forecast to capture 64.3% share in 2026, driven by most workshops restoring factory ride feel at controlled cost.
- Passenger cars are projected to represent 61.8% share in 2026 with high repair frequency across used vehicle fleets.
- Direct replacement is expected to account for 67.4% share in 2026 since owners favor normal ride quality over upgrades.
- Repair workshops are expected to hold 57.6% share in 2026 due to increase in access and pressed-bushing service needs.
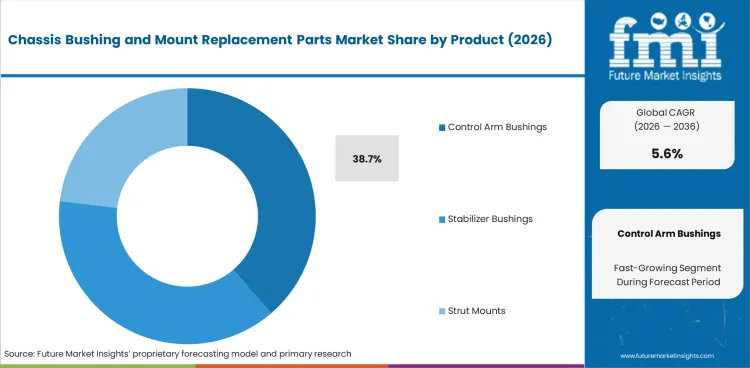
- Control arm bushings are forecast to account for 38.7% share in 2026 as wheel alignment complaints often begin at pivot points.
Segmentation is divided into five parent groups based on how repair shops and distributors specify replacement parts. Product separates bushing and mount locations. Material shows how vibration control and cost differ. Vehicle type reflects the repair population. Sales channel tracks how parts reach installers. Replacement type separates factory-style repairs from performance and kit-based demand. Automotive e-tailing affects the sales channel view as owners check fitment before shop visits.
Insights into Chassis Bushing and Mount Replacement Parts Market by Product
-
Control arm bushings are projected to account for 38.7% share in 2026 due to failed pivot joints often causing tire wear and steering drift.
- Stabilizer bushings support frequent low-ticket service as road noise and uneven ride response give drivers an early repair signal.
Insights into Chassis Bushing and Mount Replacement Parts Market by Material
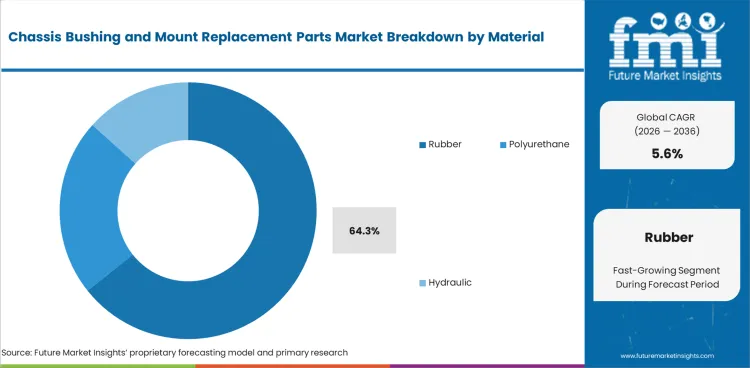
- Rubber is expected to hold 64.3% share in 2026 as most replacement jobs need quiet ride feel and familiar fit.
- Polyurethane gains limited upgrade demand from drivers who want firmer handling. Hydraulic mounts stay tied to vehicles needing smoother engine isolation.
Insights into Chassis Bushing and Mount Replacement Parts Market by Vehicle Type
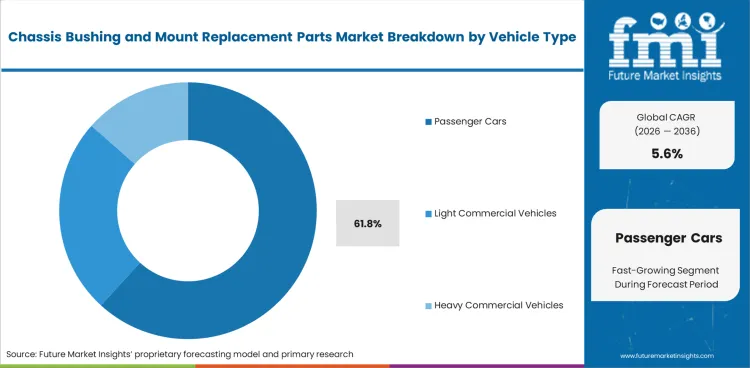
- Passenger cars are expected to represent 61.8% share in 2026, reflected by used car fleets influencing large repair volumes.
- Light commercial vehicles need mounts with higher durability as delivery mileage and curb impact raise suspension wear.
Insights into Chassis Bushing and Mount Replacement Parts Market by Sales Channel
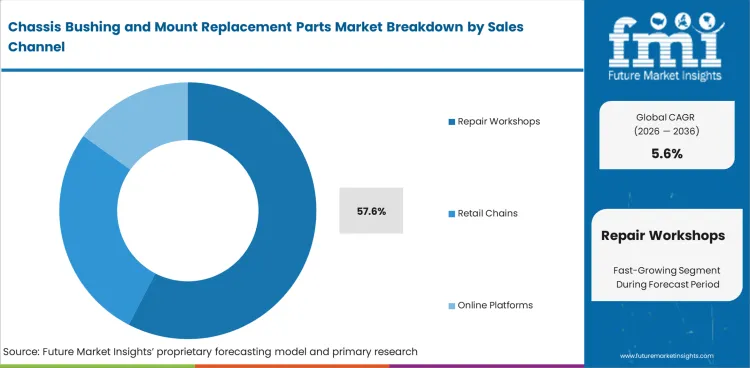
- Repair workshops are expected to capture 57.6% share in 2026 since many jobs need presses and alignment checks.
- Online platforms gain orders from do-it-yourself buyers. Retail chains keep relevance as urgent repairs need same-day part availability.
Insights into Chassis Bushing and Mount Replacement Parts Market by Replacement Type
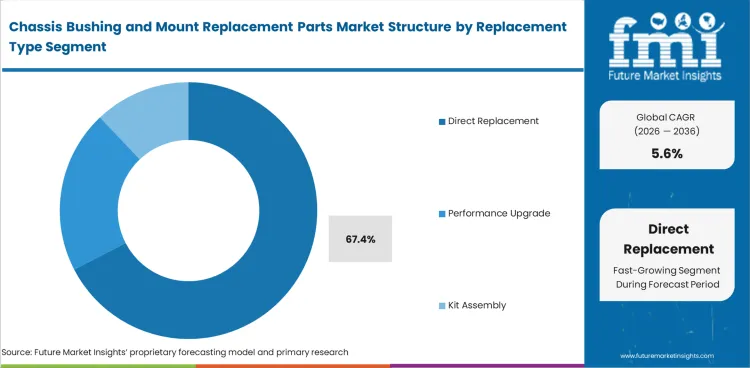
- Direct replacement is projected to account for 67.4% share in 2026, led by most buyers wanting original ride behavior restored.
- Kit assemblies improve workshop speed by pairing bushings with related hardware. 4X4 vehicle parts create upgrade demand in vehicles exposed to off-road suspension loads.
Chassis Bushing and Mount Replacement Parts Market Drivers, Restraints and Opportunities
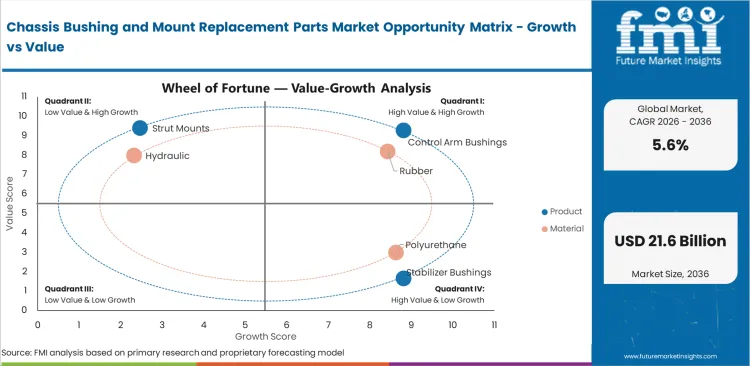
- Long service exposure keeps bushing and mount replacement tied to routine steering and suspension repair.
- Price-led parts selection can raise return risk when fitment and rubber quality are not controlled.
- Kit-based repairs and electric vehicle mounts create room for suppliers with clearer fitment and vibration control.
Workshop demand is expected to widen as repair jobs shift toward parts solving noise complaints with fewer repeat visits. Subaru of America’s February 2025 service bulletin for 2022 to 2025 WRX models linked a front lower control arm click or crack sound to slight bushing movement and directed replacement of the affected lower control arm. It also listed 0.4 hours labor for one lower arm or ball joint replacement and 0.7 hours for both sides, which shows why repair time affects part choice. A September 2025 technical service bulletin filed with the National Highway Traffic Safety Administration directed replacement of damaged rubber mounting on both sides of the upper rear link. Electric vehicle growth adds another route for mount suppliers since the International Energy Agency reported in May 2026 that electric car sales exceeded 20 million in 2025.
Regulatory Compliance and Operating Standards Analysis
Bushing and mount suppliers are expected to face tighter repair documentation needs as suspension hardware faults receive formal safety treatment. National Highway Traffic Safety Administration’s June 2025 Part 573 Safety Recall Report for Volkswagen recall 25V434 stated that the issue reached Volkswagen’s Product Safety Committee on June 18, 2025 and a recall was decided. It also recorded 5 warranty claims and 4 claims in the USA market, reflecting how small chassis or suspension fastening faults can move from workshop repair into official safety action. Suppliers with traceable hardware kits and clear fitment data are likely to gain stronger workshop trust as online ordering expands.
Competitive Benchmarking and Technology Positioning Analysis
Competition is expected to favor suppliers combining part availability with application coverage across newer vehicles. Delphi stated in March 2026, its latest aftermarket expansion added 129 new SKUs and 13 first-to-market part numbers across steering and suspension, vehicle electronics, and fuel management. Steering and suspension carried the largest part of the release with 73 new SKUs, including suspension control arm and ball joint assemblies. The additions expanded coverage to more than 274 million vehicles in operation in the United States and Canada, providing distributors a stronger reason to prioritize suppliers with broad catalog depth and fast fitment matching.
Analysis of Chassis Bushing and Mount Replacement Parts Market by Key Countries
.webp "Top Country Growth Comparison Chassis Bushing And Mount Replacement Parts Market Cagr (2026 2036)")
| Country | CAGR |
|---|---|
| China | 6.8% |
| India | 6.4% |
| United States | 5.9% |
| United Kingdom | 5.5% |
| Germany | 5.2% |
| Japan | 4.9% |
| France | 4.6% |
Source: Future Market Insights, 2026.
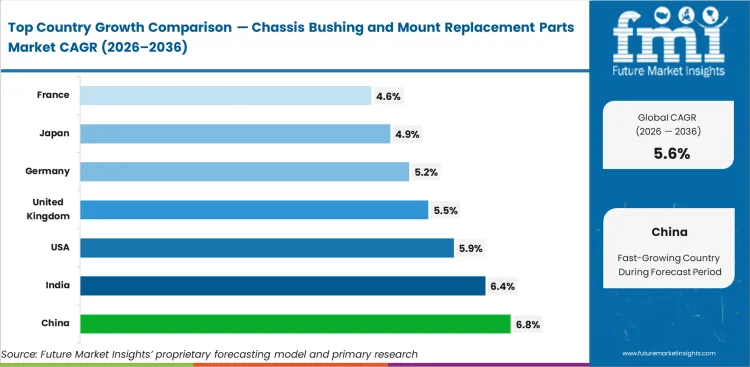
Chassis Bushing and Mount Replacement Parts Market CAGR Analysis by Country
- China is projected to record a 6.8% CAGR by 2036, driven by large vehicle output expanding the future repair pool.
- India is expected to expand at 6.4% CAGR by 2036 due to utility vehicle sales deepening workshop demand.
- United States is forecast to grow at 5.9% CAGR by 2036 with high road mileage raising replacement cycles.
- United Kingdom is expected to advance at 5.5% CAGR by 2036 as vehicle age supports routine suspension repair.
- Germany is projected to rise at 5.2% CAGR by 2036 through premium vehicle service and aftermarket coverage.
- Japan is forecast at 4.9% CAGR by 2036, reflecting an aging fleet offsetting softer new vehicle output.
- France is expected to post 4.6% CAGR by 2036, led by steady passenger car service and parts distribution.
Country performance differs by vehicle parc size and repair channel depth. China and India track above the global rate as large new vehicle flows expand service networks. Asia Pacific automotive aftermarket breadth supports regional demand around mixed vehicle ages. ASEAN automotive aftermarket growth influences supplier stocking across nearby export channels.
Demand Outlook for Chassis Bushing and Mount Replacement Parts Market in China
Demand in China is projected to record 6.8% CAGR by 2036, led by vehicle output creating a large future replacement population. China Association of Automobile Manufacturers data published through the State Council in January 2026 placed 2025 auto output at 34.5 million units. New energy vehicle production reached 16.6 million units in the same release. Electric platforms increase attention to mount isolation as cabin noise falls. Parts suppliers can benefit from high vehicle density and fast catalog turnover.
- Large vehicle output keeps long-run replacement need broad across passenger cars and utility vehicles.
- Electric vehicle growth raises the need for mounts tuned to lower vibration and lower cabin noise.
- Domestic distribution favors suppliers with wide fitment data and fast regional stock movement.
Demand Analysis of Chassis Bushing and Mount Replacement Parts Market in India
Sector in India is expected to expand at 6.4% CAGR by 2036, driven by increasing passenger car and utility vehicle service networks. Society of Indian Automobile Manufacturers stated in April 2025, passenger vehicles and three wheelers grew in FY 2024 to 2025. Utility vehicles add heavier suspension loads and more bushing wear on mixed roads. Independent workshops keep direct replacement parts central to repair demand. Suppliers with fitment coverage across local and imported platforms gain wider reach.
- Urban service networks expand parts access for passenger cars and sport utility vehicles.
- Mixed road conditions lift replacement need for control arm and stabilizer bushings.
- Local distributors value kit packaging as it reduces missing hardware during repair jobs.
Sales Outlook for Chassis Bushing and Mount Replacement Parts Market in the United States
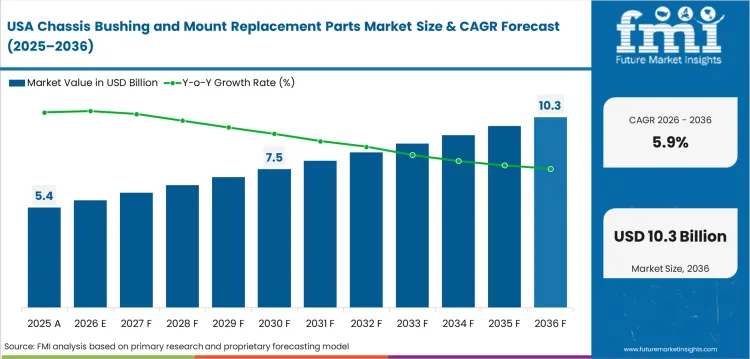
Sales in the United States are forecast to grow at 5.9% CAGR by 2036 with mileage and vehicle age supporting repeat undercar repair. Federal Highway Administration reported in January 2026 that 2025 travel reached 3,323.8 billion vehicle miles. High driving exposure raises stress at chassis pivot points and mount locations. Dorman and ZF expanded chassis coverage during 2025 to address the broad vehicle population. Installer trust depends on fast catalog matching and predictable fit.
- High annual mileage supports recurring replacement for stabilizer bushings and control arm bushings.
- Parts stores and workshops need same-day coverage for popular trucks and passenger vehicles.
- Fleet maintenance favors direct-fit mounts that reduce downtime and limit repeat complaints.
Industry Outlook for Chassis Bushing and Mount Replacement Parts Market in the United Kingdom
Industry in the United Kingdom is expected to advance at 5.5% CAGR by 2036 reflecting fleet age promoting steady suspension repair. Government vehicle licensing statistics released in April 2026 recorded 41.5 million licensed road-using vehicles at the end of 2025. Licensed cars averaged 10 years since first use. Older cars need replacement mounts as rubber parts harden and road noise increases. Retail chains and online sellers compete on fitment clarity for owners and small workshops.
- MOT-style inspection behavior keeps steering and suspension repair visible to vehicle owners.
- Older car stock supports regular demand for rubber bushings and strut mount repairs.
- Online catalogs need accurate registration matching as owners compare parts before workshop visits.
Growth Outlook for Chassis Bushing and Mount Replacement Parts Market in Germany
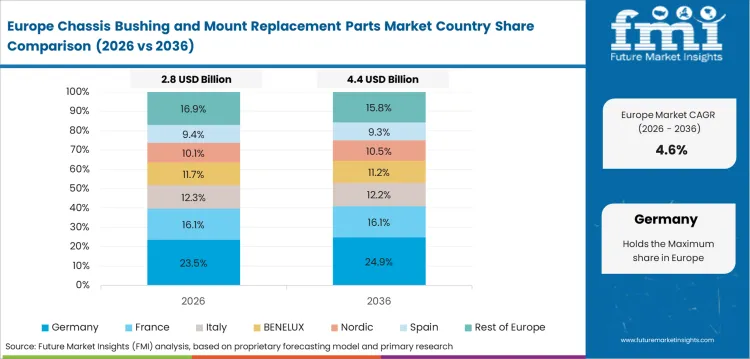
The market in Germany is projected to rise at 5.2% CAGR by 2036 through premium repair behavior and strong European parts supply. Verband der Automobilindustrie reported in August 2025 German domestic car production reached 2.5 million units during January to July 2025. Passenger car exports reached 1.9 million units during the same period. Premium vehicle ownership raises expectations for low noise and stable handling after repair. Continental and ZF portfolio activity supports European workshop coverage.
- Premium passenger cars influences demand for mounts preserving ride comfort after repair.
- Parts distributors favor suppliers with tested rubber-metal parts and warranty support.
- Workshop training supports proper installation as mount orientation affects vibration performance.
Sales Analysis of Chassis Bushing and Mount Replacement Parts Market in Japan
Sales in Japan are forecast at 4.9% CAGR by 2036 as mature vehicle service offsets softer production. Japan Automobile Manufacturers Association reported in September 2025 that 2024 motor vehicle production stood at 8.2 million units. Used motor vehicle sales reached 6.5 million units in 2024 in the same publication. Used vehicle activity supports replacement bushing demand as owners maintain older cars. Supplier fitment accuracy affects repair confidence for compact cars and imported models.
- Used vehicle circulation sustains replacement demand for rubber mounts and control arm bushings.
- Compact car repairs favor direct replacement parts with predictable ride comfort.
- Japan trailing arm bushing demand gives suppliers a focused route into model-specific suspension parts.
Demand Outlook for Chassis Bushing and Mount Replacement Parts Market in France
Demand in France is expected to post 4.6% CAGR by 2036 since passenger car service maintains measured replacement demand. European Automobile Manufacturers Association data issued in January 2026 showed 94.5 thousand buses were operating in France during 2024. France remains one of the core repair countries inside that vehicle parc. Aging cars and lower new vehicle turnover keep workshops focused on repair value. Suppliers with broad European fitment and local stock are better placed for repeat orders.
- Dense workshop networks support regular suspension repair for older passenger cars.
- European parts distributors favor suppliers able to cover French and cross-border vehicle models.
- Cost-sensitive repair jobs keep rubber direct replacement parts ahead of upgrade formats.
Competitive Landscape and Strategic Positioning
- Integrated chassis suppliers gain advantage by combining control arms with bushings already installed for faster repair.
- Rubber and vibration specialists compete led by proving mount performance in noise and ride comfort applications.
- Catalog-led suppliers win workshop attention through late-model coverage and clear vehicle fitment data.
Competition is fueled by suppliers covering a wide vehicle parc without forcing workshops into part substitutions. ZF Friedrichshafen AG sells TRW and Lemfoerder chassis parts across original equipment and aftermarket channels. Tenneco Inc. competes based on MOOG steering and suspension coverage. Continental AG and Vibracoustic SE bring rubber-metal and vibration isolation know-how. Mevotech and Dorman Products focus on repair-focused coverage for North American vehicles. Delphi, a PHINIA Inc. brand adds European steering and suspension depth through its Professional+ line.
Supplier choice depends on whether the part solves a repair without adding fitment risk. Workshops review bushing material and catalog accuracy before ordering. Fleet accounts care about downtime and warranty repeat rates. Smaller firms can win in specific applications, but limited coverage hurts larger distributor listings. Suppliers with product breadth and clear installation guidance are best placed to secure repeat orders.
Key Companies in the Chassis Bushing and Mount Replacement Parts Market
Competitive structure is grouped by integrated chassis suppliers, vibration isolation specialists, and aftermarket coverage specialists.
- Integrated Chassis Suppliers: ZF Friedrichshafen AG and Tenneco Inc. supply broad steering and suspension lines under TRW, Lemfoerder, and MOOG brands.
- Vibration Isolation Specialists: Continental AG, Vibracoustic SE, Sumitomo Riko Company Limited, and BOGE Rubber & Plastics Group supply rubber-metal and mount technologies.
- Aftermarket Coverage Specialists: Mevotech LP, Dorman Products Inc., Delphi, a PHINIA Inc. brand and Ferdinand Bilstein GmbH + Co. KG compete through repair coverage and catalog depth.
Competitive Benchmarking: Chassis Bushing and Mount Replacement Parts Market
| Company | Rubber-Metal Mount Depth | Aftermarket Fitment Coverage | Repair Kit Readiness | Geographic Footprint |
|---|---|---|---|---|
| ZF Friedrichshafen AG | High | High | Strong | Global |
| Tenneco Inc. | High | High | Strong | Global |
| Continental AG | High | Medium | Strong | Europe and global |
| Vibracoustic SE | High | Medium | Medium | Global |
| Sumitomo Riko Company Limited | High | Medium | Medium | Asia and global |
| Mevotech LP | Medium | High | Strong | North America |
| Dorman Products Inc. | Medium | High | Strong | North America |
| Delphi, a PHINIA Inc. brand | Medium | High | Medium | Europe and North America |
| Ferdinand Bilstein GmbH + Co. KG | Medium | Medium | Strong | Europe and global |
Source: Future Market Insights competitive analysis 2026. Ratings reflect relative positioning based on rubber-metal mount depth, aftermarket fitment coverage, and repair kit readiness.
Key Developments in Chassis Bushing and Mount Replacement Parts Market
- In July 2025, ZF Aftermarket expanded its TRW chassis line with 176 chassis products issued in 2025.
- In October 2025, Continental expanded its chassis and steering range with over 1,000 new items in 2025.
- In December 2025, Delphi reported 95.84% coverage for track control arms and wishbones in the European independent aftermarket.
Key Players in the Chassis Bushing and Mount Replacement Parts Market
Major Global Players:
- ZF Friedrichshafen AG
- Tenneco Inc.
- Continental AG
- Vibracoustic SE
- Sumitomo Riko Company Limited
Specialist and Regional Players:
- Mevotech LP
- Dorman Products Inc.
- Delphi, a PHINIA Inc. brand
- Ferdinand Bilstein GmbH + Co. KG
- BOGE Rubber & Plastics Group
Market Report Scope
| Parameter | Details |
|---|---|
| Quantitative units | USD 12.5 billion to USD 21.6 billion, at 5.6% CAGR |
| Market definition | Replacement bushings and mounts used in chassis, suspension, and powertrain vibration isolation repair |
| Product | Control arm bushings, stabilizer bushings, strut mounts, engine mounts, subframe mounts |
| Material | Rubber, polyurethane, hydraulic, metal bonded |
| Vehicle type | Passenger cars, light commercial vehicles, heavy commercial vehicles, electric vehicles |
| Sales channel | Repair workshops, retail chains, online platforms, fleet contracts |
| Replacement type | Direct replacement, performance upgrade, kit assembly |
| Regions covered | North America, Europe, East Asia, South Asia and Pacific, Latin America, Middle East and Africa |
| Countries covered | China, India, United States, United Kingdom, Germany, Japan, France |
| Key companies profiled | ZF Friedrichshafen AG, Tenneco Inc., Continental AG, Vibracoustic SE, Sumitomo Riko Company Limited, Mevotech LP, Dorman Products Inc., Delphi Technologies, Ferdinand Bilstein GmbH + Co. KG, BOGE Rubber & Plastics Group |
| Forecast period | 2026 to 2036 |
| Approach | Hybrid bottom-up and top-down model using vehicle parc, mileage, replacement rate, and supplier coverage checks |
Source: Future Market Insights, 2026.
Chassis Bushing and Mount Replacement Parts Market Breakdown by Product, Material, Vehicle Type, Sales Channel, Replacement Type, and Region
By Product:
- Control Arm Bushings
- Stabilizer Bushings
- Strut Mounts
- Engine Mounts
- Subframe Mounts
By Material:
- Rubber
- Polyurethane
- Hydraulic
- Metal Bonded
By Vehicle Type:
- Passenger Cars
- Light Commercial Vehicles
- Heavy Commercial Vehicles
- Electric Vehicles
By Sales Channel:
- Repair Workshops
- Retail Chains
- Online Platforms
- Fleet Contracts
By Replacement Type:
- Direct Replacement
- Performance Upgrade
- Kit Assembly
By Region:
- North America
- United States
- Canada
- Mexico
- Latin America
- Brazil
- Chile
- Rest of Latin America
- Western Europe
- Germany
- United Kingdom
- France
- Italy
- Spain
- Nordic
- BENELUX
- Eastern Europe
- Poland
- Russia
- Balkan and Baltic
- Rest of Eastern Europe
- East Asia
- China
- Japan
- South Korea
- South Asia and Pacific
- India
- ASEAN
- Australia
- Rest of South Asia and Pacific
- Middle East and Africa
- GCC
- South Africa
- Rest of Middle East and Africa
Research Sources and Bibliography
- Mevotech LP. (2025, April 16). Mevotech expands coverage with 193 new parts, including 58 first-to-markets.
- National Highway Traffic Safety Administration. (2025, March 21). Control arm may crack subframe during installation: Recall acknowledgement letter, NHTSA campaign number 25E-020. United States Department of Transportation.
- Vibracoustic SE. (2024, June 11). Vibracoustic presents NVH solution for thermal management systems in electric vehicles.
- Driver and Vehicle Standards Agency. (2025, October 30). MOT class 3 and 4 vehicles: Initial failures by defect category. GOV.UK.
- Subaru of America, Inc. (2025, February 3). Click/crack sound from front lower control arm: Service bulletin number 05-92-25. National Highway Traffic Safety Administration.
- Volkswagen Group of America, Inc. (2025, September 30). Technical service bulletin 2060855/4. National Highway Traffic Safety Administration.
- International Energy Agency. (2026). Global EV Outlook 2026: Trends in electric cars.
- Volkswagen Group of America, Inc. (2025, June 25). Part 573 Safety Recall Report 25V434: Manufacturer recall number 42HX. National Highway Traffic Safety Administration.
- Delphi. (2026, March 2). Delphi expands product lines with 13 first-to-market part numbers. PHINIA Inc.
- ZF Friedrichshafen AG. (2025, July 22). ZF Aftermarket expands TRW chassis line, extending NA coverage to an additional 54 million vehicles in operation in 2025.
- Continental AG. (2025, October 28). A thousand new parts: Continental continues to expand its spare parts portfolio for chassis and steering.
- Delphi. (2025, December 16). Delphi reaches #1 coverage across all five steering and suspension categories. PHINIA Inc.
- European Automobile Manufacturers’ Association. (2026, January 15). Vehicles on European roads 2026.
- Department for Transport. (2026, April 29). Vehicle licensing statistics, United Kingdom: 2025. GOV.UK.
- Federal Highway Administration. (2026, January 28). Traffic volume trends: December 2025. United States Department of Transportation.
- Japan Automobile Manufacturers Association. (2025, September 26). The motor industry of Japan 2025.
- Society of Indian Automobile Manufacturers. (2025, April 15). Performance of auto industry during March 2025 and April 2024 to March 2025.
- State Council of the People’s Republic of China. (2026, January 14). China auto output, sales reach new highs in 2025.
- Verband der Automobilindustrie. (2025, August 4). Electric car production at record levels in first half of the year.
Bibliography uses primary government, official trade body, and company sources published after January 2024.
This Report Answers
- What is the expected value of chassis bushing and mount replacement parts by 2036?
- What CAGR is forecast for chassis bushing and mount replacement parts from 2026 to 2036?
- Which material is projected to account for a leading share in 2026?
- Which vehicle type is expected to hold a strong share of demand?
- How do vehicle age and road mileage affect bushing and mount replacement?
- Which countries are forecast to record faster replacement demand by 2036?
- Which companies compete in the chassis bushing and mount replacement parts sector?
- How do electric vehicles affect mount and bushing supplier selection?
- What methodology supports the chassis bushing and mount replacement parts forecast?
Frequently Asked Questions
What is the chassis bushing and mount replacement parts market value in 2026?
The chassis bushing and mount replacement parts market value is estimated at USD 12.5 billion in 2026 as repair workshops replace worn chassis parts.
What is the expected value of chassis bushing and mount replacement parts by 2036?
Industry revenue is forecast to reach USD 21.6 billion by 2036 with vehicle age and road mileage raising replacement work.
What CAGR is expected for chassis bushing and mount replacement parts?
The sector is projected to expand at 5.6% CAGR from 2026 to 2036 with repair channel support.
Which material holds a strong share in chassis bushing and mount replacement parts market?
Rubber is expected to account for 64.3% share in 2026 since workshops need factory-like ride comfort and lower noise.
Which vehicle type is prominent in chassis bushing and mount replacement parts market?
Passenger cars are forecast to hold 61.8% share in 2026 as used vehicle fleets generate frequent undercar repair demand.
Which country grows faster in chassis bushing and mount replacement parts market?
China is projected to record 6.8% CAGR by 2036 as high vehicle output increases the future repair population.
What are chassis bushings and mounts?
Chassis bushings and mounts are parts that isolate vibration between suspension and powertrain areas during vehicle movement.
How is chassis bushing and mount replacement parts market forecast prepared?
Forecasting uses vehicle parc, mileage, replacement interval, average selling price, and supplier coverage checks across key countries.
Which replacement type should repair shops choose for normal service?
Direct replacement parts suit normal service because they restore factory ride behavior and reduce the risk of customer complaints.
How long do chassis bushings and mounts usually last?
Service life changes with road conditions and vehicle load, but inspection often begins once noise or steering looseness appears.
What is the difference between rubber and polyurethane bushings?
Rubber bushings favor quiet ride comfort. Polyurethane bushings feel firmer and suit performance upgrades for selected vehicles.
Are complete control arm kits cheaper than pressing separate bushings?
Complete kits cost more per part but can reduce labor time and rework risk during a workshop repair.
Preview the report firsthand - request a free sample
Get SampleGet the brochure for pricing and purchase details.
Get PDFTable of Content
- Key Takeaways
- Market Size and CAGR
- Top Growth Driver
- Fastest Growing Segment
- Leading Region
- Key Companies
- Emerging Opportunities
- Executive Summary
- Global Market Outlook
- Demand-side Trends
- Supply-side Trends
- Technology Roadmap Analysis
- Analysis and Recommendations
- Analyst Perspective (What is happening? Why now? What should investors know?)
- Key Questions Answered
- How large is the market?
- What is the CAGR?
- What are key trends?
- Which region dominates?
- Who are the leaders?
- Market Overview
- Market Coverage / Taxonomy
- Market Definition / Scope / Limitations
- Research Methodology
- Chapter Orientation
- Analytical Lens and Working Hypotheses
- Market Structure, Signals, and Trend Drivers
- Benchmarking and Cross-market Comparability
- Market Sizing, Forecasting, and Opportunity Mapping
- Research Design and Evidence Framework
- Desk Research Programme (Secondary Evidence)
- Expert Input and Fieldwork (Primary Evidence)
- Tooling, Models, and Reference Databases
- Data Engineering and Model Build
- Quality Assurance and Audit Trail
- Market Background
- Market Dynamics (Drivers, Restraints, Opportunity, Trends)
- Scenario Forecast (Optimistic, Likely, Conservative)
- Impact Analysis
- AI Impact
- Sustainability Impact
- Regulatory Impact
- Technology Impact
- Consumer / Buyer Analysis
- Purchase Drivers
- Adoption Barriers
- Buyer Journey
- Opportunity Map Analysis
- Product Life Cycle Analysis
- Supply Chain Analysis
- Investment Feasibility Matrix
- Value Chain Analysis
- PESTLE and Porter's Analysis
- Regulatory Landscape
- Regional Parent Market Outlook
- Production and Consumption Statistics
- Import and Export Statistics
- Global Market Analysis and Forecast, 2021 to 2036
- Historical Market Size Value (USD Billion) & Volume (Unit) Analysis, 2021 to 2025
- Current and Future Market Size Value (USD Billion) & Volume (Unit) Projections, 2026 to 2036
- Y-o-Y Growth Trend Analysis
- Absolute $ Opportunity Analysis
- Global Market Pricing Analysis, 2021 to 2036
- Global Market Analysis and Forecast, By Product, 2021 to 2036
- Introduction / Key Findings
- Historical Market Size Value (USD Billion) & Volume (Unit) Analysis By Product, 2021 to 2025
- Current and Future Market Size Value (USD Billion) & Volume (Unit) Analysis and Forecast By Product, 2026 to 2036
- Control Arm Bushings
- Stabilizer Bushings
- Strut Mounts
- Engine Mounts
- Subframe Mounts
- Control Arm Bushings
- Y-o-Y Growth Trend Analysis By Product, 2021 to 2025
- Absolute $ Opportunity Analysis By Product, 2026 to 2036
- Global Market Analysis and Forecast, By Material, 2021 to 2036
- Introduction / Key Findings
- Historical Market Size Value (USD Billion) & Volume (Unit) Analysis By Material, 2021 to 2025
- Current and Future Market Size Value (USD Billion) & Volume (Unit) Analysis and Forecast By Material, 2026 to 2036
- Rubber
- Polyurethane
- Hydraulic
- Metal Bonded
- Rubber
- Y-o-Y Growth Trend Analysis By Material, 2021 to 2025
- Absolute $ Opportunity Analysis By Material, 2026 to 2036
- Global Market Analysis and Forecast, By Vehicle Type, 2021 to 2036
- Introduction / Key Findings
- Historical Market Size Value (USD Billion) & Volume (Unit) Analysis By Vehicle Type, 2021 to 2025
- Current and Future Market Size Value (USD Billion) & Volume (Unit) Analysis and Forecast By Vehicle Type, 2026 to 2036
- Passenger Cars
- Light Commercial Vehicles
- Heavy Commercial Vehicles
- Electric Vehicles
- Passenger Cars
- Y-o-Y Growth Trend Analysis By Vehicle Type, 2021 to 2025
- Absolute $ Opportunity Analysis By Vehicle Type, 2026 to 2036
- Global Market Analysis and Forecast, By Sales Channel, 2021 to 2036
- Introduction / Key Findings
- Historical Market Size Value (USD Billion) & Volume (Unit) Analysis By Sales Channel, 2021 to 2025
- Current and Future Market Size Value (USD Billion) & Volume (Unit) Analysis and Forecast By Sales Channel, 2026 to 2036
- Repair Workshops
- Retail Chains
- Online Platforms
- Fleet Contracts
- Repair Workshops
- Y-o-Y Growth Trend Analysis By Sales Channel, 2021 to 2025
- Absolute $ Opportunity Analysis By Sales Channel, 2026 to 2036
- Global Market Analysis and Forecast, By Replacement Type, 2021 to 2036
- Introduction / Key Findings
- Historical Market Size Value (USD Billion) & Volume (Unit) Analysis By Replacement Type, 2021 to 2025
- Current and Future Market Size Value (USD Billion) & Volume (Unit) Analysis and Forecast By Replacement Type, 2026 to 2036
- Direct Replacement
- Performance Upgrade
- Kit Assembly
- Direct Replacement
- Y-o-Y Growth Trend Analysis By Replacement Type, 2021 to 2025
- Absolute $ Opportunity Analysis By Replacement Type, 2026 to 2036
- Global Market Analysis and Forecast, By Region, 2021 to 2036
- Introduction
- Historical Market Size Value (USD Billion) & Volume (Unit) Analysis By Region, 2021 to 2025
- Current Market Size Value (USD Billion) & Volume (Unit) Analysis and Forecast By Region, 2026 to 2036
- North America
- Latin America
- Western Europe
- Eastern Europe
- East Asia
- South Asia and Pacific
- Middle East & Africa
- Market Attractiveness Analysis By Region
- North America Market Analysis and Forecast, By Country, 2021 to 2036
- Historical Market Size Value (USD Billion) & Volume (Unit) Trend Analysis By Market Taxonomy, 2021 to 2025
- Market Size Value (USD Billion) & Volume (Unit) Forecast By Market Taxonomy, 2026 to 2036
- By Country
- USA
- Canada
- Mexico
- By Product
- By Material
- By Vehicle Type
- By Sales Channel
- By Replacement Type
- By Country
- Market Attractiveness Analysis
- By Country
- By Product
- By Material
- By Vehicle Type
- By Sales Channel
- By Replacement Type
- Key Takeaways
- Latin America Market Analysis and Forecast, By Country
- Historical Market Size Value (USD Billion) & Volume (Unit) Trend Analysis By Market Taxonomy, 2021 to 2025
- Market Size Value (USD Billion) & Volume (Unit) Forecast By Market Taxonomy, 2026 to 2036
- By Country
- Brazil
- Chile
- Rest of Latin America
- By Product
- By Material
- By Vehicle Type
- By Sales Channel
- By Replacement Type
- By Country
- Market Attractiveness Analysis
- By Country
- By Product
- By Material
- By Vehicle Type
- By Sales Channel
- By Replacement Type
- Key Takeaways
- Western Europe Market Analysis and Forecast, By Country
- Historical Market Size Value (USD Billion) & Volume (Unit) Trend Analysis By Market Taxonomy, 2021 to 2025
- Market Size Value (USD Billion) & Volume (Unit) Forecast By Market Taxonomy, 2026 to 2036
- By Country
- Germany
- UK
- Italy
- Spain
- France
- Nordic
- BENELUX
- Rest of Western Europe
- By Product
- By Material
- By Vehicle Type
- By Sales Channel
- By Replacement Type
- By Country
- Market Attractiveness Analysis
- By Country
- By Product
- By Material
- By Vehicle Type
- By Sales Channel
- By Replacement Type
- Key Takeaways
- Eastern Europe Market Analysis and Forecast, By Country
- Historical Market Size Value (USD Billion) & Volume (Unit) Trend Analysis By Market Taxonomy, 2021 to 2025
- Market Size Value (USD Billion) & Volume (Unit) Forecast By Market Taxonomy, 2026 to 2036
- By Country
- Russia
- Poland
- Hungary
- Balkan & Baltic
- Rest of Eastern Europe
- By Product
- By Material
- By Vehicle Type
- By Sales Channel
- By Replacement Type
- By Country
- Market Attractiveness Analysis
- By Country
- By Product
- By Material
- By Vehicle Type
- By Sales Channel
- By Replacement Type
- Key Takeaways
- East Asia Market Analysis and Forecast, By Country
- Historical Market Size Value (USD Billion) & Volume (Unit) Trend Analysis By Market Taxonomy, 2021 to 2025
- Market Size Value (USD Billion) & Volume (Unit) Forecast By Market Taxonomy, 2026 to 2036
- By Country
- China
- Japan
- South Korea
- By Product
- By Material
- By Vehicle Type
- By Sales Channel
- By Replacement Type
- By Country
- Market Attractiveness Analysis
- By Country
- By Product
- By Material
- By Vehicle Type
- By Sales Channel
- By Replacement Type
- Key Takeaways
- South Asia and Pacific Market Analysis and Forecast, By Country
- Historical Market Size Value (USD Billion) & Volume (Unit) Trend Analysis By Market Taxonomy, 2021 to 2025
- Market Size Value (USD Billion) & Volume (Unit) Forecast By Market Taxonomy, 2026 to 2036
- By Country
- India
- ASEAN
- Australia & New Zealand
- Rest of South Asia and Pacific
- By Product
- By Material
- By Vehicle Type
- By Sales Channel
- By Replacement Type
- By Country
- Market Attractiveness Analysis
- By Country
- By Product
- By Material
- By Vehicle Type
- By Sales Channel
- By Replacement Type
- Key Takeaways
- Middle East & Africa Market Analysis and Forecast, By Country
- Historical Market Size Value (USD Billion) & Volume (Unit) Trend Analysis By Market Taxonomy, 2021 to 2025
- Market Size Value (USD Billion) & Volume (Unit) Forecast By Market Taxonomy, 2026 to 2036
- By Country
- Kingdom of Saudi Arabia
- Other GCC Countries
- Türkiye
- South Africa
- Other African Union
- Rest of Middle East & Africa
- By Product
- By Material
- By Vehicle Type
- By Sales Channel
- By Replacement Type
- By Country
- Market Attractiveness Analysis
- By Country
- By Product
- By Material
- By Vehicle Type
- By Sales Channel
- By Replacement Type
- Key Takeaways
- Key Countries Market Analysis
- USA
- Pricing Analysis
- Market Share Analysis, 2025
- By Product
- By Material
- By Vehicle Type
- By Sales Channel
- By Replacement Type
- Canada
- Pricing Analysis
- Market Share Analysis, 2025
- By Product
- By Material
- By Vehicle Type
- By Sales Channel
- By Replacement Type
- Mexico
- Pricing Analysis
- Market Share Analysis, 2025
- By Product
- By Material
- By Vehicle Type
- By Sales Channel
- By Replacement Type
- Brazil
- Pricing Analysis
- Market Share Analysis, 2025
- By Product
- By Material
- By Vehicle Type
- By Sales Channel
- By Replacement Type
- Chile
- Pricing Analysis
- Market Share Analysis, 2025
- By Product
- By Material
- By Vehicle Type
- By Sales Channel
- By Replacement Type
- Germany
- Pricing Analysis
- Market Share Analysis, 2025
- By Product
- By Material
- By Vehicle Type
- By Sales Channel
- By Replacement Type
- UK
- Pricing Analysis
- Market Share Analysis, 2025
- By Product
- By Material
- By Vehicle Type
- By Sales Channel
- By Replacement Type
- Italy
- Pricing Analysis
- Market Share Analysis, 2025
- By Product
- By Material
- By Vehicle Type
- By Sales Channel
- By Replacement Type
- Spain
- Pricing Analysis
- Market Share Analysis, 2025
- By Product
- By Material
- By Vehicle Type
- By Sales Channel
- By Replacement Type
- France
- Pricing Analysis
- Market Share Analysis, 2025
- By Product
- By Material
- By Vehicle Type
- By Sales Channel
- By Replacement Type
- India
- Pricing Analysis
- Market Share Analysis, 2025
- By Product
- By Material
- By Vehicle Type
- By Sales Channel
- By Replacement Type
- ASEAN
- Pricing Analysis
- Market Share Analysis, 2025
- By Product
- By Material
- By Vehicle Type
- By Sales Channel
- By Replacement Type
- Australia & New Zealand
- Pricing Analysis
- Market Share Analysis, 2025
- By Product
- By Material
- By Vehicle Type
- By Sales Channel
- By Replacement Type
- China
- Pricing Analysis
- Market Share Analysis, 2025
- By Product
- By Material
- By Vehicle Type
- By Sales Channel
- By Replacement Type
- Japan
- Pricing Analysis
- Market Share Analysis, 2025
- By Product
- By Material
- By Vehicle Type
- By Sales Channel
- By Replacement Type
- South Korea
- Pricing Analysis
- Market Share Analysis, 2025
- By Product
- By Material
- By Vehicle Type
- By Sales Channel
- By Replacement Type
- Russia
- Pricing Analysis
- Market Share Analysis, 2025
- By Product
- By Material
- By Vehicle Type
- By Sales Channel
- By Replacement Type
- Poland
- Pricing Analysis
- Market Share Analysis, 2025
- By Product
- By Material
- By Vehicle Type
- By Sales Channel
- By Replacement Type
- Hungary
- Pricing Analysis
- Market Share Analysis, 2025
- By Product
- By Material
- By Vehicle Type
- By Sales Channel
- By Replacement Type
- Kingdom of Saudi Arabia
- Pricing Analysis
- Market Share Analysis, 2025
- By Product
- By Material
- By Vehicle Type
- By Sales Channel
- By Replacement Type
- Türkiye
- Pricing Analysis
- Market Share Analysis, 2025
- By Product
- By Material
- By Vehicle Type
- By Sales Channel
- By Replacement Type
- South Africa
- Pricing Analysis
- Market Share Analysis, 2025
- By Product
- By Material
- By Vehicle Type
- By Sales Channel
- By Replacement Type
- USA
- Market Structure Analysis
- Competition Dashboard
- Competition Benchmarking
- Market Share Analysis of Top Players
- By Regional
- By Product
- By Material
- By Vehicle Type
- By Sales Channel
- By Replacement Type
- Emerging Startups
- Innovation Benchmarking
- Competition Analysis
- Competition Deep Dive
- ZF Friedrichshafen AG
- Overview
- Product Portfolio
- Profitability by Market Segments (Product/Region/Sales Channel)
- Sales Footprint
- Strategy Overview
- Marketing Strategy
- Product Strategy
- Channel Strategy
- Tenneco Inc.
- Continental AG
- Vibracoustic SE
- Sumitomo Riko Company Limited
- Mevotech LP
- Dorman Products Inc.
- Delphi, a PHINIA Inc. brand
- Ferdinand Bilstein GmbH + Co. KG
- ZF Friedrichshafen AG
- Case Studies
- Success Stories
- Recent Developments
- Competition Deep Dive
- Assumptions & Acronyms Used


