

- Market Size (2026)
- USD 3.8 Bn
- Forecast (2036)
- USD 6.0 Bn
- CAGR (2026 to 2036)
- 4.7%
Chassis Corrosion Inspection and Repair Services Market Size, Market Forecast and Outlook By FMI
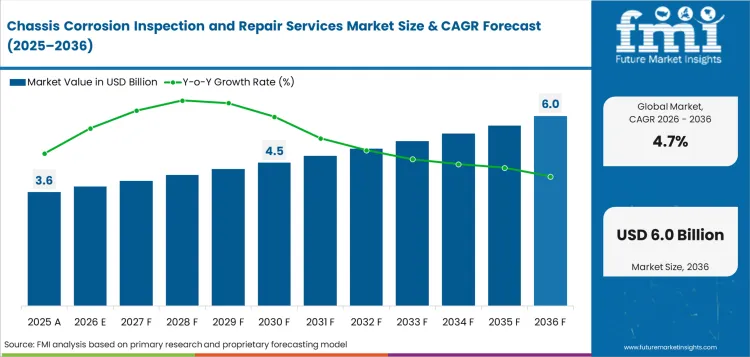
The chassis corrosion inspection and repair services market was valued at USD 3.6 billion in 2025. Industry revenue is expected to cross USD 3.8 billion in 2026 and scale to USD 6.0 billion by 2036 at 4.7% CAGR. Passenger cars are projected to represent 58.0% share of vehicle type in 2026. By end user, private owners are forecast to account for 52.0% share in 2026.
Summary of Chassis Corrosion Inspection and Repair Services Market
- Demand and Growth Drivers
- Winter road-salt exposure keeps inspection demand active in northern and coastal vehicle fleets.
- Used-car transfers are raising demand for underbody checks before resale and financing decisions.
- Fleet operators need faster corrosion decisions before chassis rust becomes downtime or safety risk.
- Product and Segment View
- Passenger cars are projected to account for 58.0% share in 2026, influenced by private vehicle checks driving service volume.
- Private owners are forecast to capture 52.0% share in 2026 since ownership periods are getting longer in established markets.
- Surface corrosion is expected to hold 46.0% share in 2026 as early inspection often prevents frame repair.
- Geography and Competitive Outlook
- India demand is forecast to record 6.4% CAGR by 2036, driven by inspection stations and scrapping facilities formalizing vehicle checks.
- China demand is likely to expand at 5.8% CAGR by 2036 due to vehicle ownership scale raising underbody service needs.
- DEKRA SE, TÜV SÜD AG and Boyd Group Services Inc. anchor competition based on inspection reach and repair location density.
- Analyst Opinion
- Nikhil Kaitwade, Principal Consultant for Industrial Automation at FMI, observes, “Chassis corrosion service has evolved into a proof-driven business. Vehicle owners and fleet operators now demand to see the extent of damage and a clear pass-or-repair verdict. Workshops that are likely to dominate are those combining high-quality inspection imaging with genuine underbody repair expertise.”
- Chassis Corrosion Inspection and Repair Services Market Value Analysis
- Market value in the chassis corrosion inspection and repair services sector is tied to underbody checks and rust removal work.
- Supplier pricing reflects lift time and technician skill before owners approve chassis repair or coating work.
- Revenue rises above basic vehicle service value as inspection images justify underbody coating and structural repair labor.
- Independent garages and fleet workshops promote premium demand for bundled checks combining corrosion grading with repair proof.
Key Takeaways, Market Size, and Forecast
- Chassis corrosion inspection and repair services market size stood at USD 3.6 billion in 2025.
- Industry value is projected to reach USD 6.0 billion by 2036 as older vehicles and road-salt exposure increase underbody repair work.
- From 2026 to 2036, the sector is projected to expand at 4.7% CAGR.
- Industry revenue is forecast to create incremental opportunity of USD 2.2 billion from 2026 to 2036.
- Passenger cars are expected to account for 58.0% share of vehicle type in 2026.
- Private owners are expected to represent 52.0% share of end user in 2026.
- India records the stronger country pace at 6.4% CAGR, followed by China at 5.8% CAGR by 2036.
Hidden underbody damage generates a pricing problem since owners need proof before approving repair work. General Motors showed how EV chassis inspection is changing in March 2025. Its Blazer EV service update required dealers to check rear chassis harness connectors for corrosion and assigned 0.6 labor hours for inspection only. That gives workshops a clearer service path for EV underbody diagnosis. Structural repair work needs stronger documentation as safety rules tighten.
New Zealand Transport Agency Waka Kotahi amended Vehicle structure 3-1: Structure in March 2025 and made certain chassis cross-member repairs from 1 January 2025 subject to heavy vehicle specialist certification. Such shifts chassis rust repair toward recorded assessment before work is accepted. Coating service has its own control need. DINITROL’s April 2025 product overview lists DINITROL 3641 A-LV for closed sections and chassis. Shops handling coating repair need spray-bay controls and trained staff before higher volumes are added.
Chassis Corrosion Inspection and Repair Services Market Definition
Chassis corrosion inspection and repair services cover paid checks and repair work on vehicle underbodies. Scope includes visual inspection and lift-based review. Probe checks and rust removal are included. Coating repair and structural metal repair are counted. Frame rails and crossmembers are included. Floor pans and suspension mounting areas are included. General car washing and cosmetic paint repair are excluded unless linked to underbody rust service.
Chassis Corrosion Inspection and Repair Services Market Inclusions
Scope includes inspection reports, underbody cleaning and rust conversion. Coating rework and welding around chassis members are counted. Service value includes labor and inspection documentation. Passenger cars and commercial vehicles are counted. Authorized car service center activity is included only if the paid work is tied to chassis corrosion. ASEAN automotive aftermarket patterns are relevant in paid workshop channels handling underbody rust.
Chassis Corrosion Inspection and Repair Services Market Exclusions
Scope excludes new vehicle anti-corrosion coating at the factory. Standard collision paint and tire service are excluded. Brake repair is excluded unless a chassis corrosion finding triggers the work. Vehicle scrapping revenue is excluded. Product-only sales of waxes, sprays and rust converters are excluded unless sold as part of a service invoice.
Chassis Corrosion Inspection and Repair Services Market Research Methodology
- Primary Research: FMI analysts reviewed service needs across independent garages and inspection firms. Body shops and fleet workshops were included in interview checks.
- Desk Research: Government vehicle data and inspection rules supported demand checks. Road-salt statistics and company disclosures supported supplier mapping.
- Market Sizing and Forecasting: Forecast values used service ticket estimates, vehicle parc exposure and repair channel splits.
- Data Validation: Checks compared 2026 value with 2036 value and tested CAGR consistency across seven country rates.
Why is the Chassis Corrosion Inspection and Repair Services Market Growing?
- Older vehicles keep underbody rust checks relevant as chassis joints and coated metal areas age during longer ownership periods.
- Roadworthiness testing is making corrosion evidence more important before owners approve repair or resale preparation work.
- Fleet workshops are shifting rust checks into planned service visits to reduce downtime from late-stage chassis damage.
Forward outlook is supported by longer vehicle life and stricter inspection proof at service sites. European Automobile Manufacturers’ Association reported in January 2025 that EU cars averaged 12.5 years and EU trucks averaged 14.1 years in its Vehicles on European Roads 2025 report. Older fleets give repair shops a wider pool of vehicles that need underbody checks before resale or yearly testing.
The United Kingdom’s Driver and Vehicle Standards Agency listed corrosion as a required MOT tester training topic for April 2024 to March 2025 and required training records to be stored on the MOT testing service from 1 April 2024. S&P Global Mobility reported in May 2025, the average age of vehicles in the United States reached 12.8 years in 2025. Passenger cars averaged 14.5 years, while light trucks averaged 11.9 years. Older vehicles give repair shops a larger service pool for underbody inspection and coating review.
Market Segmentation Analysis
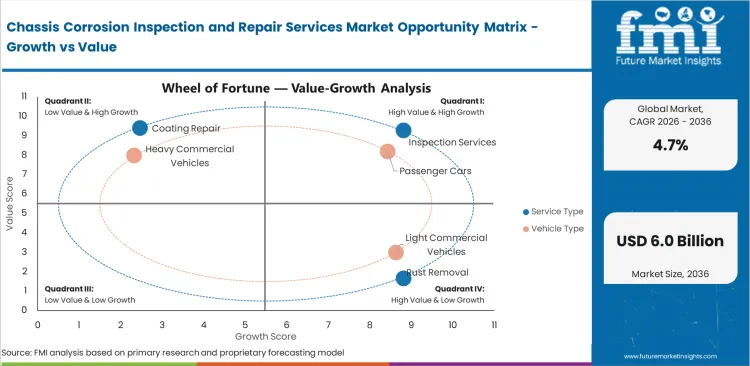
- Inspection services are expected to account for 34.0% share in 2026 led by shops using checks to open repair decisions.
- Passenger cars are forecast to capture 58.0% share in 2026 since personal vehicles create the widest service pool.
- Surface corrosion is expected to represent 46.0% share in 2026 due to early rust correction being cheaper than metal work.
- Independent garages are projected to hold 48.0% share in 2026, influenced by local shops handling price-sensitive underbody work.
- Private owners are forecast to account for 52.0% share in 2026 through used-car ownership and longer holding periods.
Segmentation is divided into five parent groups built around how service buyers describe chassis corrosion work. Service type separates inspection from repair steps. Vehicle type shows the fleet group paying for service. Corrosion severity measures the depth of work. Service channel shows who delivers the repair. End user explains who approves the invoice and values the proof.
Insights into Chassis Corrosion Inspection and Repair Services Market by Service Type
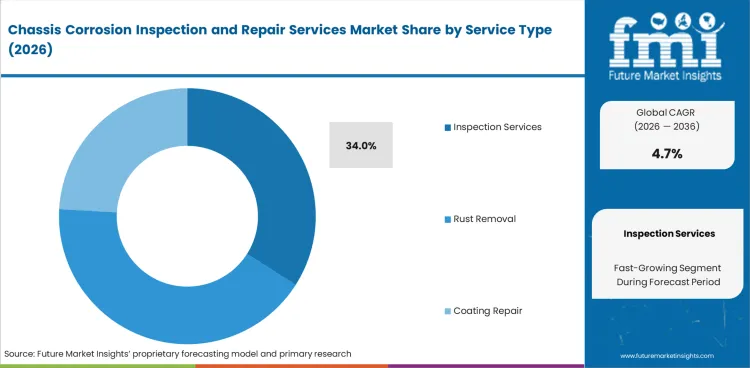
- Inspection services are projected to account for 34.0% share in 2026 due to many service tickets beginning with lift inspection before rust removal.
- Rust removal gains value as surface scaling must be cleared before coatings or sealants can adhere properly.
Insights into Chassis Corrosion Inspection and Repair Services Market by Vehicle Type
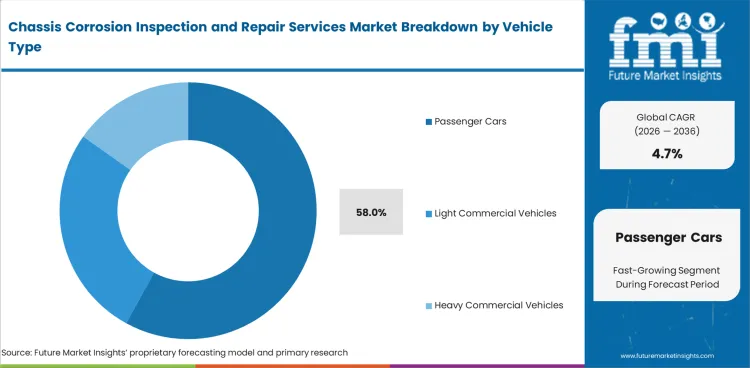
- Passenger cars are forecast to represent 58.0% share in 2026, driven by private vehicles facing winter salt and longer ownership.
- Light commercial vehicles need corrosion checks around load-bearing underbody points as stop-start duty raises exposure.
Insights into Chassis Corrosion Inspection and Repair Services Market by Corrosion Severity
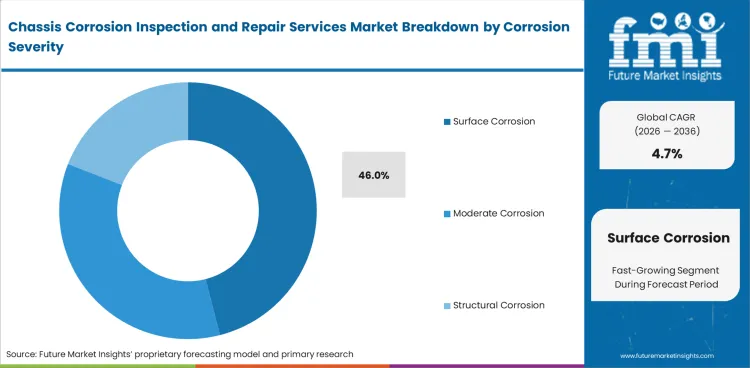
- Surface corrosion is expected to hold 46.0% share in 2026, led by early rust appearing before owners see a safety problem.
- Moderate corrosion requires deeper grinding and coating checks, so ticket size rises after inspection confirms hidden spread.
Insights into Chassis Corrosion Inspection and Repair Services Market by Service Channel
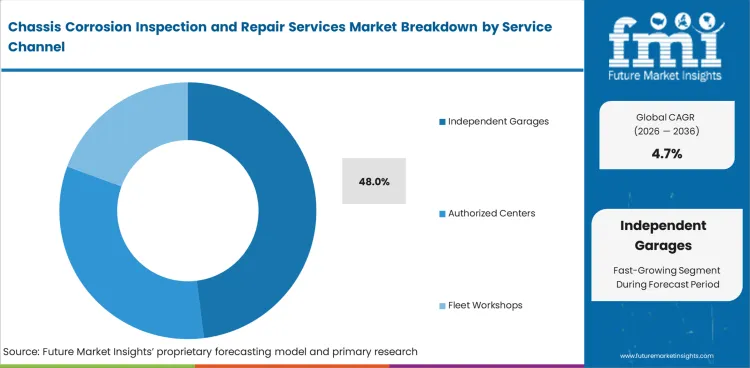
- Independent garages are projected to account for 48.0% share in 2026 since local workshops often handle rust issues after warranties end.
- Authorized centers remain relevant for newer vehicles and owner-paid inspections tied to warranty review.
Insights into Chassis Corrosion Inspection and Repair Services Market by End User
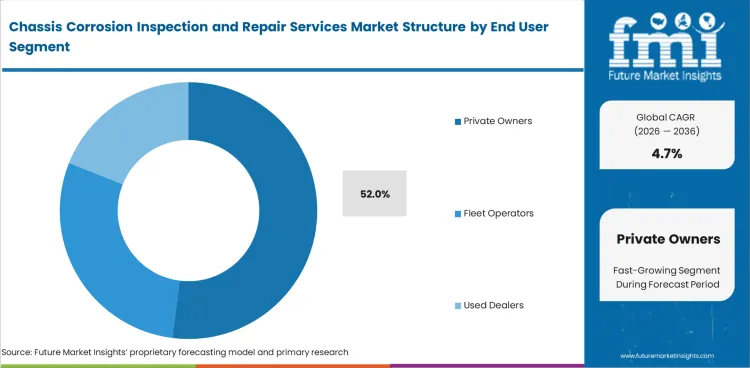
- Private owners are forecast to account for 52.0% share in 2026 as longer vehicle retention keeps chassis condition visible.
- Fleet operators prioritize planned chassis checks for vans and trucks that run in winter road-salt regions.
Chassis Corrosion Inspection and Repair Services Market Drivers, Restraints and Opportunities
- Road-salt exposure keeps underbody inspection work active in winter road markets.
- Labor-heavy structural repair limits approval when vehicle value cannot support the repair bill.
- Image-based inspection records give service centers a clearer way to convert findings into paid work.
Growth outlook is strongest in workshops connecting labor cost and inspection proof in one service path. The repair side faces a labor limit as the United States Bureau of Labor Statistics stated in September 2025, automotive body and related repairers inspect frames and repair chassis with median annual pay at USD 51,680. High labor content makes owners more selective on structural rust jobs when repair value is hard to justify. Underbody image proof creates the cleanest opening for service conversion. UVeye stated in November 2025, its systems process over 700.0 million vehicle images each month across over 600 dealerships, including high-resolution underbody images. Repair shops pairing clear images with rust grading can move owners from concern to approval faster.
Technology Adoption and Automation Penetration Analysis
Technology use in this market is strongest when inspection proof shortens repair approval. UVeye stated in November 2025, its systems process more than 700.0 million vehicle images each month across more than 600 dealerships. High-resolution underbody images make high-resolution underbody images make service-lane inspection more important than broad factory automation for chassis corrosion services. Workshops using underside imaging and structured defect records can show rust areas clearly before quoting coating or chassis repair. Practical growth path is aligned to service-lane scanning and repair documentation.
Application-wise Equipment Deployment Analysis
Equipment use in this market is centered on service bays and collision repair shops. General Motors stated in March 2025 that certain 2024 to 2025 Chevrolet Blazer EV vehicles require rear chassis harness inspection and connector corrosion checks. The bulletin assigns 0.6 labor hours for inspection only. This reflects chassis corrosion work being extending into EV underbody service as well as conventional frame repair. Equipment demand is expected to favor underbody lighting and coating application systems.
Analysis of Chassis Corrosion Inspection and Repair Services Market by Key Countries
.webp "Top Country Growth Comparison Chassis Corrosion Inspection And Repair Services Market Cagr (2026 2036)")
| Country | CAGR |
|---|---|
| India | 6.4% |
| China | 5.8% |
| United States | 5.2% |
| Canada | 4.9% |
| Germany | 4.5% |
| United Kingdom | 4.2% |
| Australia | 3.9% |
Source: Future Market Insights, 2026.
Chassis Corrosion Inspection and Repair Services Market CAGR Analysis by Country
- India is projected to record 6.4% CAGR by 2036, driven by fitness testing and scrapping infrastructure widening vehicle checks.
- China is expected to expand at 5.8% CAGR by 2036, led by vehicle ownership scale raising chassis service volume.
- United States is forecast to grow at 5.2% CAGR by 2036 through winter corrosion exposure and aging light vehicles.
- Canada is expected to advance at 4.9% CAGR by 2036 due to salt-heavy road conditions favoring underbody protection.
- Germany is projected to rise at 4.5% CAGR by 2036, reflected by a large vehicle parc and strict roadworthiness culture.
- United Kingdom is forecast at 4.2% CAGR by 2036 as MOT checks keep structural corrosion visible.
- Australia is expected to post 3.9% CAGR by 2036 with coastal exposure and regional fleet repair needs.
Country performance differs by climate exposure and inspection rules. Fleet age shapes the repair timing. India and China track above the regional service outlook rate since service formalization and vehicle scale add new paid checks. United States and Canada hold a winter-salt premium. Germany, United Kingdom and Australia expand at measured rates through established service networks.
Demand Outlook for Chassis Corrosion Inspection and Repair Services in India
Demand in India is projected to record 6.4% CAGR by 2036, driven by testing stations and scrappage facilities adding formal checkpoints. Press Information Bureau reported in December 2025, India operated 160 Automated Testing Stations and 123 Registered Vehicle Scrapping Facilities. Such infrastructure brings more older vehicles into documented inspection paths. Chassis corrosion service providers can gain from repair referrals before vehicles enter scrappage decisions.
- Fitness checks make underbody condition more visible to vehicle owners and fleet managers.
- Regional workshops can pair rust inspection with welding and coating repair near testing centers.
- Commercial fleets will prefer clear pass or repair decisions before renewal of vehicle fitness papers.
Demand Analysis of Chassis Corrosion Inspection and Repair Services in China
Industry in China is expected to expand at 5.8% CAGR by 2036, reflected by vehicle scale generating a wide service opportunity. Ministry-led automotive planning in September 2025 targeted 32.3 million vehicle sales for 2025. New vehicles will need less immediate rust repair. Larger service effect comes later as ownership cohorts age into underbody inspection and used-car preparation.
- Independent service chains can build corrosion packages around used-car resale checks.
- Urban inspection flows favor fast visual proof and standardized repair documentation.
- Coastal and northern road exposure raises the need for localized corrosion service offers.
Growth Outlook for Chassis Corrosion Inspection and Repair Services in the United States
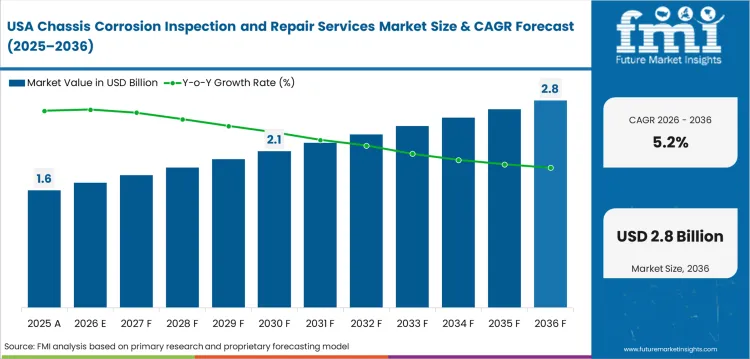
The market in United States is forecast to grow at 5.2% CAGR by 2036 due to road salt and older light vehicles keeping underbody checks relevant. United States Geological Survey stated in January 2026, highway deicing accounted for about 37.0% of salt consumed in 2025. Salt exposure creates repeat need for cleaning and coating review. Service centers can turn seasonal inspection visits into repair orders before rust reaches frame areas.
- Winter-state garages gain repeat service work from underbody cleaning and coating checks.
- Used-vehicle inspections raise owner interest in frame rail and floor-pan condition.
- Fleet operators need planned rust checks for vans working in wet and salted corridors.
Sales Analysis of Chassis Corrosion Inspection and Repair Services in Canada
Sales in Canada are expected to advance at 4.9% CAGR by 2036 as winter exposure and long-distance driving support rust prevention. Statistics Canada reported in June 2025, Canadians registered 426,872 new motor vehicles in the first quarter of 2025. New registrations add future service stock while older vehicles keep current work active. Workshops with coating repair and annual inspection packages should keep repeat owner contact.
- Rust-control chains benefit from owner awareness of salt damage in winter provinces.
- Inspection reports give used-car buyers clearer evidence before price negotiation.
- Fleet workshops favor underbody service schedules before corrosion affects vehicle downtime.
Industry Outlook for Chassis Corrosion Inspection and Repair Services in Germany
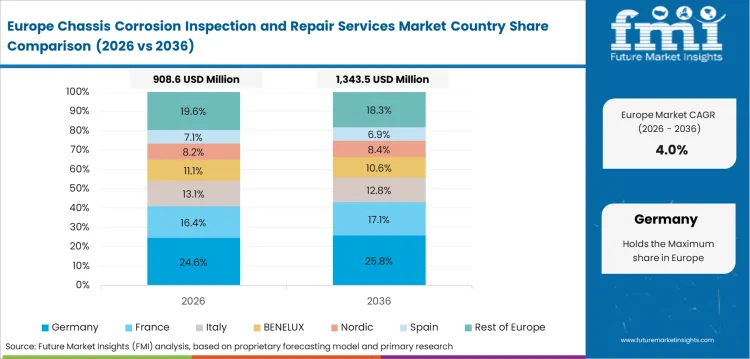
Sector in Germany is projected to rise at 4.5% CAGR by 2036 through established inspection culture and a large car parc. Eurostat reported in January 2026 that Germany had more than 49.0 million registered passenger cars in 2024. A large vehicle pool keeps corrosion service relevant even with newer vehicle protection systems. Service buyers will value shops that combine roadworthiness awareness with precise repair evidence.
- Periodic inspection culture supports early chassis findings before owner resale decisions.
- Body shops can convert underbody findings into coating and panel repair tickets.
- EV underbody layouts create fresh inspection needs around battery trays and mounting points.
Sales Outlook for Chassis Corrosion Inspection and Repair Services in the United Kingdom
Sales in the United Kingdom is forecast at 4.2% CAGR by 2036 since MOT culture keeps underbody defects visible. Department for Transport reported in April 2026 that licensed vehicles reached 42.3 million at the end of 2025. Vehicle scale and annual testing give garages steady entry points for inspection-led repair. Chassis corrosion providers need clear reports that show whether work is advisory or safety-related.
- MOT preparation work directs owners toward structural rust checks before test failure.
- Independent garages gain rust work from older cars no longer tied to dealer servicing.
- Used-car sellers value underbody evidence that reduces post-sale disputes.
Demand Outlook for Chassis Corrosion Inspection and Repair Services in Australia
Demand in Australia is expected to post 3.9% CAGR by 2036 with coastal exposure and regional fleet service needs. Bureau of Infrastructure and Transport Research Economics reported 21.9 million registered vehicles for road use in January 2025. Coastal driving and off-road use create corrosion exposure outside winter-salt markets. Service providers can position inspection as a resale and fleet reliability tool.
- Coastal workshops can market underbody checks around beach driving and marine air exposure.
- Regional fleets need chassis inspection after gravel-road and water-crossing operation.
- Independent garages can bundle rust review with routine service for older four-wheel drives.
Competitive Landscape and Strategic Positioning
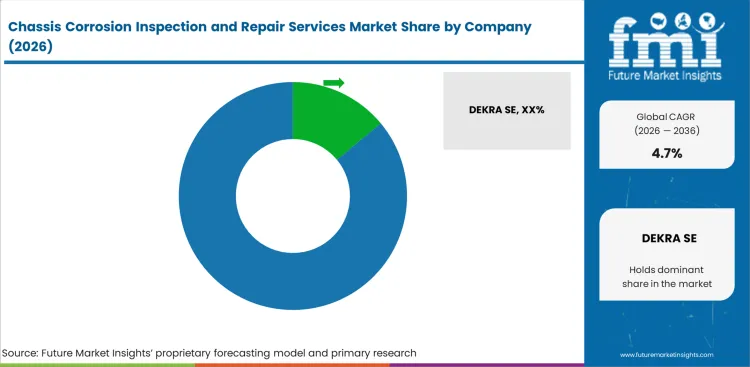
- Inspection specialists hold advantage as regulated checks create trusted underbody evidence.
- Collision repair networks compete by handling rust findings that require structural metal work.
- Rust-protection chains gain repeat visits by selling yearly coating reviews and local inspection records.
Competition is split across inspection firms and repair networks. DEKRA SE and TÜV SÜD AG compete through inspection credibility. Boyd Group Services Inc. and Driven Brands Holdings Inc. give repair networks scale across collision work. DINITROL and Ziebart serve the prevention side through specialized underbody treatments.
Supplier choice depends on proof quality and local repair reach. Owners want a clear answer before they approve grinding or coating. Fleets want consistent inspection categories across many vehicles. Smaller shops can hold local share through faster scheduling and cleaner visual documentation. Larger groups can gain from insurer ties and multi-site coverage.
Key Companies in the Chassis Corrosion Inspection and Repair Services Market
Competitive structure is better understood by inspection providers, repair networks and corrosion protection specialists.
- Inspection Providers: DEKRA SE and TÜV SÜD AG support vehicle inspection services. TÜV Rheinland AG and SGS SA support testing services.
- Repair Networks: Boyd Group Services Inc. and Driven Brands Holdings Inc. support collision repair scale. Fix Network supports body repair coverage.
- Corrosion Specialists: Ziebart International Corporation and Krown Rust Control support underbody protection work. Rust Check and DINITROL cover specialist corrosion prevention.
Competitive Benchmarking: Chassis Corrosion Inspection and Repair Services Market
| Company | Inspection Proof Depth | Underbody Repair Fit | Service Network | Geographic Footprint |
|---|---|---|---|---|
| DEKRA SE | High | Medium | Strong | Global |
| TÜV SÜD AG | High | Medium | Strong | Global |
| TÜV Rheinland AG | High | Medium | Strong | Global |
| SGS SA | Medium | Medium | Strong | Global |
| Boyd Group Services Inc. | Medium | High | Strong | North America |
| Driven Brands Holdings Inc. | Medium | High | Strong | North America |
| Fix Network | Medium | High | Medium | Global |
| Ziebart International Corporation | Medium | Medium | Medium | United States and global |
| Krown Rust Control | Medium | Medium | Medium | Canada |
| DINITROL | Medium | Medium | Medium | Europe and global |
Source: Future Market Insights competitive analysis 2026. Ratings reflect relative positioning by inspection proof, corrosion service fit and repair network coverage.
Key Developments in Chassis Corrosion Inspection and Repair Services Market
- In April 2025, DINITROL released a product overview detailing DINITROL 3641 A-LV for closed sections and chassis underbodies.
- In October 2025, Boyd Group Services Inc. announced the acquisition of Joe Hudson’s Collision Center, adding 258 collision repair locations.
- In April 2026, DEKRA reported about 34.0 million vehicle inspections per year and revenue of EUR 4.4 billion for 2025.
Key Players in the Chassis Corrosion Inspection and Repair Services Market
Major Global Players:
- DEKRA SE
- TÜV SÜD AG
- TÜV Rheinland AG
- SGS SA
- Boyd Group Services Inc.
- Driven Brands Holdings Inc.
- Fix Network
Specialist and Regional Players:
- Ziebart International Corporation
- Krown Rust Control
- Rust Check
- DINITROL
Market Report Scope
| Parameter | Details |
|---|---|
| Quantitative units | USD 3.8 billion to USD 6.0 billion, at 4.7% CAGR |
| Market definition | Paid chassis corrosion inspection, rust removal, coating repair and structural underbody repair services |
| Service type | Inspection services, rust removal, coating repair, structural repair, underbody protection |
| Vehicle type | Passenger cars, light commercial vehicles, heavy commercial vehicles, off road vehicles |
| Corrosion severity | Surface corrosion, moderate corrosion, structural corrosion |
| Service channel | Independent garages, authorized centers, fleet workshops, mobile services |
| End user | Private owners, fleet operators, used dealers, insurers |
| Regions covered | North America, Europe, East Asia, South Asia and Pacific, Latin America, Middle East and Africa |
| Countries covered | India, China, United States, Canada, Germany, United Kingdom, Australia |
| Key companies profiled | DEKRA SE, TÜV SÜD AG, TÜV Rheinland AG, SGS SA, Boyd Group Services Inc., Driven Brands Holdings Inc., Fix Network, Ziebart International Corporation, Krown Rust Control, Rust Check, DINITROL |
| Forecast period | 2026 to 2036 |
| Approach | Hybrid top-down and bottom-up model with service-ticket, vehicle-parc and climate exposure checks |
Source: Future Market Insights, 2026.
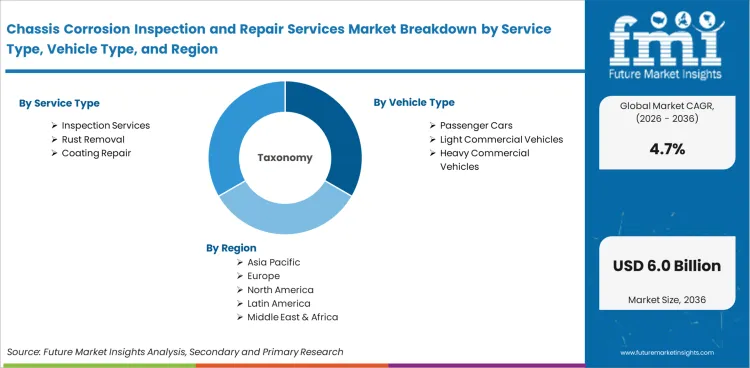
Chassis Corrosion Inspection and Repair Services Market Breakdown by Service Type, Vehicle Type, Corrosion Severity, Service Channel, End User, and Region
By Service Type:
- Inspection Services
- Rust Removal
- Coating Repair
- Structural Repair
- Underbody Protection
By Vehicle Type:
- Passenger Cars
- Light Commercial Vehicles
- Heavy Commercial Vehicles
- Off Road Vehicles
By Corrosion Severity:
- Surface Corrosion
- Moderate Corrosion
- Structural Corrosion
By Service Channel:
- Independent Garages
- Authorized Centers
- Fleet Workshops
- Mobile Services
By End User:
- Private Owners
- Fleet Operators
- Used Dealers
- Insurers
By Region:
- North America
- United States
- Canada
- Europe
- Germany
- United Kingdom
- East Asia
- China
- South Asia and Pacific
- India
- Oceania
- Australia
- Latin America
- Middle East and Africa
Research Sources and Bibliography
- General Motors. (2025, March 10). N242468490: Service update: Missing chassis harness plugs. National Highway Traffic Safety Administration.
- New Zealand Transport Agency Waka Kotahi. (2026, May 26). Vehicle structure 3-1: Structure.
- European Automobile Manufacturers’ Association. (2025, January 29). Report: Vehicles on European roads 2025.
- Driver and Vehicle Standards Agency. (2026, April 1). Car and passenger vehicles: MOT tester annual training topics from May 2021 to March 2026. GOV.UK.
- U.S. Bureau of Labor Statistics. (2025, August 28). Automotive body and glass repairers. Occupational Outlook Handbook.
- UVeye. (2025, November 18). UVeye wins “Best in Automotive AI” at the Modern Retailing Conference 2025.
- DEKRA SE. (2026, April 17). DEKRA continues its growth trajectory amid challenging market conditions.
- DINITROL. (2025, April). Product overview 2024/2025.
- Boyd Group Services Inc. (2025, October 29). Boyd Group Services Inc. to acquire Joe Hudson’s Collision Center.
- Driven Brands Holdings Inc. (2025, February 25). Driven Brands Holdings Inc. reports fourth quarter and fiscal year 2024 results.
Bibliography uses current government, official organization and company sources. Bibliography uses external public sources and company disclosures.
This Report Answers
- What is the expected value of chassis corrosion inspection and repair services market by 2036?
- What CAGR is forecast for chassis corrosion inspection and repair services market from 2026 to 2036?
- Which vehicle type is projected to account for a leading share in 2026?
- Which end user is expected to hold a strong share of demand?
- How do road-salt exposure and older vehicles affect service selection?
- Which countries are forecast to record stronger growth by 2036?
- Which companies compete in chassis corrosion inspection and repair services market?
- How do inspection records and repair networks affect market value?
- What methodology supports the chassis corrosion inspection and repair services market forecast?
Frequently Asked Questions
What is the chassis corrosion inspection and repair services market value in 2026?
The chassis corrosion inspection and repair services market size is estimated at USD 3.8 billion in 2026 as inspection-led repair work expands.
What is the expected value of chassis corrosion inspection and repair services market by 2036?
Industry revenue is forecast to reach USD 6.0 billion by 2036, led by road-salt exposure and longer vehicle ownership.
What CAGR is expected for chassis corrosion inspection and repair services market?
The sector is poised to expand at 4.7% CAGR from 2026 to 2036 with inspection and repair conversion support.
Which vehicle type holds a strong share in chassis corrosion inspection and repair services market?
Passenger cars are expected to account for 58.0% share in 2026 as private vehicles creates the broadest service pool.
Which end user is prominent in chassis corrosion inspection and repair services market?
Private owners are forecast to represent 52.0% share in 2026 since used-car checks and longer ownership raise underbody repair decisions.
Which country grows faster in chassis corrosion inspection and repair services market?
India is projected to record 6.4% CAGR by 2036 as testing stations and scrapping facilities widen vehicle checks.
What services are included in chassis corrosion inspection and repair services market?
Included services cover underbody inspection and rust removal. Coating repair and structural chassis repair are delivered through paid workshop service.
How is chassis corrosion inspection and repair services market forecast prepared?
Forecasting uses service-ticket value, vehicle parc exposure and climate risk checks. Country rates refine the country-level demand outlook.
Why do chassis corrosion services need inspection records?
Inspection records show owners the exact rust area, so workshops can justify repair scope before labor starts.
Do chassis corrosion inspection and repair services support fleet operators?
Fleet operators use chassis corrosion checks to reduce downtime and plan repairs before vehicles fail roadworthiness or safety reviews.
Who uses chassis corrosion inspection and repair services?
Private owners and fleet operators use these services for safety. Used-vehicle dealers and insurers use them for resale value and repair planning.
Are chassis corrosion inspection and repair services tied to road salt?
Road salt is a key demand factor as deicing exposure raises underbody rust risk in winter road markets.
Preview the report firsthand - request a free sample
Get SampleGet the brochure for pricing and purchase details.
Get PDFTable of Content
- Key Takeaways
- Market Size and CAGR
- Top Growth Driver
- Fastest Growing Segment
- Leading Region
- Key Companies
- Emerging Opportunities
- Executive Summary
- Global Market Outlook
- Demand-side Trends
- Supply-side Trends
- Technology Roadmap Analysis
- Analysis and Recommendations
- Analyst Perspective (What is happening? Why now? What should investors know?)
- Key Questions Answered
- How large is the market?
- What is the CAGR?
- What are key trends?
- Which region dominates?
- Who are the leaders?
- Market Overview
- Market Coverage / Taxonomy
- Market Definition / Scope / Limitations
- Research Methodology
- Chapter Orientation
- Analytical Lens and Working Hypotheses
- Market Structure, Signals, and Trend Drivers
- Benchmarking and Cross-market Comparability
- Market Sizing, Forecasting, and Opportunity Mapping
- Research Design and Evidence Framework
- Desk Research Programme (Secondary Evidence)
- Expert Input and Fieldwork (Primary Evidence)
- Tooling, Models, and Reference Databases
- Data Engineering and Model Build
- Quality Assurance and Audit Trail
- Market Background
- Market Dynamics (Drivers, Restraints, Opportunity, Trends)
- Scenario Forecast (Optimistic, Likely, Conservative)
- Impact Analysis
- AI Impact
- Sustainability Impact
- Regulatory Impact
- Technology Impact
- Consumer / Buyer Analysis
- Purchase Drivers
- Adoption Barriers
- Buyer Journey
- Opportunity Map Analysis
- Product Life Cycle Analysis
- Supply Chain Analysis
- Investment Feasibility Matrix
- Value Chain Analysis
- PESTLE and Porter's Analysis
- Regulatory Landscape
- Regional Parent Market Outlook
- Production and Consumption Statistics
- Import and Export Statistics
- Global Market Analysis and Forecast, 2021 to 2036
- Historical Market Size Value (USD Billion) & Volume (Unit) Analysis, 2021 to 2025
- Current and Future Market Size Value (USD Billion) & Volume (Unit) Projections, 2026 to 2036
- Y-o-Y Growth Trend Analysis
- Absolute $ Opportunity Analysis
- Global Market Pricing Analysis, 2021 to 2036
- Global Market Analysis and Forecast, By Service Type, 2021 to 2036
- Introduction / Key Findings
- Historical Market Size Value (USD Billion) & Volume (Unit) Analysis By Service Type, 2021 to 2025
- Current and Future Market Size Value (USD Billion) & Volume (Unit) Analysis and Forecast By Service Type, 2026 to 2036
- Inspection Services
- Rust Removal
- Coating Repair
- Structural Repair
- Underbody Protection
- Inspection Services
- Y-o-Y Growth Trend Analysis By Service Type, 2021 to 2025
- Absolute $ Opportunity Analysis By Service Type, 2026 to 2036
- Global Market Analysis and Forecast, By Vehicle Type, 2021 to 2036
- Introduction / Key Findings
- Historical Market Size Value (USD Billion) & Volume (Unit) Analysis By Vehicle Type, 2021 to 2025
- Current and Future Market Size Value (USD Billion) & Volume (Unit) Analysis and Forecast By Vehicle Type, 2026 to 2036
- Passenger Cars
- Light Commercial Vehicles
- Heavy Commercial Vehicles
- Off Road Vehicles
- Passenger Cars
- Y-o-Y Growth Trend Analysis By Vehicle Type, 2021 to 2025
- Absolute $ Opportunity Analysis By Vehicle Type, 2026 to 2036
- Global Market Analysis and Forecast, By Corrosion Severity, 2021 to 2036
- Introduction / Key Findings
- Historical Market Size Value (USD Billion) & Volume (Unit) Analysis By Corrosion Severity, 2021 to 2025
- Current and Future Market Size Value (USD Billion) & Volume (Unit) Analysis and Forecast By Corrosion Severity, 2026 to 2036
- Surface Corrosion
- Moderate Corrosion
- Structural Corrosion
- Surface Corrosion
- Y-o-Y Growth Trend Analysis By Corrosion Severity, 2021 to 2025
- Absolute $ Opportunity Analysis By Corrosion Severity, 2026 to 2036
- Global Market Analysis and Forecast, By Service Channel, 2021 to 2036
- Introduction / Key Findings
- Historical Market Size Value (USD Billion) & Volume (Unit) Analysis By Service Channel, 2021 to 2025
- Current and Future Market Size Value (USD Billion) & Volume (Unit) Analysis and Forecast By Service Channel, 2026 to 2036
- Independent Garages
- Authorized Centers
- Fleet Workshops
- Mobile Services
- Independent Garages
- Y-o-Y Growth Trend Analysis By Service Channel, 2021 to 2025
- Absolute $ Opportunity Analysis By Service Channel, 2026 to 2036
- Global Market Analysis and Forecast, By End User, 2021 to 2036
- Introduction / Key Findings
- Historical Market Size Value (USD Billion) & Volume (Unit) Analysis By End User, 2021 to 2025
- Current and Future Market Size Value (USD Billion) & Volume (Unit) Analysis and Forecast By End User, 2026 to 2036
- Private Owners
- Fleet Operators
- Used Dealers
- Insurers
- Private Owners
- Y-o-Y Growth Trend Analysis By End User, 2021 to 2025
- Absolute $ Opportunity Analysis By End User, 2026 to 2036
- Global Market Analysis and Forecast, By Region, 2021 to 2036
- Introduction
- Historical Market Size Value (USD Billion) & Volume (Unit) Analysis By Region, 2021 to 2025
- Current Market Size Value (USD Billion) & Volume (Unit) Analysis and Forecast By Region, 2026 to 2036
- North America
- Latin America
- Western Europe
- Eastern Europe
- East Asia
- South Asia and Pacific
- Middle East & Africa
- Market Attractiveness Analysis By Region
- North America Market Analysis and Forecast, By Country, 2021 to 2036
- Historical Market Size Value (USD Billion) & Volume (Unit) Trend Analysis By Market Taxonomy, 2021 to 2025
- Market Size Value (USD Billion) & Volume (Unit) Forecast By Market Taxonomy, 2026 to 2036
- By Country
- USA
- Canada
- Mexico
- By Service Type
- By Vehicle Type
- By Corrosion Severity
- By Service Channel
- By End User
- By Country
- Market Attractiveness Analysis
- By Country
- By Service Type
- By Vehicle Type
- By Corrosion Severity
- By Service Channel
- By End User
- Key Takeaways
- Latin America Market Analysis and Forecast, By Country
- Historical Market Size Value (USD Billion) & Volume (Unit) Trend Analysis By Market Taxonomy, 2021 to 2025
- Market Size Value (USD Billion) & Volume (Unit) Forecast By Market Taxonomy, 2026 to 2036
- By Country
- Brazil
- Chile
- Rest of Latin America
- By Service Type
- By Vehicle Type
- By Corrosion Severity
- By Service Channel
- By End User
- By Country
- Market Attractiveness Analysis
- By Country
- By Service Type
- By Vehicle Type
- By Corrosion Severity
- By Service Channel
- By End User
- Key Takeaways
- Western Europe Market Analysis and Forecast, By Country
- Historical Market Size Value (USD Billion) & Volume (Unit) Trend Analysis By Market Taxonomy, 2021 to 2025
- Market Size Value (USD Billion) & Volume (Unit) Forecast By Market Taxonomy, 2026 to 2036
- By Country
- Germany
- UK
- Italy
- Spain
- France
- Nordic
- BENELUX
- Rest of Western Europe
- By Service Type
- By Vehicle Type
- By Corrosion Severity
- By Service Channel
- By End User
- By Country
- Market Attractiveness Analysis
- By Country
- By Service Type
- By Vehicle Type
- By Corrosion Severity
- By Service Channel
- By End User
- Key Takeaways
- Eastern Europe Market Analysis and Forecast, By Country
- Historical Market Size Value (USD Billion) & Volume (Unit) Trend Analysis By Market Taxonomy, 2021 to 2025
- Market Size Value (USD Billion) & Volume (Unit) Forecast By Market Taxonomy, 2026 to 2036
- By Country
- Russia
- Poland
- Hungary
- Balkan & Baltic
- Rest of Eastern Europe
- By Service Type
- By Vehicle Type
- By Corrosion Severity
- By Service Channel
- By End User
- By Country
- Market Attractiveness Analysis
- By Country
- By Service Type
- By Vehicle Type
- By Corrosion Severity
- By Service Channel
- By End User
- Key Takeaways
- East Asia Market Analysis and Forecast, By Country
- Historical Market Size Value (USD Billion) & Volume (Unit) Trend Analysis By Market Taxonomy, 2021 to 2025
- Market Size Value (USD Billion) & Volume (Unit) Forecast By Market Taxonomy, 2026 to 2036
- By Country
- China
- Japan
- South Korea
- By Service Type
- By Vehicle Type
- By Corrosion Severity
- By Service Channel
- By End User
- By Country
- Market Attractiveness Analysis
- By Country
- By Service Type
- By Vehicle Type
- By Corrosion Severity
- By Service Channel
- By End User
- Key Takeaways
- South Asia and Pacific Market Analysis and Forecast, By Country
- Historical Market Size Value (USD Billion) & Volume (Unit) Trend Analysis By Market Taxonomy, 2021 to 2025
- Market Size Value (USD Billion) & Volume (Unit) Forecast By Market Taxonomy, 2026 to 2036
- By Country
- India
- ASEAN
- Australia & New Zealand
- Rest of South Asia and Pacific
- By Service Type
- By Vehicle Type
- By Corrosion Severity
- By Service Channel
- By End User
- By Country
- Market Attractiveness Analysis
- By Country
- By Service Type
- By Vehicle Type
- By Corrosion Severity
- By Service Channel
- By End User
- Key Takeaways
- Middle East & Africa Market Analysis and Forecast, By Country
- Historical Market Size Value (USD Billion) & Volume (Unit) Trend Analysis By Market Taxonomy, 2021 to 2025
- Market Size Value (USD Billion) & Volume (Unit) Forecast By Market Taxonomy, 2026 to 2036
- By Country
- Kingdom of Saudi Arabia
- Other GCC Countries
- Türkiye
- South Africa
- Other African Union
- Rest of Middle East & Africa
- By Service Type
- By Vehicle Type
- By Corrosion Severity
- By Service Channel
- By End User
- By Country
- Market Attractiveness Analysis
- By Country
- By Service Type
- By Vehicle Type
- By Corrosion Severity
- By Service Channel
- By End User
- Key Takeaways
- Key Countries Market Analysis
- USA
- Pricing Analysis
- Market Share Analysis, 2025
- By Service Type
- By Vehicle Type
- By Corrosion Severity
- By Service Channel
- By End User
- Canada
- Pricing Analysis
- Market Share Analysis, 2025
- By Service Type
- By Vehicle Type
- By Corrosion Severity
- By Service Channel
- By End User
- Mexico
- Pricing Analysis
- Market Share Analysis, 2025
- By Service Type
- By Vehicle Type
- By Corrosion Severity
- By Service Channel
- By End User
- Brazil
- Pricing Analysis
- Market Share Analysis, 2025
- By Service Type
- By Vehicle Type
- By Corrosion Severity
- By Service Channel
- By End User
- Chile
- Pricing Analysis
- Market Share Analysis, 2025
- By Service Type
- By Vehicle Type
- By Corrosion Severity
- By Service Channel
- By End User
- Germany
- Pricing Analysis
- Market Share Analysis, 2025
- By Service Type
- By Vehicle Type
- By Corrosion Severity
- By Service Channel
- By End User
- UK
- Pricing Analysis
- Market Share Analysis, 2025
- By Service Type
- By Vehicle Type
- By Corrosion Severity
- By Service Channel
- By End User
- Italy
- Pricing Analysis
- Market Share Analysis, 2025
- By Service Type
- By Vehicle Type
- By Corrosion Severity
- By Service Channel
- By End User
- Spain
- Pricing Analysis
- Market Share Analysis, 2025
- By Service Type
- By Vehicle Type
- By Corrosion Severity
- By Service Channel
- By End User
- France
- Pricing Analysis
- Market Share Analysis, 2025
- By Service Type
- By Vehicle Type
- By Corrosion Severity
- By Service Channel
- By End User
- India
- Pricing Analysis
- Market Share Analysis, 2025
- By Service Type
- By Vehicle Type
- By Corrosion Severity
- By Service Channel
- By End User
- ASEAN
- Pricing Analysis
- Market Share Analysis, 2025
- By Service Type
- By Vehicle Type
- By Corrosion Severity
- By Service Channel
- By End User
- Australia & New Zealand
- Pricing Analysis
- Market Share Analysis, 2025
- By Service Type
- By Vehicle Type
- By Corrosion Severity
- By Service Channel
- By End User
- China
- Pricing Analysis
- Market Share Analysis, 2025
- By Service Type
- By Vehicle Type
- By Corrosion Severity
- By Service Channel
- By End User
- Japan
- Pricing Analysis
- Market Share Analysis, 2025
- By Service Type
- By Vehicle Type
- By Corrosion Severity
- By Service Channel
- By End User
- South Korea
- Pricing Analysis
- Market Share Analysis, 2025
- By Service Type
- By Vehicle Type
- By Corrosion Severity
- By Service Channel
- By End User
- Russia
- Pricing Analysis
- Market Share Analysis, 2025
- By Service Type
- By Vehicle Type
- By Corrosion Severity
- By Service Channel
- By End User
- Poland
- Pricing Analysis
- Market Share Analysis, 2025
- By Service Type
- By Vehicle Type
- By Corrosion Severity
- By Service Channel
- By End User
- Hungary
- Pricing Analysis
- Market Share Analysis, 2025
- By Service Type
- By Vehicle Type
- By Corrosion Severity
- By Service Channel
- By End User
- Kingdom of Saudi Arabia
- Pricing Analysis
- Market Share Analysis, 2025
- By Service Type
- By Vehicle Type
- By Corrosion Severity
- By Service Channel
- By End User
- Türkiye
- Pricing Analysis
- Market Share Analysis, 2025
- By Service Type
- By Vehicle Type
- By Corrosion Severity
- By Service Channel
- By End User
- South Africa
- Pricing Analysis
- Market Share Analysis, 2025
- By Service Type
- By Vehicle Type
- By Corrosion Severity
- By Service Channel
- By End User
- USA
- Market Structure Analysis
- Competition Dashboard
- Competition Benchmarking
- Market Share Analysis of Top Players
- By Regional
- By Service Type
- By Vehicle Type
- By Corrosion Severity
- By Service Channel
- By End User
- Emerging Startups
- Innovation Benchmarking
- Competition Analysis
- Competition Deep Dive
- DEKRA SE
- Overview
- Product Portfolio
- Profitability by Market Segments (Product/Region/Sales Channel)
- Sales Footprint
- Strategy Overview
- Marketing Strategy
- Product Strategy
- Channel Strategy
- TÜV SÜD AG
- TÜV Rheinland AG
- SGS SA
- Boyd Group Services Inc.
- Driven Brands Holdings Inc.
- Fix Network
- Ziebart International Corporation
- Krown Rust Control
- Rust Check
- DINITROL
- DEKRA SE
- Case Studies
- Success Stories
- Recent Developments
- Competition Deep Dive
- Assumptions & Acronyms Used


