Chitosan-based Seed Coatings Market Size and Share Forecast Outlook 2025 to 2035

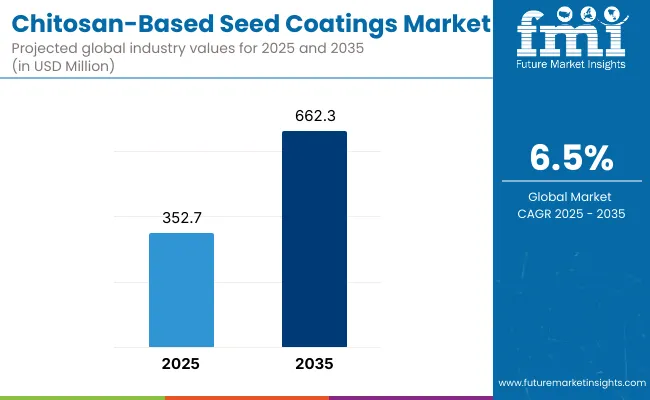
A valuation of USD 352.7 million in 2025 is expected to advance to USD 662.3 million by 2035, reflecting a 6.5% CAGR. Growth through 2025 to 2030 is projected to add USD 124.0 million, driven by wider adoption of film coating lines at seed processors and consistent demand from cereals, oilseeds, and high-value horticulture.
Quick Stats for Chitosan-based Seed Coatings Market

  • Market Value (2025): USD 352.7 Million
  • Market Forecast Value (2035): USD 662.3 Million
  • Market Forecast CAGR (2025 to 2035): 6.5%
  • Leading Type in 2025: Polymeric Chitosan Coatings (44.0% share)
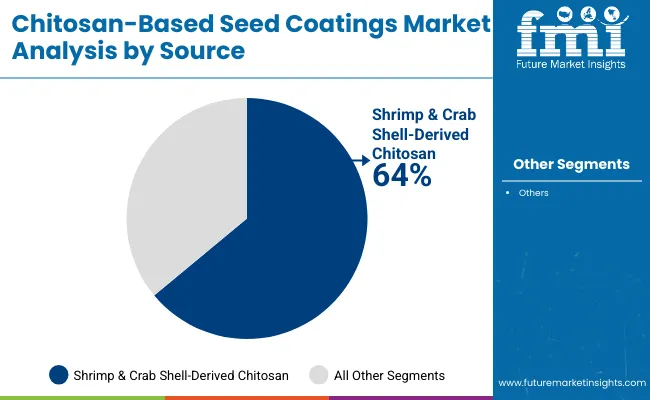
  • Leading Source in 2025: Shrimp & Crab Shell-Derived Chitosan (64.0% share)
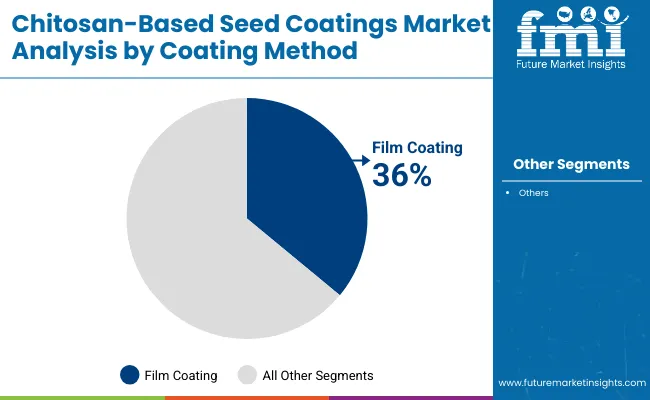
  • Leading Coating Method in 2025: Film Coating (36.0% share)
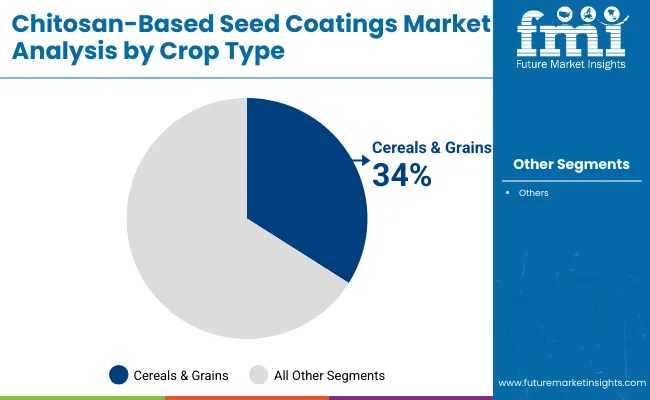
  • Leading Crop Type in 2025: Cereals & Grains (34.0% share)
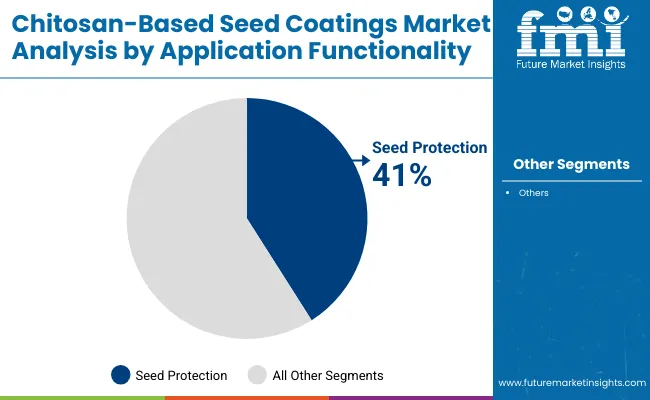
  • Leading Application Functionality in 2025: Seed Protection (41.0% share)
  • Leading End User in 2025: Commercial Farmers (44.0% share)
  • Leading Distribution Channel in 2025: Direct Sales (58.0% share)
  • Key Growth Regions (CAGR): South Asia & Pacific (9.0%), East Asia (8.1%)
  • Top Key Players: Novozymes, Agrinos, Biagro, BiOWiSH Technologies, regional Asian chitosan producers

Chitosan Based Seed Coatings Market

Chitosan-based Seed Coatings Market Key Takeaways

Metric Value
Chitosan-based Seed Coatings Market Estimated Value In (2025E) USD 352.7 Million
Chitosan-based Seed Coatings Market Forecast Value In (2035f) USD 662.3 Million
Forecast CAGR (2025 to 2035) 6.5%

During 2030 to 2035, an additional USD 185.6 million in value is anticipated as polymer encapsulation scales, fermentation-derived grades expand availability, and stress-tolerance use cases mature for drought and salinity management. Uptake is set to be reinforced by the agronomic benefits of chitosan-antimicrobial activity, improved germination, and elicitation of plant defense pathways-while compatibility with biologicals and micronutrient packages strengthens positioning in integrated seed treatment stacks.

In the USA, a steady upgrade cycle at commercial seed treaters underpins demand, whereas China and India are forecast to accelerate on the back of mechanization, hybrid seed penetration, and climate resilience policies. Regulatory comfort with shell-derived inputs is expected to persist, while fungal fermentation-derived chitosan gains favor in markets emphasizing traceability and non-animal sourcing. Digital agronomy and e-commerce channels are likely to broaden access for mid-sized growers, sustaining a balanced mix of direct contracting and distributor-led sales.

Why is the Chitosan-based Seed Coatings Market growing?

Expansion is being enabled by agronomic efficacy, sustainability alignment, and manufacturing innovation. Chitosan’s intrinsic antimicrobial and elicitor properties have been validated across crops, supporting seed protection against pathogens while priming plant defenses. Compatibility with nutrient delivery and biological actives has improved stand establishment and early vigor, translating to yield stability-critical under weather variability.

Manufacturing advances, including tighter deacetylation control and molecular-weight tailoring, have enhanced film integrity and adhesion, reducing dust and improving meterability in commercial treatment equipment. Polymer encapsulation has elevated dose precision for high-value horticulture, while fermentation-derived chitosan offers a scalable, non-marine alternative valued in markets prioritizing traceability.

Climate stress episodes are increasing adoption of stress-tolerance coatings for drought and salinity, particularly in South Asia and East Asia. As distributors integrate advisory services and digital ordering, access for small and mid-sized growers has improved, reinforcing recurring demand across seed replacement cycles.

Segmental Analysis

Segmentation spans type, source, coating method, crop type, application functionality, end user, distribution channel, and region, each mapping to distinct agronomic needs and go-to-market models. Polymeric coatings lead on breadth of use; shell-derived sources dominate on availability, while fermentation-derived options rise with traceability demands.

Film coating remains the operational default for cereals and oilseeds, whereas polymer encapsulation is favored in precision horticulture. Seed protection is prioritized in disease-prone geographies; stress-tolerance and nutrient delivery accelerate in climate-exposed belts. Commercial farmers and seed processors anchor demand, with direct B2B contracts prevailing and online platforms scaling for smaller lots.
Dominance of Polymeric Chitosan Coatings Shapes the Type Segment

Chitosan Based Seed Coatings Market By Type

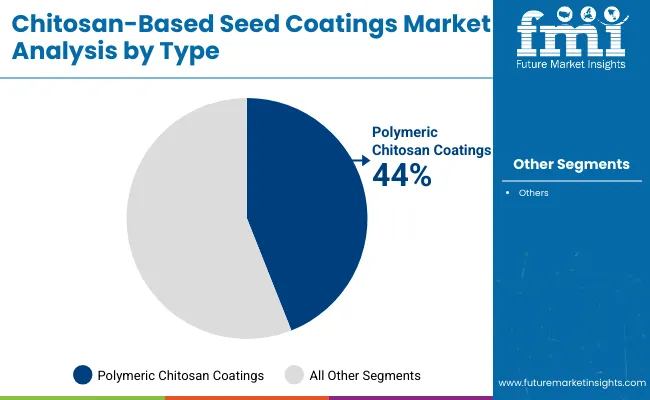
The type segment is led by polymeric chitosan coatings, which accounted for 44% of the market in 2025. Their dominance is attributed to strong film-forming ability, adhesion, and compatibility with other seed treatment actives such as micronutrients, fungicides, and biological inoculants. Polymeric grades are widely favored by commercial seed processors for cereals, grains, and oilseeds, where uniform coverage, dust reduction, and durability are crucial.

In contrast, oligomeric chitosan coatings are increasingly adopted in high-value seed lots due to their smaller molecular weight, which supports faster plant uptake and seed priming. Blended chitosan coatings, integrating biopolymers and nutrients, are emerging as the fastest-growing category, reflecting the industry’s shift toward multi-functional treatments that combine protection with germination enhancement. Overall, polymeric coatings remain central to large-scale agriculture, underpinning both efficiency and cost-effectiveness.

Type Market Value Share, 2025
Polymeric Chitosan Coatings 44.00%
Others 56.00%

Shell-Derived Supply Secures Leadership in the Source Segment

Chitosan Based Seed Coatings Market By Source

The source segment highlights the enduring importance of shrimp and crab shell-derived chitosan, which accounted for 64% of the market in 2025. This category remains dominant because of established supply chains, cost competitiveness, and scalability, particularly in regions with abundant marine processing industries.

Seed processors favor shell-derived chitosan for its reliable antimicrobial properties and consistent performance in film coating applications. However, environmental and sustainability concerns are creating momentum for alternatives. Fungal fermentation-derived chitosan is growing rapidly at a CAGR above 9%, driven by increasing demand for non-animal sourcing, traceability, and circular bioeconomy policies in Europe and East Asia.

Squid and other marine sources contribute modestly but serve niche regional markets. The combination of legacy infrastructure for shell-derived chitosan and innovation in fermentation-derived grades ensures a diversified sourcing mix moving forward.

Source Market Value Share, 2025
Shrimp & Crab Shell-Derived Chitosan 64.00%
Others 36.00%

Film Coating Continues to Define the Coating Method Segment

Chitosan Based Seed Coatings Market By Coating Method

Film coating is expected to remain the leading coating method, holding 36% share in 2025. Its continued dominance is based on operational efficiency and adaptability to high-throughput commercial seed treating equipment. Film coating ensures uniform application, dust control, and low active ingredient loading, making it the standard choice for large-volume crops such as cereals, grains, and oilseeds.

It is cost-effective and well-aligned with existing seed treatment lines. Polymer encapsulation, however, is projected to expand at the fastest rate, particularly in horticultural and high-value crop markets, due to its ability to deliver precise dosing, controlled release, and compatibility with multiple actives. Pelleting and encrusting remain specialized methods suited for small seeds, improving flowability and precision planting. Collectively, coating methods reflect a balance between efficiency, precision, and crop-specific needs.

Coating Method Market Value Share, 2025
Film Coating 36.00%
Others 64.00%

Cereals & Grains Anchor the Crop Type Segment

Chitosan Based Seed Coatings Market By Crop Type

Cereals and grains dominate the crop type segment, representing 34% of market share in 2025. Their leadership is linked to the vast global seeding area, strong mechanization, and the importance of stand establishment in crops like wheat, rice, corn, and barley. Commercial farmers increasingly rely on seed coatings to enhance germination, improve vigor, and protect against soil-borne pathogens.

Fruits and vegetables are projected to grow fastest, driven by the high economic returns of quality seeds and the importance of vigor and disease suppression in intensive farming systems. Oilseeds and pulses sustain steady demand, especially in North and South America, where soybean and canola acreage is significant. Turf and ornamentals represent niche markets, but adoption is growing in controlled environments. This distribution highlights cereals’ centrality while underscoring diversification into higher-value crops.

Crop Type Market Value Share, 2025
Cereals & Grains 34.00%
Others 66.00%

Seed Protection Dominates the Application Functionality Segment

Chitosan Based Seed Coatings Market By Application Functionality

Seed protection was the leading application functionality in 2025, accounting for 41% of market share. Its dominance stems from chitosan’s inherent antimicrobial and antifungal properties, which help seeds resist pathogens and enhance survival during early growth stages. Farmers and seed processors prioritize this functionality as it directly impacts stand establishment and overall yield potential.

Nutrient delivery and germination boosting, grouped under seed enhancement, are expanding rapidly in high-value crops, where precision in early growth can translate into premium returns. Stress tolerance applications, including coatings for drought and salinity resistance, are becoming increasingly relevant as climate variability intensifies in South Asia and East Asia. This functionality spectrum shows how chitosan-based coatings are not just protective but also enablers of plant performance under diverse agronomic conditions.

Application Functionality Market Value Share, 2025
Seed Protection 41.00%
Others 59.00%

What are the Drivers, Restraints, and Key Trends of the Chitosan-based Seed Coating Market?

Driver - Efficacy plus stack compatibility will broaden agronomic use

Chitosan’s dual action as both an antimicrobial and a plant defense elicitor is expected to underpin its growing role in seed treatment. By reducing pathogen load and stimulating systemic resistance, seeds achieve stronger establishment and improved resilience against soil-borne stress. In addition, compatibility with micronutrients, microbial inoculants, and biostimulants enables chitosan to be integrated into stacked recipes, thereby delivering multi-functional value.

This flexibility makes it highly attractive to seed processors and commercial farmers seeking cost-effective solutions that enhance vigor and early root development. The expansion of polymer encapsulation techniques further strengthens dose accuracy for high-value horticulture, reinforcing ROI-driven adoption. Collectively, these attributes position chitosan as more than a protective agent, instead as a versatile enabler of next-generation integrated seed treatment platforms.

Restraint - Feedstock variability and specification control will pressure margins

Supply dependence on marine waste streams such as shrimp and crab shells exposes producers to variability in quality, seasonal fluctuations, and uneven deacetylation profiles. Such inconsistency increases the need for advanced processing controls to achieve uniform viscosity and molecular weight distributions, both critical to coating performance.

Although fungal fermentation-derived chitosan offers a more consistent alternative, it remains costlier, limiting its short-term substitution in volume-driven markets. Smaller seed processors may struggle to maintain consistent coating performance across seed lots, as capital-intensive equipment and rigorous QA protocols are needed to ensure homogeneity.

Margins are therefore likely to be pressured, with cost volatility in raw materials and stringent customer specifications elevating entry barriers. This restraint is projected to create opportunities for consolidation, favoring suppliers that can guarantee reliable quality and sustainable sourcing.

Trend - Climate resilience, traceability, and fermentation sourcing will reshape adoption

Agriculture’s exposure to extreme weather patterns is intensifying interest in seed coatings that mitigate abiotic stress. Chitosan-based coatings designed for drought, salinity, and temperature resilience are projected to see wider adoption, particularly in South Asia and East Asia where crop losses from climate variability are frequent.

Beyond functionality, buyers are placing emphasis on traceability and sustainability, which is boosting demand for fermentation-derived chitosan that offers non-animal sourcing and transparent production processes. This aligns with food industry and export requirements, especially in Europe and Japan.

Simultaneously, digital agronomy and online agri-commerce platforms are reshaping distribution, making premium coatings accessible to mid-sized and smallholder farmers. Together, these shifts indicate that chitosan will increasingly serve as a climate-smart, transparent, and digitally enabled solution within the global seed coating landscape.
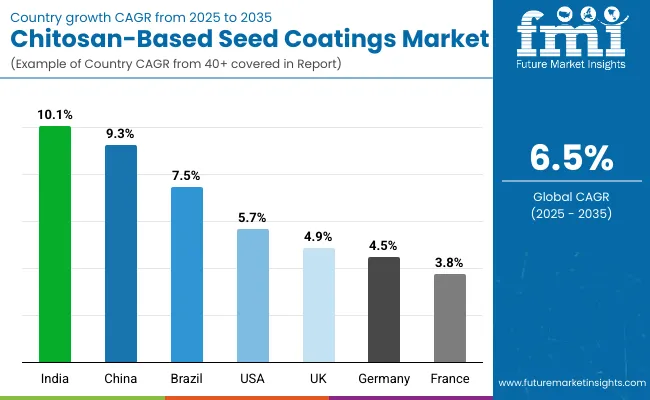
Analysis of Chitosan-based Seed Coating Market By Key Countries

Chitosan Based Seed Coatings Market Country Wise Analysis

Country CAGR (2025 to 2035)
China 9.3%
India 10.1%
Germany 4.5%
France 3.8%
UK 4.9%
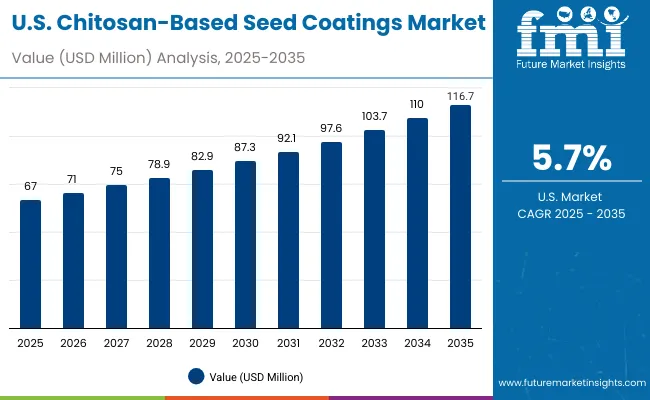
USA 5.7%
Brazil 7.5%

Sales Outlook for Chitosan-based Seed Coating in the United States

Usa Chitosan Based Seed Coatings Market

Year USA Chitosan-based Seed Coating Market (USD Million)
2025 67.0
2026 71.0
2027 75.0
2028 78.9
2029 82.9
2030 87.3
2031 92.1
2032 97.6
2033 103.7
2034 110.0
2035 116.7

A steady scale-up in commercial seed treating capacity is anticipated to support demand as seed processors prioritize uniform coverage, dust control, and easy meterability. Film coating is expected to remain the operational default for cereals and oilseeds, while polymer encapsulation is set to expand in vegetable and specialty seed lines where dose precision and multi-active loading are valued.

Chitosan’s antimicrobial and elicitor properties are being positioned as a complementary layer within stacked recipes that include micronutrients, microbial inoculants, and synthetic protectants, improving stand establishment and early vigor.

Distributor agronomy programs and direct B2B contracts are projected to anchor go-to-market models, with digital ordering simplifying replenishment for medium-sized farms. As sustainability reporting tightens, interest in fermentation-derived grades is likely to grow among processors serving food and seed companies with strong ESG targets, even as shell-derived supply remains the volume backbone.

  • Market share changes from 19% to 17% by 2035.
  • Film coating remains the dominant method at commercial treaters.
  • Stacked recipes (biologicals + nutrients) deepen chitosan adoption.
  • Direct B2B contracts lead; digital reordering gains traction.

China: Scale, hybrids, and climate resilience drive acceleration

Robust expansion is projected as hybrid seed penetration, mechanization, and climate resilience programs converge to raise treatment intensity per seed lot. Film coating will likely dominate high-throughput cereals and maize, while polymer encapsulation gains in horticulture and protected cultivation, reflecting the need for precise dosing and controlled release.

Chitosan’s role in disease suppression and vigor enhancement is being integrated with micronutrients and microbial inoculants to address early-season stress. Supply chains for shell-derived chitosan are mature, yet pilot adoption of fermentation-derived grades is expected in export-oriented segments that emphasize traceability.

Provincial extension services and distributor networks are anticipated to expand training on coating quality, dust standards, and equipment calibration, improving performance consistency. E-commerce sales of input packs for smallholders are likely to rise, broadening access to premium treatments.

  • Market share rises from 16% to 21% by 2035.
  • Functional focus on cereals and vegetables strengthens volume.
  • Stress-tolerance coatings gain traction in arid zones.
  • Distributor networks and extension programs scale adoption.

India: Double-digit growth on mechanization and drought management

Fastest growth among key countries is expected as mechanization spreads, certified seed usage increases, and climate variability intensifies demand for stress-tolerance solutions. Commercial farmers and organized seed processors are projected to expand film coating for cereals and pulses, while polymer encapsulation gains momentum in high-value horticulture due to precise dose delivery and compatibility with multi-active stacks.

Chitosan’s antimicrobial benefits and elicitor action are being positioned to improve emergence uniformity and early vigor under heat and intermittent moisture stress. Direct B2B contracting with seed companies is likely to dominate large volumes, while agri-ecommerce platforms expand access for mid-size growers with advisory-led bundles. Fermentation-derived chitosan is expected to find early adopters in export-linked horticulture that values non-animal sourcing and traceability.

  • Market share increases from 9% to 12% by 2035.
  • Highest country CAGR at 10.1% in your dataset.
  • Polymer encapsulation rises in horticulture and spices.
  • Agri-ecommerce broadens reach beyond distributor hubs.

Germany: Regulatory rigor and seed processor upgrades maintain quality focus

A quality-centric market posture is anticipated as seed processors prioritize compliance, dust minimization, and stable coating performance across lots. Film coating is expected to remain the baseline, with increased use of chitosan blends that integrate micronutrients or biopolymers to improve emergence uniformity in cereals, oilseeds, and sugar beet.

Precision agriculture programs and on-farm stewardship requirements are likely to favor low-dust, high-adhesion formulations that maintain planter hygiene. OEM partnerships for calibration and QA protocols should reinforce consistency, while fermentation-derived chitosan garners attention among processors serving sustainability-led customers. Although overall growth remains moderate, share retention is projected through higher specification products and exporter-grade consistency.
  • Market share adjusts from 7% to 6% by 2035.
  • Film coating standards and QA audits tighten.
  • Blends used to enhance emergence in cool-wet starts.
  • Direct B2B agreements remain the dominant channel.

Japan: Polymer Encapsulation Gains Momentum in the Coating Method Segment

Japan Chitosan Based Seed Coatings Market By Coating Method

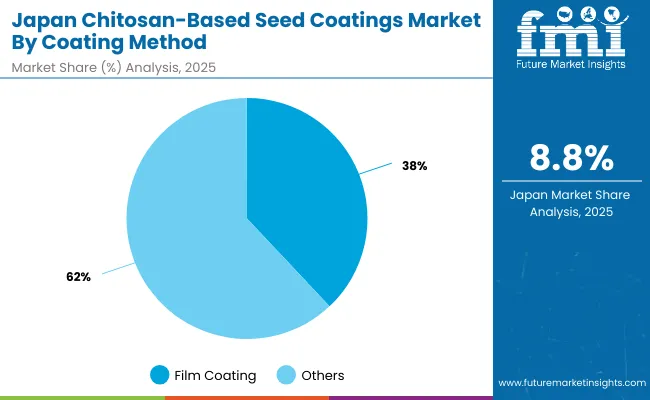
Japan’s chitosan-based seed coating market is structured around multiple coating methods, with film coating leading at 38% share in 2025. Film coating remains widely used for cereals, rice, and bulk vegetable crops because of its cost efficiency and ease of integration into existing seed treating systems. However, polymer encapsulation, with 28% share, is forecast to grow fastest at 8.8% CAGR, reflecting Japan’s emphasis on high-value horticulture and precision agriculture. Encapsulation provides controlled release, dose accuracy, and the ability to integrate multiple actives-qualities increasingly demanded in greenhouse and nursery cultivation.

Pelleting and encrusting maintain specialized roles, supporting seed flowability, planter calibration, and uniform seed sizing in vegetables and flowers. Collectively, Japan’s coating method mix illustrates a balance between established, large-volume film coating and innovation-led encapsulation that supports premium crop sectors.

Coating Method Share (2025)
Film Coating 38%
Others 62%
Coating Method CAGR (2025 to 2035)
Film Coating 6.2%
Others 7.3%

South Korea: Fermentation-Derived Grades Strengthen the Source Segment

South Korea Chitosan Based Seed Coatings Market By Source

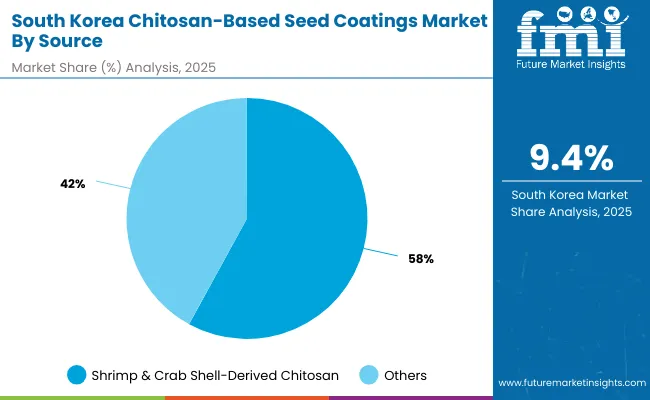
South Korea’s chitosan-based seed coating market is led by shrimp & crab shell-derived chitosan, holding 58% share in 2025, supported by established supply chains and lower production costs. This source dominates applications in cereals and maize, where large volumes and cost efficiency are priorities.

However, the most dynamic growth is projected for fungal fermentation-derived chitosan, which already accounts for 36% of the market and is expected to expand at a robust 9.4% CAGR. This reflects South Korea’s strong emphasis on sustainability, traceability, and innovation within its advanced agricultural ecosystem.

Fermentation-derived grades are gaining traction in horticulture, greenhouse crops, and export-oriented segments where non-animal sourcing is valued. Squid and other marine sources, though smaller at 6% share, contribute to niche applications but lack scalability. Together, these trends position South Korea as a leader in transitioning toward high-spec, sustainable chitosan sourcing.

Source Share (2025)
Shrimp & Crab Shell-Derived Chitosan 58%
Others 42%
Source CAGR (2025 to 2035)
Shrimp & Crab Shell-Derived Chitosan 6.00%
Others 7.50%

Competitive Landscape of Chitosan-based Seed Coating Market

Chitosan Based Seed Coatings Market By Company

Company Global Market Value Share, 2025
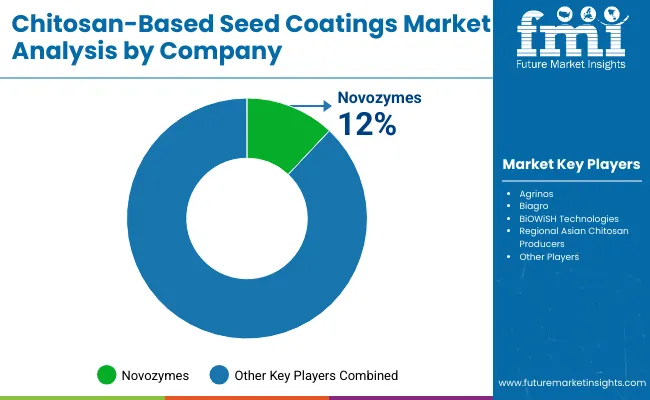
Novozymes (via Microbial & Biocontrol Portfolio) 12.0%
Others 88.0%

The competitive environment in the Chitosan-Based Seed Coatings Market is characterized by a small group of global players supported by regional specialists and research-focused enterprises. Novozymes, leveraging its microbial and biocontrol portfolio, is assessed as the leading participant with a 12% global value share in 2025. Its advantage stems from integrated solutions combining chitosan with microbial inoculants and biostimulants, aligning with the industry’s preference for stackable seed treatment products.

Alongside Novozymes, companies such as Agrinos, Biagro, and BiOWiSH Technologies are pursuing differentiated offerings in biopolymer blends and encapsulation technologies. Regional producers in Asia, particularly in China and India, are expanding shell-derived chitosan capacity, benefiting from abundant marine by-products and cost-efficient processing. Innovation is also occurring among niche European firms that specialize in fermentation-derived chitosan, targeting sustainability-conscious buyers with non-animal sourcing credentials.

Competitive advantage is increasingly shifting toward firms capable of ensuring consistency in molecular weight distribution, dust reduction, and compatibility with advanced application equipment. With climate resilience and traceability gaining traction, companies that can pair high-performance coatings with transparent sourcing are expected to capture premium market positions, while smaller participants may face consolidation pressures.

Key Developments in Chitosan-based Seed Coating Market

  • March 2025 - Fungal fermentation-based chitosan pilot launched in EuropeA consortium of European agri-biotech firms announced the launch of pilot-scale fungal fermentation facilities for chitosan production. The initiative aims to supply non-animal, traceable chitosan for seed coating applications, directly addressing sustainability and regulatory compliance demands in the EU seed sector.
  • February 2025 - Encapsulation platform expanded for vegetable seeds in JapanA Japanese seed technology company introduced a polymer encapsulation system integrating chitosan with micronutrients and microbial inoculants. The innovation targets high-value vegetable and horticultural seeds, ensuring precise dosing, improved germination, and enhanced stress resilience, particularly under variable climate conditions.

Scope of the Report

Item Details
Market Size, 2025 USD 352.7 Million
Market Size, 2035 USD 662.3 Million
Absolute Growth (2025 to 2035) USD 309.6 Million
CAGR (2025 to 2035) 6.50%
Value Added 2025 to 2030 ~USD 124.0 Million
Value Added 2030 to 2035 ~USD 185.6 Million
Type (2025) Polymeric Chitosan Coatings lead (44% share)
Source (2025) Shrimp & Crab Shell-Derived Chitosan leads (64% share)
Coating Method (2025) Film Coating leads (36% share)
Crop Type (2025) Cereals & Grains lead (34% share)
Application Functionality (2025) Seed Protection leads (41% share)
End User (2025) Commercial Farmers lead (44% share)
Distribution Channel (2025) Direct Sales lead (58% share)
Key Growth Regions (CAGR) South Asia & Pacific (9.0%) , East Asia (8.1%)
Regions Covered North America, Latin America, Europe, East Asia, South Asia & Pacific, Middle East & Africa
Countries Covered USA, UK, Germany, France, China, India, Japan, South Korea, Brazil
Key Companies Profiled Novozymes, Agrinos, Biagro, BiOWiSH Technologies, regional Asian chitosan producers
Additional Attributes Climate-resilient coatings; compatibility with microbial inoculants; non-animal fermentation-derived sourcing; dust control and meterability ; e-commerce enablement

Key Segments

By Type:

  • Polymeric Chitosan Coatings
  • Oligomeric Chitosan Coatings
  • Chitosan Blends (with Biopolymers, Nutrients, or Additives)
  • Others

By Source:

  • Shrimp & Crab Shell-Derived Chitosan
  • Squid & Other Marine Sources
  • Fungal Fermentation-Derived Chitosan

By Coating Method:

  • Film Coating
  • Polymer Encapsulation
  • Pelleting
  • Encrusting
  • Others

By Crop Type:

  • Cereals & Grains
    • Wheat
    • Rice
    • Corn
    • Barley
  • Oilseeds & Pulses
    • Soybean
    • Canola
    • Lentils
  • Fruits & Vegetables
  • Turf & Ornamentals
  • Others

By Application Functionality:

  • Seed Protection
    • Antimicrobial
    • Antifungal
    • Pest Resistance
  • Seed Enhancement
  • Stress Tolerance
  • Others

By Region:

  • North America
  • Latin America
  • Europe
  • East Asia
  • South Asia & Pacific
  • Middle East and Africa

Table of Content

  1. Executive Summary
    • Global Market Outlook
    • Demand-side Trends
    • Supply-side Trends
    • Technology Roadmap Analysis
    • Analysis and Recommendations
  2. Market Overview
    • Market Coverage / Taxonomy
    • Market Definition / Scope / Limitations
  3. Market Background
    • Market Dynamics
      • Drivers
      • Restraints
      • Opportunity
      • Trends
    • Scenario Forecast
      • Demand in Optimistic Scenario
      • Demand in Likely Scenario
      • Demand in Conservative Scenario
    • Opportunity Map Analysis
    • Product Life Cycle Analysis
    • Supply Chain Analysis
    • Investment Feasibility Matrix
    • Value Chain Analysis
    • PESTLE and Porter’s Analysis
    • Regulatory Landscape
    • Regional Parent Market Outlook
    • Production and Consumption Statistics
    • Import and Export Statistics
  4. Global Analysis 2020 to 2024 and Forecast, 2025 to 2035
    • Historical Market Size Value (USD Million) & Volume (MT) Analysis, 2020 to 2024
    • Current and Future Market Size Value (USD Million) & Volume (MT) Projections, 2025 to 2035
      • Y-o-Y Growth Trend Analysis
      • Absolute $ Opportunity Analysis
  5. Global Pricing Analysis 2020 to 2024 and Forecast 2025 to 2035
  6. Global Analysis 2020 to 2024 and Forecast 2025 to 2035, By Type
    • Introduction / Key Findings
    • Historical Market Size Value (USD Million) & Volume (MT) Analysis By Type, 2020 to 2024
    • Current and Future Market Size Value (USD Million) & Volume (MT) Analysis and Forecast By Type, 2025 to 2035
      • Polymeric Chitosan Coatings
      • Oligomeric Chitosan Coatings
      • Chitosan Blends (with Biopolymers, Nutrients, or Additives)
      • Others
    • Y-o-Y Growth Trend Analysis By Type, 2020 to 2024
    • Absolute $ Opportunity Analysis By Type, 2025 to 2035
  7. Global Analysis 2020 to 2024 and Forecast 2025 to 2035, By Source
    • Introduction / Key Findings
    • Historical Market Size Value (USD Million) & Volume (MT) Analysis By Source, 2020 to 2024
    • Current and Future Market Size Value (USD Million) & Volume (MT) Analysis and Forecast By Source, 2025 to 2035
      • Shrimp & Crab Shell-Derived Chitosan
      • Squid & Other Marine Sources
      • Fungal Fermentation-Derived Chitosan
    • Y-o-Y Growth Trend Analysis By Source, 2020 to 2024
    • Absolute $ Opportunity Analysis By Source, 2025 to 2035
  8. Global Analysis 2020 to 2024 and Forecast 2025 to 2035, By Coating Method
    • Introduction / Key Findings
    • Historical Market Size Value (USD Million) & Volume (MT) Analysis By Coating Method, 2020 to 2024
    • Current and Future Market Size Value (USD Million) & Volume (MT) Analysis and Forecast By Coating Method, 2025 to 2035
      • Film Coating
      • Polymer Encapsulation
      • Pelleting
      • Encrusting
      • Others
    • Y-o-Y Growth Trend Analysis By Coating Method, 2020 to 2024
    • Absolute $ Opportunity Analysis By Coating Method, 2025 to 2035
  9. Global Analysis 2020 to 2024 and Forecast 2025 to 2035, By Crop Type
    • Introduction / Key Findings
    • Historical Market Size Value (USD Million) & Volume (MT) Analysis By Crop Type, 2020 to 2024
    • Current and Future Market Size Value (USD Million) & Volume (MT) Analysis and Forecast By Crop Type, 2025 to 2035
      • Cereals & Grains
        • Wheat
        • Rice
        • Corn
        • Barley
      • Oilseeds & Pulses
        • Soybean
        • Canola
        • Lentils
      • Fruits & Vegetables
      • Turf & Ornamentals
      • Others
    • Y-o-Y Growth Trend Analysis By Crop Type, 2020 to 2024
    • Absolute $ Opportunity Analysis By Crop Type, 2025 to 2035
  10. Global Analysis 2020 to 2024 and Forecast 2025 to 2035, By Application Functionality
    • Introduction / Key Findings
    • Historical Market Size Value (USD Million) & Volume (MT) Analysis By Application Functionality, 2020 to 2024
    • Current and Future Market Size Value (USD Million) & Volume (MT) Analysis and Forecast By Application Functionality, 2025 to 2035
      • Seed Protection
        • Antimicrobial
        • Antifungal
        • Pest Resistance
      • Seed Enhancement
      • Stress Tolerance
      • Others
    • Y-o-Y Growth Trend Analysis By Application Functionality, 2020 to 2024
    • Absolute $ Opportunity Analysis By Application Functionality, 2025 to 2035
  11. Global Analysis 2020 to 2024 and Forecast 2025 to 2035, By Region
    • Introduction
    • Historical Market Size Value (USD Million) & Volume (MT) Analysis By Region, 2020 to 2024
    • Current Market Size Value (USD Million) & Volume (MT) Analysis and Forecast By Region, 2025 to 2035
      • North America
      • Latin America
      • Europe
      • East Asia
      • South Asia & Pacific
      • Middle East and Africa
    • Market Attractiveness Analysis By Region
  12. North America Analysis 2020 to 2024 and Forecast 2025 to 2035, By Country
    • Historical Market Size Value (USD Million) & Volume (MT) Trend Analysis By Market Taxonomy, 2020 to 2024
    • Market Size Value (USD Million) & Volume (MT) Forecast By Market Taxonomy, 2025 to 2035
      • By Country
        • USA
        • Canada
      • By Type
      • By Source
      • By Coating Method
      • By Crop Type
      • By Application Functionality
    • Market Attractiveness Analysis
      • By Country
      • By Type
      • By Source
      • By Coating Method
      • By Crop Type
      • By Application Functionality
    • Key Takeaways
  13. Latin America Analysis 2020 to 2024 and Forecast 2025 to 2035, By Country
    • Historical Market Size Value (USD Million) & Volume (MT) Trend Analysis By Market Taxonomy, 2020 to 2024
    • Market Size Value (USD Million) & Volume (MT) Forecast By Market Taxonomy, 2025 to 2035
      • By Country
        • Brazil
        • Mexico
        • Colombia
        • Rest of Latin America
      • By Type
      • By Source
      • By Coating Method
      • By Crop Type
      • By Application Functionality
    • Market Attractiveness Analysis
      • By Country
      • By Type
      • By Source
      • By Coating Method
      • By Crop Type
      • By Application Functionality
    • Key Takeaways
  14. Europe Analysis 2020 to 2024 and Forecast 2025 to 2035, By Country
    • Historical Market Size Value (USD Million) & Volume (MT) Trend Analysis By Market Taxonomy, 2020 to 2024
    • Market Size Value (USD Million) & Volume (MT) Forecast By Market Taxonomy, 2025 to 2035
      • By Country
        • Germany
        • UK
        • France
        • Italy
        • Spain
        • Belgium
        • Netherlands
        • Nordic
        • Switzerland
        • Russia
        • Poland
        • Rest of Europe
      • By Type
      • By Source
      • By Coating Method
      • By Crop Type
      • By Application Functionality
    • Market Attractiveness Analysis
      • By Country
      • By Type
      • By Source
      • By Coating Method
      • By Crop Type
      • By Application Functionality
    • Key Takeaways
  15. East Asia Analysis 2020 to 2024 and Forecast 2025 to 2035, By Country
    • Historical Market Size Value (USD Million) & Volume (MT) Trend Analysis By Market Taxonomy, 2020 to 2024
    • Market Size Value (USD Million) & Volume (MT) Forecast By Market Taxonomy, 2025 to 2035
      • By Country
        • China
        • Japan
        • South Korea
      • By Type
      • By Source
      • By Coating Method
      • By Crop Type
      • By Application Functionality
    • Market Attractiveness Analysis
      • By Country
      • By Type
      • By Source
      • By Coating Method
      • By Crop Type
      • By Application Functionality
    • Key Takeaways
  16. South Asia & Pacific Analysis 2020 to 2024 and Forecast 2025 to 2035, By Country
    • Historical Market Size Value (USD Million) & Volume (MT) Trend Analysis By Market Taxonomy, 2020 to 2024
    • Market Size Value (USD Million) & Volume (MT) Forecast By Market Taxonomy, 2025 to 2035
      • By Country
        • India
        • Thailand
        • Malaysia
        • Indonesia
        • Singapore
        • Vietnam
        • Australia
        • New Zealand
        • Rest of South Asia
      • By Type
      • By Source
      • By Coating Method
      • By Crop Type
      • By Application Functionality
    • Market Attractiveness Analysis
      • By Country
      • By Type
      • By Source
      • By Coating Method
      • By Crop Type
      • By Application Functionality
    • Key Takeaways
  17. Middle East and Africa Analysis 2020 to 2024 and Forecast 2025 to 2035, By Country
    • Historical Market Size Value (USD Million) & Volume (MT) Trend Analysis By Market Taxonomy, 2020 to 2024
    • Market Size Value (USD Million) & Volume (MT) Forecast By Market Taxonomy, 2025 to 2035
      • By Country
        • Turkey
        • UAE
        • Saudi Arabia
        • Israel
        • Other GCC Countries
        • North Africa
        • South Africa
      • By Type
      • By Source
      • By Coating Method
      • By Crop Type
      • By Application Functionality
    • Market Attractiveness Analysis
      • By Country
      • By Type
      • By Source
      • By Coating Method
      • By Crop Type
      • By Application Functionality
    • Key Takeaways
  18. Key Countries Analysis
    • USA
      • Pricing Analysis
      • Market Share Analysis, 2024
        • By Type
        • By Source
        • By Coating Method
        • By Crop Type
        • By Application Functionality
    • Canada
      • Pricing Analysis
      • Market Share Analysis, 2024
        • By Type
        • By Source
        • By Coating Method
        • By Crop Type
        • By Application Functionality
    • Mexico
      • Pricing Analysis
      • Market Share Analysis, 2024
        • By Type
        • By Source
        • By Coating Method
        • By Crop Type
        • By Application Functionality
    • Brazil
      • Pricing Analysis
      • Market Share Analysis, 2024
        • By Type
        • By Source
        • By Coating Method
        • By Crop Type
        • By Application Functionality
    • Germany
      • Pricing Analysis
      • Market Share Analysis, 2024
        • By Type
        • By Source
        • By Coating Method
        • By Crop Type
        • By Application Functionality
    • UK
      • Pricing Analysis
      • Market Share Analysis, 2024
        • By Type
        • By Source
        • By Coating Method
        • By Crop Type
        • By Application Functionality
    • Italy
      • Pricing Analysis
      • Market Share Analysis, 2024
        • By Type
        • By Source
        • By Coating Method
        • By Crop Type
        • By Application Functionality
    • Spain
      • Pricing Analysis
      • Market Share Analysis, 2024
        • By Type
        • By Source
        • By Coating Method
        • By Crop Type
        • By Application Functionality
    • France
      • Pricing Analysis
      • Market Share Analysis, 2024
        • By Type
        • By Source
        • By Coating Method
        • By Crop Type
        • By Application Functionality
    • India
      • Pricing Analysis
      • Market Share Analysis, 2024
        • By Type
        • By Source
        • By Coating Method
        • By Crop Type
        • By Application Functionality
    • Australia & New Zealand
      • Pricing Analysis
      • Market Share Analysis, 2024
        • By Type
        • By Source
        • By Coating Method
        • By Crop Type
        • By Application Functionality
    • China
      • Pricing Analysis
      • Market Share Analysis, 2024
        • By Type
        • By Source
        • By Coating Method
        • By Crop Type
        • By Application Functionality
    • Japan
      • Pricing Analysis
      • Market Share Analysis, 2024
        • By Type
        • By Source
        • By Coating Method
        • By Crop Type
        • By Application Functionality
    • South Korea
      • Pricing Analysis
      • Market Share Analysis, 2024
        • By Type
        • By Source
        • By Coating Method
        • By Crop Type
        • By Application Functionality
    • Russia
      • Pricing Analysis
      • Market Share Analysis, 2024
        • By Type
        • By Source
        • By Coating Method
        • By Crop Type
        • By Application Functionality
    • Poland
      • Pricing Analysis
      • Market Share Analysis, 2024
        • By Type
        • By Source
        • By Coating Method
        • By Crop Type
        • By Application Functionality
    • Hungary
      • Pricing Analysis
      • Market Share Analysis, 2024
        • By Type
        • By Source
        • By Coating Method
        • By Crop Type
        • By Application Functionality
    • Kingdom of Saudi Arabia
      • Pricing Analysis
      • Market Share Analysis, 2024
        • By Type
        • By Source
        • By Coating Method
        • By Crop Type
        • By Application Functionality
    • Turkiye
      • Pricing Analysis
      • Market Share Analysis, 2024
        • By Type
        • By Source
        • By Coating Method
        • By Crop Type
        • By Application Functionality
    • South Africa
      • Pricing Analysis
      • Market Share Analysis, 2024
        • By Type
        • By Source
        • By Coating Method
        • By Crop Type
        • By Application Functionality
  19. Market Structure Analysis
    • Competition Dashboard
    • Competition Benchmarking
    • Market Share Analysis of Top Players
      • By Regional
      • By Type
      • By Source
      • By Coating Method
      • By Crop Type
      • By Application Functionality
  20. Competition Analysis
    • Competition Deep Dive
  21. Assumptions & Acronyms Used
  22. Research Methodology

List of Tables

  • Table 1: Global Value (USD Million) Forecast by Region, 2020-2035
  • Table 2: Global Volume (MT) Forecast by Region, 2020-2035
  • Table 3: Global Value (USD Million) Forecast by Type, 2020-2035
  • Table 4: Global Volume (MT) Forecast by Type, 2020-2035
  • Table 5: Global Value (USD Million) Forecast by Source, 2020-2035
  • Table 6: Global Volume (MT) Forecast by Source, 2020-2035
  • Table 7: Global Value (USD Million) Forecast by Coating Method, 2020-2035
  • Table 8: Global Volume (MT) Forecast by Coating Method, 2020-2035
  • Table 9: Global Value (USD Million) Forecast by Crop Type, 2020-2035
  • Table 10: Global Volume (MT) Forecast by Crop Type, 2020-2035
  • Table 11: Global Value (USD Million) Forecast by Application Functionality, 2020-2035
  • Table 12: Global Volume (MT) Forecast by Application Functionality, 2020-2035
  • Table 13: North America Value (USD Million) Forecast by Country, 2020-2035
  • Table 14: North America Volume (MT) Forecast by Country, 2020-2035
  • Table 15: North America Value (USD Million) Forecast by Type, 2020-2035
  • Table 16: North America Volume (MT) Forecast by Type, 2020-2035
  • Table 17: North America Value (USD Million) Forecast by Source, 2020-2035
  • Table 18: North America Volume (MT) Forecast by Source, 2020-2035
  • Table 19: North America Value (USD Million) Forecast by Coating Method, 2020-2035
  • Table 20: North America Volume (MT) Forecast by Coating Method, 2020-2035
  • Table 21: North America Value (USD Million) Forecast by Crop Type, 2020-2035
  • Table 22: North America Volume (MT) Forecast by Crop Type, 2020-2035
  • Table 23: North America Value (USD Million) Forecast by Application Functionality, 2020-2035
  • Table 24: North America Volume (MT) Forecast by Application Functionality, 2020-2035
  • Table 25: Latin America Value (USD Million) Forecast by Country, 2020-2035
  • Table 26: Latin America Volume (MT) Forecast by Country, 2020-2035
  • Table 27: Latin America Value (USD Million) Forecast by Type, 2020-2035
  • Table 28: Latin America Volume (MT) Forecast by Type, 2020-2035
  • Table 29: Latin America Value (USD Million) Forecast by Source, 2020-2035
  • Table 30: Latin America Volume (MT) Forecast by Source, 2020-2035
  • Table 31: Latin America Value (USD Million) Forecast by Coating Method, 2020-2035
  • Table 32: Latin America Volume (MT) Forecast by Coating Method, 2020-2035
  • Table 33: Latin America Value (USD Million) Forecast by Crop Type, 2020-2035
  • Table 34: Latin America Volume (MT) Forecast by Crop Type, 2020-2035
  • Table 35: Latin America Value (USD Million) Forecast by Application Functionality, 2020-2035
  • Table 36: Latin America Volume (MT) Forecast by Application Functionality, 2020-2035
  • Table 37: Europe Value (USD Million) Forecast by Country, 2020-2035
  • Table 38: Europe Volume (MT) Forecast by Country, 2020-2035
  • Table 39: Europe Value (USD Million) Forecast by Type, 2020-2035
  • Table 40: Europe Volume (MT) Forecast by Type, 2020-2035
  • Table 41: Europe Value (USD Million) Forecast by Source, 2020-2035
  • Table 42: Europe Volume (MT) Forecast by Source, 2020-2035
  • Table 43: Europe Value (USD Million) Forecast by Coating Method, 2020-2035
  • Table 44: Europe Volume (MT) Forecast by Coating Method, 2020-2035
  • Table 45: Europe Value (USD Million) Forecast by Crop Type, 2020-2035
  • Table 46: Europe Volume (MT) Forecast by Crop Type, 2020-2035
  • Table 47: Europe Value (USD Million) Forecast by Application Functionality, 2020-2035
  • Table 48: Europe Volume (MT) Forecast by Application Functionality, 2020-2035
  • Table 49: East Asia Value (USD Million) Forecast by Country, 2020-2035
  • Table 50: East Asia Volume (MT) Forecast by Country, 2020-2035
  • Table 51: East Asia Value (USD Million) Forecast by Type, 2020-2035
  • Table 52: East Asia Volume (MT) Forecast by Type, 2020-2035
  • Table 53: East Asia Value (USD Million) Forecast by Source, 2020-2035
  • Table 54: East Asia Volume (MT) Forecast by Source, 2020-2035
  • Table 55: East Asia Value (USD Million) Forecast by Coating Method, 2020-2035
  • Table 56: East Asia Volume (MT) Forecast by Coating Method, 2020-2035
  • Table 57: East Asia Value (USD Million) Forecast by Crop Type, 2020-2035
  • Table 58: East Asia Volume (MT) Forecast by Crop Type, 2020-2035
  • Table 59: East Asia Value (USD Million) Forecast by Application Functionality, 2020-2035
  • Table 60: East Asia Volume (MT) Forecast by Application Functionality, 2020-2035
  • Table 61: South Asia & Pacific Value (USD Million) Forecast by Country, 2020-2035
  • Table 62: South Asia & Pacific Volume (MT) Forecast by Country, 2020-2035
  • Table 63: South Asia & Pacific Value (USD Million) Forecast by Type, 2020-2035
  • Table 64: South Asia & Pacific Volume (MT) Forecast by Type, 2020-2035
  • Table 65: South Asia & Pacific Value (USD Million) Forecast by Source, 2020-2035
  • Table 66: South Asia & Pacific Volume (MT) Forecast by Source, 2020-2035
  • Table 67: South Asia & Pacific Value (USD Million) Forecast by Coating Method, 2020-2035
  • Table 68: South Asia & Pacific Volume (MT) Forecast by Coating Method, 2020-2035
  • Table 69: South Asia & Pacific Value (USD Million) Forecast by Crop Type, 2020-2035
  • Table 70: South Asia & Pacific Volume (MT) Forecast by Crop Type, 2020-2035
  • Table 71: South Asia & Pacific Value (USD Million) Forecast by Application Functionality, 2020-2035
  • Table 72: South Asia & Pacific Volume (MT) Forecast by Application Functionality, 2020-2035
  • Table 73: Middle East and Africa Value (USD Million) Forecast by Country, 2020-2035
  • Table 74: Middle East and Africa Volume (MT) Forecast by Country, 2020-2035
  • Table 75: Middle East and Africa Value (USD Million) Forecast by Type, 2020-2035
  • Table 76: Middle East and Africa Volume (MT) Forecast by Type, 2020-2035
  • Table 77: Middle East and Africa Value (USD Million) Forecast by Source, 2020-2035
  • Table 78: Middle East and Africa Volume (MT) Forecast by Source, 2020-2035
  • Table 79: Middle East and Africa Value (USD Million) Forecast by Coating Method, 2020-2035
  • Table 80: Middle East and Africa Volume (MT) Forecast by Coating Method, 2020-2035
  • Table 81: Middle East and Africa Value (USD Million) Forecast by Crop Type, 2020-2035
  • Table 82: Middle East and Africa Volume (MT) Forecast by Crop Type, 2020-2035
  • Table 83: Middle East and Africa Value (USD Million) Forecast by Application Functionality, 2020-2035
  • Table 84: Middle East and Africa Volume (MT) Forecast by Application Functionality, 2020-2035

List of Figures

  • Figure 1: Global Volume (MT) Forecast 2020-2035
  • Figure 2: Global Pricing Analysis
  • Figure 3: Global Value (USD Million) Forecast 2020-2035
  • Figure 4: Global Value Share and BPS Analysis by Type, 2025 and 2035
  • Figure 5: Global Y-o-Y Growth Comparison by Type, 2025-2035
  • Figure 6: Global Attractiveness Analysis by Type
  • Figure 7: Global Value Share and BPS Analysis by Source, 2025 and 2035
  • Figure 8: Global Y-o-Y Growth Comparison by Source, 2025-2035
  • Figure 9: Global Attractiveness Analysis by Source
  • Figure 10: Global Value Share and BPS Analysis by Coating Method, 2025 and 2035
  • Figure 11: Global Y-o-Y Growth Comparison by Coating Method, 2025-2035
  • Figure 12: Global Attractiveness Analysis by Coating Method
  • Figure 13: Global Value Share and BPS Analysis by Crop Type, 2025 and 2035
  • Figure 14: Global Y-o-Y Growth Comparison by Crop Type, 2025-2035
  • Figure 15: Global Attractiveness Analysis by Crop Type
  • Figure 16: Global Value Share and BPS Analysis by Application Functionality, 2025 and 2035
  • Figure 17: Global Y-o-Y Growth Comparison by Application Functionality, 2025-2035
  • Figure 18: Global Attractiveness Analysis by Application Functionality
  • Figure 19: Global Value (USD Million) Share and BPS Analysis by Region, 2025 and 2035
  • Figure 20: Global Y-o-Y Growth Comparison by Region, 2025-2035
  • Figure 21: Global Attractiveness Analysis by Region
  • Figure 22: North America Incremental $ Opportunity, 2025-2035
  • Figure 23: Latin America Incremental $ Opportunity, 2025-2035
  • Figure 24: Europe Incremental $ Opportunity, 2025-2035
  • Figure 25: East Asia Incremental $ Opportunity, 2025-2035
  • Figure 26: South Asia & Pacific Incremental $ Opportunity, 2025-2035
  • Figure 27: Middle East and Africa Incremental $ Opportunity, 2025-2035
  • Figure 28: North America Value Share and BPS Analysis by Country, 2025 and 2035
  • Figure 29: North America Value Share and BPS Analysis by Type, 2025 and 2035
  • Figure 30: North America Y-o-Y Growth Comparison by Type, 2025-2035
  • Figure 31: North America Attractiveness Analysis by Type
  • Figure 32: North America Value Share and BPS Analysis by Source, 2025 and 2035
  • Figure 33: North America Y-o-Y Growth Comparison by Source, 2025-2035
  • Figure 34: North America Attractiveness Analysis by Source
  • Figure 35: North America Value Share and BPS Analysis by Coating Method, 2025 and 2035
  • Figure 36: North America Y-o-Y Growth Comparison by Coating Method, 2025-2035
  • Figure 37: North America Attractiveness Analysis by Coating Method
  • Figure 38: North America Value Share and BPS Analysis by Crop Type, 2025 and 2035
  • Figure 39: North America Y-o-Y Growth Comparison by Crop Type, 2025-2035
  • Figure 40: North America Attractiveness Analysis by Crop Type
  • Figure 41: North America Value Share and BPS Analysis by Application Functionality, 2025 and 2035
  • Figure 42: North America Y-o-Y Growth Comparison by Application Functionality, 2025-2035
  • Figure 43: North America Attractiveness Analysis by Application Functionality
  • Figure 44: Latin America Value Share and BPS Analysis by Country, 2025 and 2035
  • Figure 45: Latin America Value Share and BPS Analysis by Type, 2025 and 2035
  • Figure 46: Latin America Y-o-Y Growth Comparison by Type, 2025-2035
  • Figure 47: Latin America Attractiveness Analysis by Type
  • Figure 48: Latin America Value Share and BPS Analysis by Source, 2025 and 2035
  • Figure 49: Latin America Y-o-Y Growth Comparison by Source, 2025-2035
  • Figure 50: Latin America Attractiveness Analysis by Source
  • Figure 51: Latin America Value Share and BPS Analysis by Coating Method, 2025 and 2035
  • Figure 52: Latin America Y-o-Y Growth Comparison by Coating Method, 2025-2035
  • Figure 53: Latin America Attractiveness Analysis by Coating Method
  • Figure 54: Latin America Value Share and BPS Analysis by Crop Type, 2025 and 2035
  • Figure 55: Latin America Y-o-Y Growth Comparison by Crop Type, 2025-2035
  • Figure 56: Latin America Attractiveness Analysis by Crop Type
  • Figure 57: Latin America Value Share and BPS Analysis by Application Functionality, 2025 and 2035
  • Figure 58: Latin America Y-o-Y Growth Comparison by Application Functionality, 2025-2035
  • Figure 59: Latin America Attractiveness Analysis by Application Functionality
  • Figure 60: Europe Value Share and BPS Analysis by Country, 2025 and 2035
  • Figure 61: Europe Value Share and BPS Analysis by Type, 2025 and 2035
  • Figure 62: Europe Y-o-Y Growth Comparison by Type, 2025-2035
  • Figure 63: Europe Attractiveness Analysis by Type
  • Figure 64: Europe Value Share and BPS Analysis by Source, 2025 and 2035
  • Figure 65: Europe Value Share and BPS Analysis by Application Functionality, 2025 and 2035
  • Figure 66: Europe Y-o-Y Growth Comparison by Application Functionality, 2025-2035
  • Figure 67: Europe Attractiveness Analysis by Application Functionality
  • Figure 68: East Asia Value Share and BPS Analysis by Country, 2025 and 2035
  • Figure 69: East Asia Value Share and BPS Analysis by Type, 2025 and 2035
  • Figure 70: East Asia Y-o-Y Growth Comparison by Type, 2025-2035
  • Figure 71: East Asia Attractiveness Analysis by Type
  • Figure 72: East Asia Value Share and BPS Analysis by Source, 2025 and 2035
  • Figure 73: East Asia Y-o-Y Growth Comparison by Source, 2025-2035
  • Figure 74: East Asia Attractiveness Analysis by Source
  • Figure 75: East Asia Value Share and BPS Analysis by Coating Method, 2025 and 2035
  • Figure 76: East Asia Y-o-Y Growth Comparison by Coating Method, 2025-2035
  • Figure 77: East Asia Attractiveness Analysis by Coating Method
  • Figure 78: East Asia Value Share and BPS Analysis by Crop Type, 2025 and 2035
  • Figure 79: East Asia Y-o-Y Growth Comparison by Crop Type, 2025-2035
  • Figure 80: East Asia Attractiveness Analysis by Crop Type
  • Figure 81: East Asia Value Share and BPS Analysis by Application Functionality, 2025 and 2035
  • Figure 82: East Asia Y-o-Y Growth Comparison by Application Functionality, 2025-2035
  • Figure 83: East Asia Attractiveness Analysis by Application Functionality
  • Figure 84: South Asia & Pacific Value Share and BPS Analysis by Country, 2025 and 2035
  • Figure 85: South Asia & Pacific Value Share and BPS Analysis by Type, 2025 and 2035
  • Figure 86: South Asia & Pacific Y-o-Y Growth Comparison by Type, 2025-2035
  • Figure 87: South Asia & Pacific Attractiveness Analysis by Type
  • Figure 88: South Asia & Pacific Value Share and BPS Analysis by Source, 2025 and 2035
  • Figure 89: South Asia & Pacific Y-o-Y Growth Comparison by Source, 2025-2035
  • Figure 90: South Asia & Pacific Attractiveness Analysis by Source
  • Figure 91: South Asia & Pacific Value Share and BPS Analysis by Coating Method, 2025 and 2035
  • Figure 92: South Asia & Pacific Y-o-Y Growth Comparison by Coating Method, 2025-2035
  • Figure 93: South Asia & Pacific Attractiveness Analysis by Coating Method
  • Figure 94: South Asia & Pacific Value Share and BPS Analysis by Crop Type, 2025 and 2035
  • Figure 95: South Asia & Pacific Y-o-Y Growth Comparison by Crop Type, 2025-2035
  • Figure 96: South Asia & Pacific Attractiveness Analysis by Crop Type
  • Figure 97: South Asia & Pacific Value Share and BPS Analysis by Application Functionality, 2025 and 2035
  • Figure 98: South Asia & Pacific Y-o-Y Growth Comparison by Application Functionality, 2025-2035
  • Figure 99: South Asia & Pacific Attractiveness Analysis by Application Functionality
  • Figure 100: Middle East and Africa Value Share and BPS Analysis by Country, 2025 and 2035
  • Figure 101: Middle East and Africa Value Share and BPS Analysis by Type, 2025 and 2035
  • Figure 102: Middle East and Africa Y-o-Y Growth Comparison by Type, 2025-2035
  • Figure 103: Middle East and Africa Attractiveness Analysis by Type
  • Figure 104: Middle East and Africa Value Share and BPS Analysis by Source, 2025 and 2035
  • Figure 105: Middle East and Africa Y-o-Y Growth Comparison by Source, 2025-2035
  • Figure 106: Middle East and Africa Attractiveness Analysis by Source
  • Figure 107: Middle East and Africa Value Share and BPS Analysis by Coating Method, 2025 and 2035
  • Figure 108: Middle East and Africa Y-o-Y Growth Comparison by Coating Method, 2025-2035
  • Figure 109: Middle East and Africa Attractiveness Analysis by Coating Method
  • Figure 110: Middle East and Africa Value Share and BPS Analysis by Crop Type, 2025 and 2035
  • Figure 111: Middle East and Africa Y-o-Y Growth Comparison by Crop Type, 2025-2035
  • Figure 112: Middle East and Africa Attractiveness Analysis by Crop Type
  • Figure 113: Middle East and Africa Value Share and BPS Analysis by Application Functionality, 2025 and 2035
  • Figure 114: Middle East and Africa Y-o-Y Growth Comparison by Application Functionality, 2025-2035
  • Figure 115: Middle East and Africa Attractiveness Analysis by Application Functionality
  • Figure 116: Global - Tier Structure Analysis
  • Figure 117: Global - Company Share Analysis

Frequently Asked Questions

What is the market size of the Chitosan-Based Seed Coatings Market in 2025?

The market is valued at USD 352.7 million in 2025.

What is the projected market size of the Chitosan-Based Seed Coatings Market in 2035?

The market is expected to reach USD 662.3 million by 2035.

What is the CAGR of the Chitosan-Based Seed Coatings Market during 2025 to 2035?

The market is forecast to expand at a CAGR of 6.5%.

Which is the leading segment by type in 2025?

Polymeric Chitosan Coatings are projected to dominate with a 44% share in 2025.

Which regions are expected to record the fastest growth during 2025 to 2035?

South Asia & Pacific (9.0% CAGR) and East Asia (8.1% CAGR) are expected to witness the fastest growth rates.

Explore Similar Insights

Future Market Insights

Chitosan-based Seed Coatings Market

Chat With

MaRIA

Hi There, I am MaRIA, Your Market Research Intelligence Assistant. How may I help you?