Clean Labelled Food Additives Market Size and Share Forecast Outlook 2025 to 2035

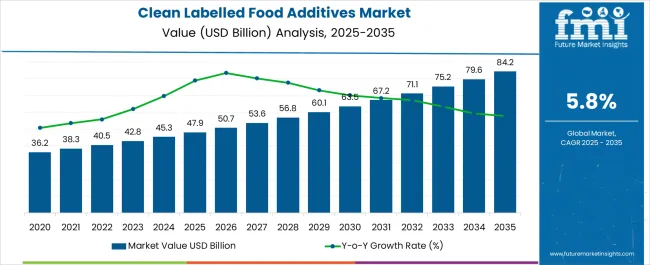
The clean labelled food additives market, valued at 47.9 USD billion in 2025, is projected to reach 84.2 USD billion by 2035, reflecting a CAGR of 5.8% over the period. The market maturity curve shows early adoption during 2020–2024, with annual growth from 36.2 to 45.3 USD billion, as food manufacturers test ingredient transparency and labeling options. By 2025, adoption enters the scaling phase, driven by broader implementation across processed foods, beverages, and bakery products.

Between 2025–2030, the market grows from 47.9 to 63.5 USD billion, supported by standardized sourcing, wider supplier networks, and increased acceptance. From 2030–2035, growth moderates as consolidation occurs, with leading suppliers capturing major shares of production and distribution. The adoption lifecycle mirrors this progression. During 2020–2024, early adopters validate clean label formulations, optimize ingredient performance, and establish reference products. From 2025–2030, scaling occurs as mainstream manufacturers increase procurement, supply chains stabilize, and contracts standardize across regions.

By 2030–2035, consolidation dominates: late entrants adopt proven additive formulations, mergers and partnerships shape competitive dynamics, and procurement focuses on cost efficiency and supply reliability. The market transitions from experimental adoption through rapid scale-up to a mature phase characterized by predictable demand, optimized production, and established supplier relationships.
Quick Stats for Clean Labelled Food Additives Market

  • Clean Labelled Food Additives Market Value (2025): USD 47.9 billion
  • Clean Labelled Food Additives Market Forecast Value (2035): USD 84.2 billion
  • Clean Labelled Food Additives Market Forecast CAGR: 5.8%
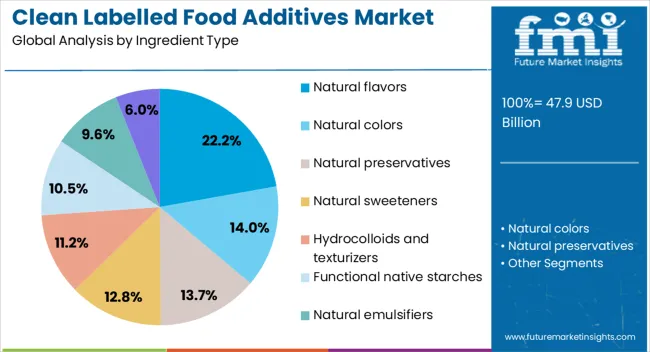
  • Leading Segment in Clean Labelled Food Additives Market in 2025: Natural flavors (22.2%)
  • Key Growth Regions in Clean Labelled Food Additives Market: North America, Asia-Pacific, Europe
  • Top Key Players in Clean Labelled Food Additives Market: Kerry Group plc, ADM (Archer Daniels Midland), Cargill, Incorporated, DSM, IFF (International F&F Inc.), BASF SE, Ingredion Incorporated, Sensient Technologies, Corbion, Symrise

Clean Labelled Food Additives Market Market Value Analysis

Clean Labelled Food Additives Market Key Takeaways

Metric Value
Clean Labelled Food Additives Market Estimated Value in (2025 E) USD 47.9 billion
Clean Labelled Food Additives Market Forecast Value in (2035 F) USD 84.2 billion
Forecast CAGR (2025 to 2035) 5.8%

Data shows that Q3 and Q4 account for 35–40% of annual procurement, coinciding with peak beverage, bakery, and processed food production ahead of festive seasons. Conversely, Q1 typically records 10–15% lower activity, as manufacturers adjust inventories after year-end demand. Seasonal promotional campaigns and product launches can create short-term spikes of 10–15% above baseline.

Suppliers and manufacturers align ingredient sourcing, production, and distribution schedules with these seasonal peaks to maintain an uninterrupted supply and meet retailer and consumer demand efficiently. Cyclicality reflects broader investment and reformulation patterns in the food industry. Food manufacturers typically review and upgrade additive formulations every 5–7 years, generating periodic surges in procurement that can increase annual market size by USD 3–5 billion. Regulatory approvals, labeling changes, or shifts in ingredient availability may temporarily accelerate demand by 5–10% above projected growth.

Over the decade, these cyclical surges overlay the underlying CAGR of 5.8%, producing alternating periods of rapid adoption and moderate stabilization. Recognizing these cycles allows suppliers to optimize production, inventory, and procurement planning effectively.

Why is the Clean Labelled Food Additives Market Growing?

The movement toward healthier lifestyles has heightened demand for additives that are free from synthetic chemicals and artificial preservatives. Manufacturers are responding by reformulating product lines to incorporate clean label alternatives that align with evolving regulatory guidelines and consumer expectations.

Advances in extraction technologies and sustainable sourcing practices have made it possible to produce natural additives at scale while maintaining consistent quality. Strategic collaborations between ingredient suppliers and food brands are facilitating innovation in flavor, texture, and shelf-life enhancement without reliance on artificial compounds.

The future outlook remains positive, driven by rising health awareness, stringent food labeling laws, and premium positioning of clean label products across global markets. With strong demand from both developed and emerging economies, the market is poised to expand further as clean label formulations become standard across multiple food categories.

Segmental Analysis

The clean labelled food additives market is segmented by ingredient type, source, form, certification, end use, functionality, consumer, and geographic regions. By ingredient type, the clean labelled food additives market is divided into Natural flavors, Natural colors, Natural preservatives, Natural sweeteners, Hydrocolloids and texturizers, Functional native starches, Natural emulsifiers, and Other. In terms of source, the clean labelled food additives market is classified into Plant-based, Animal-based, Microbial/fermentation, and Mineral-based. Based on form, the clean labelled food additives market is segmented into Dry/powder, Liquid, and Others.

By certification, clean labelled food additives market is segmented into Organic, Non-GMO, Natural, Clean label certified, and Others. By end use, clean labelled food additives market is segmented into Bakery & confectionery, Beverages, Dairy & frozen, Processed foods, Sauces & condiments, Snacks & convenience, Meat, poultry & Seafood, and Others. By functionality, clean labelled food additives market is segmented into Preservation, Texture modification, Flavor/color enhancement, Emulsification, Sweetening, and Others.

By consumer, clean labelled food additives market is segmented into Conventional product, Premium product, Health & wellness product, Children’s products, and Others. Regionally, the clean labelled food additives industry is classified into North America, Latin America, Western Europe, Eastern Europe, Balkan & Baltic Countries, Russia & Belarus, Central Asia, East Asia, South Asia & Pacific, and the Middle East & Africa.
Insights into the Natural Flavors Ingredient Type Segment

Clean Labelled Food Additives Market Analysis By Ingredient Type

The natural flavors segment is projected to account for 22.20% of the Clean Labelled Food Additives market revenue share in 2025, making it the leading ingredient type. Growth in this segment has been driven by the increasing replacement of artificial flavors with plant and fruit-derived alternatives that meet clean label criteria. Consumers have shown a strong preference for authentic taste profiles supported by natural origin claims, which has reinforced demand for these additives.

The expansion of processed and convenience foods with premium positioning has further increased the use of natural flavors to enhance sensory appeal. Advances in flavor extraction and preservation methods have enabled manufacturers to maintain stability and potency without synthetic agents.

Regulatory support for natural ingredient labeling has also contributed to wider adoption in packaged food and beverage products. As clean label trends continue to influence purchase decisions, natural flavors are expected to maintain their competitive advantage due to their alignment with health-conscious and sustainability-driven consumer priorities.
Insights into the Plant-Based Source Segment

Clean Labelled Food Additives Market Analysis By Source

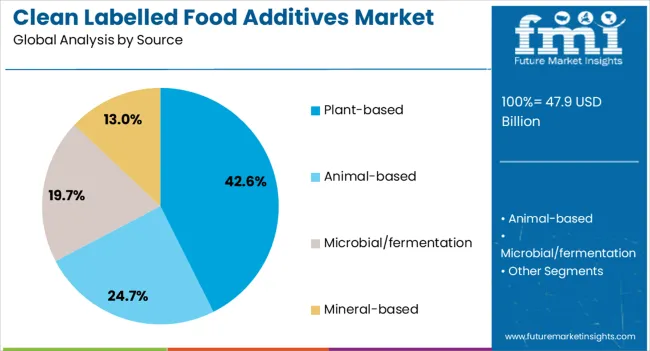
The plant-based source segment is expected to hold 42.60% of the Clean Labelled Food Additives market revenue share in 2025, establishing its leadership within the source category. Its growth has been supported by the global shift toward plant-derived ingredients, which are perceived as healthier, more sustainable, and ethically aligned. The ability of plant-based sources to provide a wide range of functional benefits, including flavor enhancement, color stability, and nutritional enrichment, has driven adoption across multiple food categories.

Manufacturers have increasingly turned to botanical extracts, herbs, and spices to meet both clean label requirements and consumer demand for natural authenticity. Investments in sustainable farming and supply chain traceability have strengthened the credibility and availability of plant-based additives.

Additionally, the rising popularity of vegan and vegetarian lifestyles has expanded the application scope of plant-based sources. With ongoing innovations in plant processing and extraction techniques, this segment is expected to retain its market dominance in the foreseeable future.
Insights into the Dry or Powder Form Segment

Clean Labelled Food Additives Market Analysis By Form

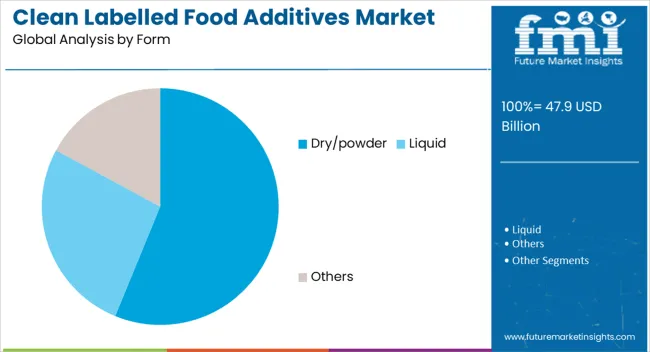
The dry or powder form segment is projected to hold 56.20% of the Clean Labelled Food Additives market revenue share in 2025, making it the dominant form segment. Its strong position is attributed to the extended shelf life, ease of transportation, and versatility in application that powder-based additives offer. Food manufacturers favor this form for its cost-effectiveness in storage and distribution, as well as its stability in maintaining flavor, color, and nutritional integrity during processing.

The dry format also allows for easier integration into various product formulations, from baked goods to beverages, without affecting moisture balance. Growing demand for convenient and scalable food production methods has further reinforced the preference for powder additives in the clean-label sector.

Technological advancements in drying and encapsulation processes have improved the functional performance of these additives while preserving their natural properties. As the industry continues to prioritize efficiency and product quality, the dry or powder form is set to maintain its leadership position.

What are the Drivers, Restraints, and Key Trends of the Clean Labelled Food Additives Market?

The clean labelled food additives market is growing as consumers increasingly seek products with simple, recognizable ingredients and no artificial chemicals. These additives improve texture, flavor, color, and shelf life in snacks, beverages, dairy, and bakery products. North America and Europe lead adoption due to health-conscious consumers, while Asia-Pacific shows emerging demand. Manufacturers focus on natural extracts, plant-based stabilizers, and functional ingredients that meet clean label requirements without compromising product quality, taste, or processing efficiency.

Consumer Preference for Transparent Ingredients

Rising consumer awareness of ingredient origins is a primary driver. Shoppers increasingly check labels to avoid synthetic chemicals, artificial flavors, or colors. Brands offering products with natural preservatives, colors, and flavor enhancers gain trust and loyalty. Clean-labelled additives allow manufacturers to make clear, understandable ingredient claims, boosting brand differentiation in competitive markets. The need to meet this transparency without compromising taste, appearance, or shelf life is driving research into multifunctional natural additives. Until alternative approaches provide the same balance between natural claims and functional performance, clean-labelled ingredients remain essential for capturing consumer confidence.

Maintaining Product Quality and Stability

Natural additives must perform consistently under manufacturing conditions while ensuring texture, flavor, and shelf life. Ingredients such as plant-based emulsifiers, natural antioxidants, and stabilizers replace synthetic counterparts in baked goods, beverages, dairy, and snacks. Reliability under heat, pH changes, and storage is critical to prevent product defects or spoilage. Manufacturers prioritize additives that integrate smoothly into existing processes, reduce waste, and maintain quality standards. Until new processing methods can achieve identical functional performance without these additives, clean-labelled ingredients are indispensable for preserving product integrity across diverse food categories.

Regulatory Compliance and Labelling Accuracy

Regulations governing food additives vary by region, particularly concerning claims like “natural” or “free from artificial ingredients.” Manufacturers must ensure that ingredient sourcing, testing, and documentation comply with local laws. Proper labelling avoids penalties, recalls, and reputational risk. Additives that meet regulatory standards across multiple regions simplify operations for global brands. Until alternative methods guarantee the same level of compliance and clear labeling, clean-labelled additives will remain the primary solution for producing market-ready, legally compliant food products that meet consumer expectations.

Application Across Multiple Food Categories

Clean-labelled additives are widely used in bakery, dairy, beverages, snacks, and ready-to-eat products. They improve functional attributes such as moisture retention, color stability, flavor intensity, and shelf life while allowing brands to market products with recognizable, simple ingredients. The versatility of natural additives reduces the need for category-specific synthetic solutions, optimizing production efficiency. Until alternatives can provide multifunctional capabilities with the same consistency, clean-labelled additives will continue to be central for manufacturers aiming to maintain product quality and meet consumer-driven ingredient transparency demands across multiple food categories.
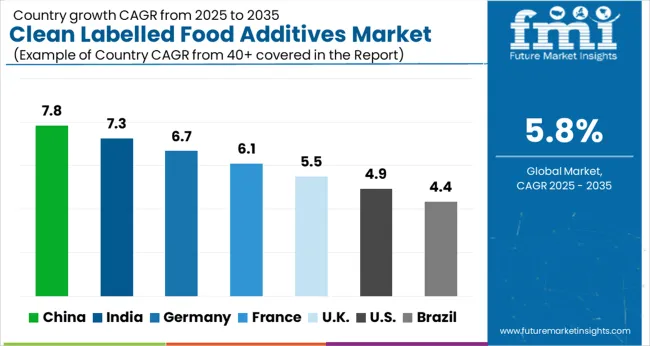
Analysis of Clean Labelled Food Additives Market By Key Countries

Clean Labelled Food Additives Market Cagr Analysis By Country

Country CAGR
China 7.8%
India 7.3%
Germany 6.7%
France 6.1%
UK 5.5%
USA 4.9%
Brazil 4.4%

The global Clean Labelled Food Additives Market is projected to grow at a CAGR of 5.8% through 2035, supported by increasing demand across food processing, beverage, and functional food applications. Among BRICS nations, China has been recorded with 7.8% growth, driven by large-scale production and deployment in processed food and beverage industries, while India has been observed at 7.3%, supported by rising utilization in functional and processed food applications. In the OECD region, Germany has been measured at 6.7%, where production and adoption for food processing and additive applications have been steadily maintained. The United Kingdom has been noted at 5.5%, reflecting consistent use in processed and functional foods, while the USA has been recorded at 4.9%, with production and utilization across food processing, beverages, and functional food sectors being steadily increased. This report includes insights on 40+ countries; the top markets are shown here for reference.

Clean Labelled Food Additives Market Analysis in China

The clean labelled food additives market in China is growing at a CAGR of 7.8%, driven by increasing consumer demand for natural, safe, and minimally processed food products. Rising health awareness, concerns about synthetic additives, and preference for transparent labeling are fueling adoption across the food and beverage industry. Manufacturers are incorporating natural preservatives, colors, flavors, and stabilizers to meet consumer expectations. Technological advancements in formulation, processing, and packaging ensure product quality and safety. Growth in modern retail, supermarkets, and e-commerce channels supports wider distribution of clean labelled products. Government initiatives promoting food safety, hygiene, and nutritional standards further boost market expansion. With increasing focus on healthier diets and clean labeling transparency, China represents a significant growth opportunity for clean-label food additives.

  • High demand in natural and minimally processed foods
  • Use of natural preservatives, colors, and flavors
  • Government initiatives promoting food safety and nutrition

Clean Labelled Food Additives Market Insights in India

The clean labelled food additives market in India is expanding at a CAGR of 7.3%, driven by rising health-conscious consumer behavior and preference for naturally sourced ingredients. Urbanization, changing dietary patterns, and increasing disposable income are accelerating demand for clean labelled products across packaged food and beverage segments. Manufacturers are adopting natural colors, flavors, sweeteners, and preservatives to replace synthetic additives while ensuring food safety and quality. Technological innovations in formulation, processing, and packaging enhance product shelf life and compliance with safety standards. Growth of organized retail, supermarkets, and online food platforms is increasing accessibility and adoption. Government regulations on food labeling, quality, and hygiene support market growth. With increasing awareness about clean and safe food consumption, India is witnessing steady expansion in the clean labelled food additives market.
  • Rising demand in packaged and processed food segments
  • Use of natural flavors, colors, and preservatives
  • Compliance with government food safety and labeling regulations

Clean Labelled Food Additives Market Review in Germany

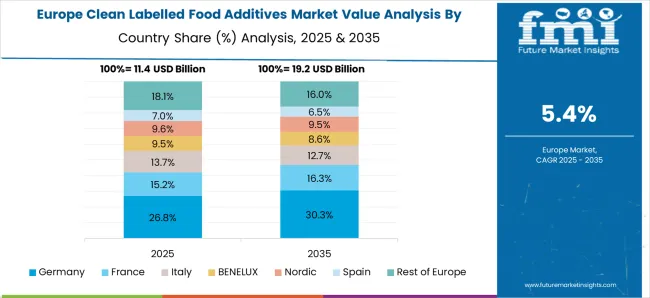
Clean Labelled Food Additives Market Europe Country Market Share Analysis, 2025 & 2035

The clean labelled food additives market in Germany is growing at a CAGR of 6.7%, driven by strong consumer preference for natural, organic, and minimally processed food products. Rising health awareness, dietary concerns, and the trend for transparent labeling support adoption in the food and beverage industry. Manufacturers are incorporating natural flavors, colors, sweeteners, and preservatives to replace synthetic additives while maintaining quality and safety standards. Technological advancements in processing, formulation, and packaging improve shelf life and product integrity. Germany’s strict regulations on food safety, labeling, and additive usage drive compliance and innovation. Growth in supermarkets, modern retail, and e-commerce further expands market reach. The focus on natural ingredients, clean labeling transparency, and safe food consumption ensures steady market growth in Germany.

  • Demand for natural, organic, and minimally processed foods
  • Use of natural colors, flavors, and sweeteners
  • Compliance with strict food safety and labeling laws

Clean Labelled Food Additives Market Outlook in United Kingdom

The clean labelled food additives market in the United Kingdom is expanding at a CAGR of 5.5%, driven by growing consumer demand for natural, clean, and safe food products. Rising awareness about synthetic additives, dietary health, and food transparency drives adoption across retail, foodservice, and packaged food sectors.

Manufacturers are replacing artificial preservatives, colors, and flavors with naturally sourced alternatives while ensuring product quality. Technological innovations in formulation, processing, and packaging improve safety, shelf life, and operational efficiency. The growth of modern retail chains, supermarkets, and e-commerce channels enhances product availability. Government regulations promoting clean labeling, food safety, and nutritional transparency further encourage market expansion. With evolving consumer preferences and regulatory support, the clean labelled food additives market in the UK is set for steady growth.
  • High demand in retail, foodservice, and packaged foods
  • Replacement of artificial additives with natural alternatives
  • Government regulations supporting clean labeling and safety

Clean Labelled Food Additives Market Trends in United States

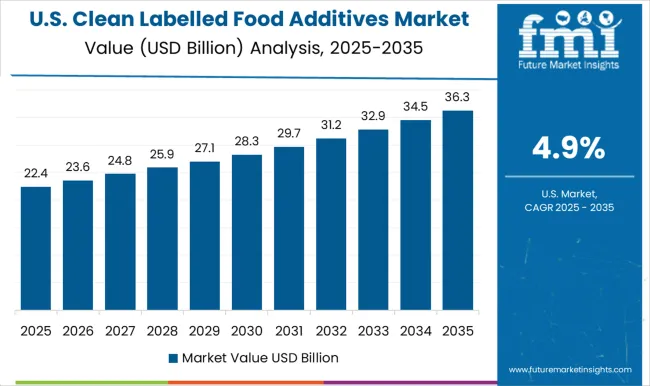
Clean Labelled Food Additives Market Country Value Analysis

The clean labelled food additives market in the United States is growing at a CAGR of 4.9%, driven by increasing consumer preference for natural, organic, and minimally processed food products. Health-conscious consumers are seeking products free from synthetic preservatives, colors, and flavors, boosting adoption in packaged foods, snacks, and beverages. Manufacturers are focusing on natural sweeteners, flavors, and preservatives to meet consumer demand while maintaining food safety and quality.

Technological innovations in processing, formulation, and sustainable packaging enhance shelf life and efficiency. E-commerce and modern retail growth facilitate wider distribution and accessibility. Government regulations on clean labeling, nutritional transparency, and food safety encourage innovation and compliance. With the combined influence of consumer preferences, regulatory support, and technological advancement, the USA market for clean labelled food additives is positioned for consistent growth.

  • Rising demand for natural and minimally processed foods
  • Use of natural flavors, colors, and preservatives
  • Government regulations promoting labeling transparency and safety

Competitive Landscape of Clean Labelled Food Additives Market

The clean labelled food additives market is rapidly growing as consumers increasingly demand transparency, natural ingredients, and minimally processed foods. Clean label additives, which include natural preservatives, flavor enhancers, emulsifiers, and colorants, are designed to improve product quality and shelf life without artificial chemicals, meeting the rising preference for healthier, more transparent food options. Kerry Group plc is a leading supplier, offering a wide portfolio of natural flavors, proteins, and functional ingredients tailored for clean label applications. ADM (Archer Daniels Midland) provides innovative plant-based and natural additives that cater to health-conscious consumers.

Cargill, Incorporated, focuses on natural emulsifiers, sweeteners, and texturizing agents that support clean label formulations while enhancing taste and texture. DSM delivers natural solutions for food preservation and nutritional enrichment, while IFF (International Flavors & Fragrances Inc.) specializes in natural flavors and colorants that align with clean label trends. BASF SE, Ingredion Incorporated, and Sensient Technologies provide a broad range of natural functional ingredients, including thickeners, stabilizers, and natural colorants.

Corbion focuses on clean label preservatives and functional ingredients that extend shelf life naturally, whereas Symrise offers natural flavoring and ingredient systems for clean label foods. As regulatory standards and consumer expectations for transparency continue to tighten, these manufacturers are at the forefront of innovation, enabling food and beverage brands to deliver products that are both appealing and naturally formulated.

Key Players in the Clean Labelled Food Additives Market

  • Kerry Group plc
  • ADM (Archer Daniels Midland)
  • Cargill, Incorporated
  • DSM
  • IFF (International F&F Inc.)
  • BASF SE
  • Ingredion Incorporated
  • Sensient Technologies
  • Corbion
  • Symrise

Scope of the Report

Item Value
Quantitative Units USD 47.9 Billion
Ingredient Type Natural flavors, Natural colors, Natural preservatives, Natural sweeteners, Hydrocolloids and texturizers, Functional native starches, Natural emulsifiers, and Other
Source Plant-based, Animal-based, Microbial/fermentation, and Mineral-based
Form Dry/powder, Liquid, and Others
Certification Organic, Non-GMO, Natural, Clean label certified, and Others
End Use Bakery & confectionery, Beverages, Dairy & frozen, Processed foods, Sauces & condiments, Snacks & convenience, Meat, poultry & Seafood, and Others
Functionality Preservation, Texture modification, Flavor/color enhancement, Emulsification, Sweetening, and Others
Consumer Conventional product, Premium product, Health & wellness product, Children’s products, and Others
Regions Covered North America, Europe, Asia-Pacific, Latin America, Middle East & Africa
Country Covered United States, Canada, Germany, France, United Kingdom, China, Japan, India, Brazil, South Africa
Key Companies Profiled Kerry Group plc, ADM (Archer Daniels Midland), Cargill, Incorporated, DSM, IFF (International F&F Inc.), BASF SE, Ingredion Incorporated, Sensient Technologies, Corbion, and Symrise
Additional Attributes Dollar sales by type including natural preservatives, colorants, flavorings, and emulsifiers, application across bakery, dairy, beverages, and processed foods, and region covering North America, Europe, and Asia-Pacific. Growth is driven by rising consumer demand for transparency, clean-label products, and healthier food options.

Clean Labelled Food Additives Market by Segments

Ingredient Type:

  • Natural flavors
  • Natural colors
  • Natural preservatives
  • Natural sweeteners
  • Hydrocolloids and texturizers
  • Functional native starches
  • Natural emulsifiers
  • Other

Source:

  • Plant-based
  • Animal-based
  • Microbial/fermentation
  • Mineral-based

Form:

  • Dry/powder
  • Liquid
  • Others

Certification:

  • Organic
  • Non-GMO
  • Natural
  • Clean label certified
  • Others

End Use:

  • Bakery & confectionery
  • Beverages
  • Dairy & frozen
  • Processed foods
  • Sauces & condiments
  • Snacks & convenience
  • Meat, poultry & Seafood
  • Others

Region:

  • North America
    • USA
    • Canada
    • Mexico
  • Latin America
    • Brazil
    • Chile
    • Rest of Latin America
  • Western Europe
    • Germany
    • UK
    • Italy
    • Spain
    • France
    • Nordic
    • BENELUX
    • Rest of Western Europe
  • Eastern Europe
    • Russia
    • Poland
    • Hungary
    • Balkan & Baltic
    • Rest of Eastern Europe
  • East Asia
    • China
    • Japan
    • South Korea
  • South Asia and Pacific
    • India
    • ASEAN
    • Australia & New Zealand
    • Rest of South Asia and Pacific
  • Middle East & Africa
    • Kingdom of Saudi Arabia
    • Other GCC Countries
    • Turkiye
    • South Africa
    • Other African Union
    • Rest of Middle East & Africa

Table of Content

  1. Executive Summary
    • Global Market Outlook
    • Demand-side Trends
    • Supply-side Trends
    • Technology Roadmap Analysis
    • Analysis and Recommendations
  2. Market Overview
    • Market Coverage / Taxonomy
    • Market Definition / Scope / Limitations
  3. Market Background
    • Market Dynamics
      • Drivers
      • Restraints
      • Opportunity
      • Trends
    • Scenario Forecast
      • Demand in Optimistic Scenario
      • Demand in Likely Scenario
      • Demand in Conservative Scenario
    • Opportunity Map Analysis
    • Product Life Cycle Analysis
    • Supply Chain Analysis
    • Investment Feasibility Matrix
    • Value Chain Analysis
    • PESTLE and Porter’s Analysis
    • Regulatory Landscape
    • Regional Parent Market Outlook
    • Production and Consumption Statistics
    • Import and Export Statistics
  4. Global Clean Labelled Food Additives Market Analysis 2020-2024 and Forecast, 2025-2035
    • Historical Market Size Value (USD Mn) Analysis, 2020-2024
    • Current and Future Market Size Value (USD Mn) Projections, 2025-2035
      • Y-o-Y Growth Trend Analysis
      • Absolute $ Opportunity Analysis
  5. Global Clean Labelled Food Additives Market Pricing Analysis 2020-2024 and Forecast 2025-2035
  6. Global Clean Labelled Food Additives Market Analysis 2020-2024 and Forecast 2025-2035, By Ingredient Type
    • Introduction / Key Findings
    • Historical Market Size Value (USD Mn) Analysis By Ingredient Type , 2020-2024
    • Current and Future Market Size Value (USD Mn) Analysis and Forecast By Ingredient Type , 2025-2035
      • Natural flavors
      • Natural colors
      • Natural preservatives
      • Natural sweeteners
      • Hydrocolloids and texturizers
      • Functional native starches
      • Natural emulsifiers
      • Other
    • Y-o-Y Growth Trend Analysis By Ingredient Type , 2020-2024
    • Absolute $ Opportunity Analysis By Ingredient Type , 2025-2035
  7. Global Clean Labelled Food Additives Market Analysis 2020-2024 and Forecast 2025-2035, By Source
    • Introduction / Key Findings
    • Historical Market Size Value (USD Mn) Analysis By Source, 2020-2024
    • Current and Future Market Size Value (USD Mn) Analysis and Forecast By Source, 2025-2035
      • Plant-based
      • Animal-based
      • Microbial/fermentation
      • Mineral-based
    • Y-o-Y Growth Trend Analysis By Source, 2020-2024
    • Absolute $ Opportunity Analysis By Source, 2025-2035
  8. Global Clean Labelled Food Additives Market Analysis 2020-2024 and Forecast 2025-2035, By Form
    • Introduction / Key Findings
    • Historical Market Size Value (USD Mn) Analysis By Form, 2020-2024
    • Current and Future Market Size Value (USD Mn) Analysis and Forecast By Form, 2025-2035
      • Dry/powder
      • Liquid
      • Others
    • Y-o-Y Growth Trend Analysis By Form, 2020-2024
    • Absolute $ Opportunity Analysis By Form, 2025-2035
  9. Global Clean Labelled Food Additives Market Analysis 2020-2024 and Forecast 2025-2035, By Certification
    • Introduction / Key Findings
    • Historical Market Size Value (USD Mn) Analysis By Certification, 2020-2024
    • Current and Future Market Size Value (USD Mn) Analysis and Forecast By Certification, 2025-2035
      • Organic
      • Non-GMO
      • Natural
      • Clean label certified
      • Others
    • Y-o-Y Growth Trend Analysis By Certification, 2020-2024
    • Absolute $ Opportunity Analysis By Certification, 2025-2035
  10. Global Clean Labelled Food Additives Market Analysis 2020-2024 and Forecast 2025-2035, By End Use
    • Introduction / Key Findings
    • Historical Market Size Value (USD Mn) Analysis By End Use, 2020-2024
    • Current and Future Market Size Value (USD Mn) Analysis and Forecast By End Use, 2025-2035
      • Bakery & confectionery
      • Beverages
      • Dairy & frozen
      • Processed foods
      • Sauces & condiments
      • Snacks & convenience
      • Meat, poultry & Seafood
      • Others
    • Y-o-Y Growth Trend Analysis By End Use, 2020-2024
    • Absolute $ Opportunity Analysis By End Use, 2025-2035
  11. Global Clean Labelled Food Additives Market Analysis 2020-2024 and Forecast 2025-2035, By Functionality
    • Introduction / Key Findings
    • Historical Market Size Value (USD Mn) Analysis By Functionality, 2020-2024
    • Current and Future Market Size Value (USD Mn) Analysis and Forecast By Functionality, 2025-2035
      • Preservation
      • Texture modification
      • Flavor/color enhancement
      • Emulsification
      • Sweetening
      • Others
    • Y-o-Y Growth Trend Analysis By Functionality, 2020-2024
    • Absolute $ Opportunity Analysis By Functionality, 2025-2035
  12. Global Clean Labelled Food Additives Market Analysis 2020-2024 and Forecast 2025-2035, By Consumer
    • Introduction / Key Findings
    • Historical Market Size Value (USD Mn) Analysis By Consumer, 2020-2024
    • Current and Future Market Size Value (USD Mn) Analysis and Forecast By Consumer, 2025-2035
      • Conventional product
      • Premium product
      • Health & wellness product
      • Children’s products
      • Others
    • Y-o-Y Growth Trend Analysis By Consumer, 2020-2024
    • Absolute $ Opportunity Analysis By Consumer, 2025-2035
  13. Global Clean Labelled Food Additives Market Analysis 2020-2024 and Forecast 2025-2035, By Region
    • Introduction
    • Historical Market Size Value (USD Mn) Analysis By Region, 2020-2024
    • Current Market Size Value (USD Mn) Analysis and Forecast By Region, 2025-2035
      • North America
      • Latin America
      • Western Europe
      • Eastern Europe
      • East Asia
      • South Asia and Pacific
      • Middle East & Africa
    • Market Attractiveness Analysis By Region
  14. North America Clean Labelled Food Additives Market Analysis 2020-2024 and Forecast 2025-2035, By Country
    • Historical Market Size Value (USD Mn) Trend Analysis By Market Taxonomy, 2020-2024
    • Market Size Value (USD Mn) Forecast By Market Taxonomy, 2025-2035
      • By Country
        • USA
        • Canada
        • Mexico
      • By Ingredient Type
      • By Source
      • By Form
      • By Certification
      • By End Use
      • By Functionality
      • By Consumer
    • Market Attractiveness Analysis
      • By Country
      • By Ingredient Type
      • By Source
      • By Form
      • By Certification
      • By End Use
      • By Functionality
      • By Consumer
    • Key Takeaways
  15. Latin America Clean Labelled Food Additives Market Analysis 2020-2024 and Forecast 2025-2035, By Country
    • Historical Market Size Value (USD Mn) Trend Analysis By Market Taxonomy, 2020-2024
    • Market Size Value (USD Mn) Forecast By Market Taxonomy, 2025-2035
      • By Country
        • Brazil
        • Chile
        • Rest of Latin America
      • By Ingredient Type
      • By Source
      • By Form
      • By Certification
      • By End Use
      • By Functionality
      • By Consumer
    • Market Attractiveness Analysis
      • By Country
      • By Ingredient Type
      • By Source
      • By Form
      • By Certification
      • By End Use
      • By Functionality
      • By Consumer
    • Key Takeaways
  16. Western Europe Clean Labelled Food Additives Market Analysis 2020-2024 and Forecast 2025-2035, By Country
    • Historical Market Size Value (USD Mn) Trend Analysis By Market Taxonomy, 2020-2024
    • Market Size Value (USD Mn) Forecast By Market Taxonomy, 2025-2035
      • By Country
        • Germany
        • UK
        • Italy
        • Spain
        • France
        • Nordic
        • BENELUX
        • Rest of Western Europe
      • By Ingredient Type
      • By Source
      • By Form
      • By Certification
      • By End Use
      • By Functionality
      • By Consumer
    • Market Attractiveness Analysis
      • By Country
      • By Ingredient Type
      • By Source
      • By Form
      • By Certification
      • By End Use
      • By Functionality
      • By Consumer
    • Key Takeaways
  17. Eastern Europe Clean Labelled Food Additives Market Analysis 2020-2024 and Forecast 2025-2035, By Country
    • Historical Market Size Value (USD Mn) Trend Analysis By Market Taxonomy, 2020-2024
    • Market Size Value (USD Mn) Forecast By Market Taxonomy, 2025-2035
      • By Country
        • Russia
        • Poland
        • Hungary
        • Balkan & Baltic
        • Rest of Eastern Europe
      • By Ingredient Type
      • By Source
      • By Form
      • By Certification
      • By End Use
      • By Functionality
      • By Consumer
    • Market Attractiveness Analysis
      • By Country
      • By Ingredient Type
      • By Source
      • By Form
      • By Certification
      • By End Use
      • By Functionality
      • By Consumer
    • Key Takeaways
  18. East Asia Clean Labelled Food Additives Market Analysis 2020-2024 and Forecast 2025-2035, By Country
    • Historical Market Size Value (USD Mn) Trend Analysis By Market Taxonomy, 2020-2024
    • Market Size Value (USD Mn) Forecast By Market Taxonomy, 2025-2035
      • By Country
        • China
        • Japan
        • South Korea
      • By Ingredient Type
      • By Source
      • By Form
      • By Certification
      • By End Use
      • By Functionality
      • By Consumer
    • Market Attractiveness Analysis
      • By Country
      • By Ingredient Type
      • By Source
      • By Form
      • By Certification
      • By End Use
      • By Functionality
      • By Consumer
    • Key Takeaways
  19. South Asia and Pacific Clean Labelled Food Additives Market Analysis 2020-2024 and Forecast 2025-2035, By Country
    • Historical Market Size Value (USD Mn) Trend Analysis By Market Taxonomy, 2020-2024
    • Market Size Value (USD Mn) Forecast By Market Taxonomy, 2025-2035
      • By Country
        • India
        • ASEAN
        • Australia & New Zealand
        • Rest of South Asia and Pacific
      • By Ingredient Type
      • By Source
      • By Form
      • By Certification
      • By End Use
      • By Functionality
      • By Consumer
    • Market Attractiveness Analysis
      • By Country
      • By Ingredient Type
      • By Source
      • By Form
      • By Certification
      • By End Use
      • By Functionality
      • By Consumer
    • Key Takeaways
  20. Middle East & Africa Clean Labelled Food Additives Market Analysis 2020-2024 and Forecast 2025-2035, By Country
    • Historical Market Size Value (USD Mn) Trend Analysis By Market Taxonomy, 2020-2024
    • Market Size Value (USD Mn) Forecast By Market Taxonomy, 2025-2035
      • By Country
        • Kingdom of Saudi Arabia
        • Other GCC Countries
        • Turkiye
        • South Africa
        • Other African Union
        • Rest of Middle East & Africa
      • By Ingredient Type
      • By Source
      • By Form
      • By Certification
      • By End Use
      • By Functionality
      • By Consumer
    • Market Attractiveness Analysis
      • By Country
      • By Ingredient Type
      • By Source
      • By Form
      • By Certification
      • By End Use
      • By Functionality
      • By Consumer
    • Key Takeaways
  21. Key Countries Clean Labelled Food Additives Market Analysis
    • USA
      • Pricing Analysis
      • Market Share Analysis, 2024
        • By Ingredient Type
        • By Source
        • By Form
        • By Certification
        • By End Use
        • By Functionality
        • By Consumer
    • Canada
      • Pricing Analysis
      • Market Share Analysis, 2024
        • By Ingredient Type
        • By Source
        • By Form
        • By Certification
        • By End Use
        • By Functionality
        • By Consumer
    • Mexico
      • Pricing Analysis
      • Market Share Analysis, 2024
        • By Ingredient Type
        • By Source
        • By Form
        • By Certification
        • By End Use
        • By Functionality
        • By Consumer
    • Brazil
      • Pricing Analysis
      • Market Share Analysis, 2024
        • By Ingredient Type
        • By Source
        • By Form
        • By Certification
        • By End Use
        • By Functionality
        • By Consumer
    • Chile
      • Pricing Analysis
      • Market Share Analysis, 2024
        • By Ingredient Type
        • By Source
        • By Form
        • By Certification
        • By End Use
        • By Functionality
        • By Consumer
    • Germany
      • Pricing Analysis
      • Market Share Analysis, 2024
        • By Ingredient Type
        • By Source
        • By Form
        • By Certification
        • By End Use
        • By Functionality
        • By Consumer
    • UK
      • Pricing Analysis
      • Market Share Analysis, 2024
        • By Ingredient Type
        • By Source
        • By Form
        • By Certification
        • By End Use
        • By Functionality
        • By Consumer
    • Italy
      • Pricing Analysis
      • Market Share Analysis, 2024
        • By Ingredient Type
        • By Source
        • By Form
        • By Certification
        • By End Use
        • By Functionality
        • By Consumer
    • Spain
      • Pricing Analysis
      • Market Share Analysis, 2024
        • By Ingredient Type
        • By Source
        • By Form
        • By Certification
        • By End Use
        • By Functionality
        • By Consumer
    • France
      • Pricing Analysis
      • Market Share Analysis, 2024
        • By Ingredient Type
        • By Source
        • By Form
        • By Certification
        • By End Use
        • By Functionality
        • By Consumer
    • India
      • Pricing Analysis
      • Market Share Analysis, 2024
        • By Ingredient Type
        • By Source
        • By Form
        • By Certification
        • By End Use
        • By Functionality
        • By Consumer
    • ASEAN
      • Pricing Analysis
      • Market Share Analysis, 2024
        • By Ingredient Type
        • By Source
        • By Form
        • By Certification
        • By End Use
        • By Functionality
        • By Consumer
    • Australia & New Zealand
      • Pricing Analysis
      • Market Share Analysis, 2024
        • By Ingredient Type
        • By Source
        • By Form
        • By Certification
        • By End Use
        • By Functionality
        • By Consumer
    • China
      • Pricing Analysis
      • Market Share Analysis, 2024
        • By Ingredient Type
        • By Source
        • By Form
        • By Certification
        • By End Use
        • By Functionality
        • By Consumer
    • Japan
      • Pricing Analysis
      • Market Share Analysis, 2024
        • By Ingredient Type
        • By Source
        • By Form
        • By Certification
        • By End Use
        • By Functionality
        • By Consumer
    • South Korea
      • Pricing Analysis
      • Market Share Analysis, 2024
        • By Ingredient Type
        • By Source
        • By Form
        • By Certification
        • By End Use
        • By Functionality
        • By Consumer
    • Russia
      • Pricing Analysis
      • Market Share Analysis, 2024
        • By Ingredient Type
        • By Source
        • By Form
        • By Certification
        • By End Use
        • By Functionality
        • By Consumer
    • Poland
      • Pricing Analysis
      • Market Share Analysis, 2024
        • By Ingredient Type
        • By Source
        • By Form
        • By Certification
        • By End Use
        • By Functionality
        • By Consumer
    • Hungary
      • Pricing Analysis
      • Market Share Analysis, 2024
        • By Ingredient Type
        • By Source
        • By Form
        • By Certification
        • By End Use
        • By Functionality
        • By Consumer
    • Kingdom of Saudi Arabia
      • Pricing Analysis
      • Market Share Analysis, 2024
        • By Ingredient Type
        • By Source
        • By Form
        • By Certification
        • By End Use
        • By Functionality
        • By Consumer
    • Turkiye
      • Pricing Analysis
      • Market Share Analysis, 2024
        • By Ingredient Type
        • By Source
        • By Form
        • By Certification
        • By End Use
        • By Functionality
        • By Consumer
    • South Africa
      • Pricing Analysis
      • Market Share Analysis, 2024
        • By Ingredient Type
        • By Source
        • By Form
        • By Certification
        • By End Use
        • By Functionality
        • By Consumer
  22. Market Structure Analysis
    • Competition Dashboard
    • Competition Benchmarking
    • Market Share Analysis of Top Players
      • By Regional
      • By Ingredient Type
      • By Source
      • By Form
      • By Certification
      • By End Use
      • By Functionality
      • By Consumer
  23. Competition Analysis
    • Competition Deep Dive
      • Kerry Group plc
        • Overview
        • Product Portfolio
        • Profitability by Market Segments (Product/Age /Sales Channel/Region)
        • Sales Footprint
        • Strategy Overview
          • Marketing Strategy
          • Product Strategy
          • Channel Strategy
      • ADM (Archer Daniels Midland)
      • Cargill, Incorporated
      • DSM
      • IFF (International F&F Inc.)
      • BASF SE
      • Ingredion Incorporated
      • Sensient Technologies
      • Corbion
      • Symrise
  24. Assumptions & Acronyms Used
  25. Research Methodology

List of Tables

  • Table 1: Global Clean Labelled Food Additives Market Value (USD Mn) Forecast by Region, 2020-2035
  • Table 2: Global Clean Labelled Food Additives Market Value (USD Mn) Forecast by Ingredient Type , 2020-2035
  • Table 3: Global Clean Labelled Food Additives Market Value (USD Mn) Forecast by Source, 2020-2035
  • Table 4: Global Clean Labelled Food Additives Market Value (USD Mn) Forecast by Form, 2020-2035
  • Table 5: Global Clean Labelled Food Additives Market Value (USD Mn) Forecast by Certification, 2020-2035
  • Table 6: Global Clean Labelled Food Additives Market Value (USD Mn) Forecast by End Use, 2020-2035
  • Table 7: Global Clean Labelled Food Additives Market Value (USD Mn) Forecast by Functionality, 2020-2035
  • Table 8: Global Clean Labelled Food Additives Market Value (USD Mn) Forecast by Consumer, 2020-2035
  • Table 9: North America Clean Labelled Food Additives Market Value (USD Mn) Forecast by Country, 2020-2035
  • Table 10: North America Clean Labelled Food Additives Market Value (USD Mn) Forecast by Ingredient Type , 2020-2035
  • Table 11: North America Clean Labelled Food Additives Market Value (USD Mn) Forecast by Source, 2020-2035
  • Table 12: North America Clean Labelled Food Additives Market Value (USD Mn) Forecast by Form, 2020-2035
  • Table 13: North America Clean Labelled Food Additives Market Value (USD Mn) Forecast by Certification, 2020-2035
  • Table 14: North America Clean Labelled Food Additives Market Value (USD Mn) Forecast by End Use, 2020-2035
  • Table 15: North America Clean Labelled Food Additives Market Value (USD Mn) Forecast by Functionality, 2020-2035
  • Table 16: North America Clean Labelled Food Additives Market Value (USD Mn) Forecast by Consumer, 2020-2035
  • Table 17: Latin America Clean Labelled Food Additives Market Value (USD Mn) Forecast by Country, 2020-2035
  • Table 18: Latin America Clean Labelled Food Additives Market Value (USD Mn) Forecast by Ingredient Type , 2020-2035
  • Table 19: Latin America Clean Labelled Food Additives Market Value (USD Mn) Forecast by Source, 2020-2035
  • Table 20: Latin America Clean Labelled Food Additives Market Value (USD Mn) Forecast by Form, 2020-2035
  • Table 21: Latin America Clean Labelled Food Additives Market Value (USD Mn) Forecast by Certification, 2020-2035
  • Table 22: Latin America Clean Labelled Food Additives Market Value (USD Mn) Forecast by End Use, 2020-2035
  • Table 23: Latin America Clean Labelled Food Additives Market Value (USD Mn) Forecast by Functionality, 2020-2035
  • Table 24: Latin America Clean Labelled Food Additives Market Value (USD Mn) Forecast by Consumer, 2020-2035
  • Table 25: Western Europe Clean Labelled Food Additives Market Value (USD Mn) Forecast by Country, 2020-2035
  • Table 26: Western Europe Clean Labelled Food Additives Market Value (USD Mn) Forecast by Ingredient Type , 2020-2035
  • Table 27: Western Europe Clean Labelled Food Additives Market Value (USD Mn) Forecast by Source, 2020-2035
  • Table 28: Western Europe Clean Labelled Food Additives Market Value (USD Mn) Forecast by Form, 2020-2035
  • Table 29: Western Europe Clean Labelled Food Additives Market Value (USD Mn) Forecast by Certification, 2020-2035
  • Table 30: Western Europe Clean Labelled Food Additives Market Value (USD Mn) Forecast by End Use, 2020-2035
  • Table 31: Western Europe Clean Labelled Food Additives Market Value (USD Mn) Forecast by Functionality, 2020-2035
  • Table 32: Western Europe Clean Labelled Food Additives Market Value (USD Mn) Forecast by Consumer, 2020-2035
  • Table 33: Eastern Europe Clean Labelled Food Additives Market Value (USD Mn) Forecast by Country, 2020-2035
  • Table 34: Eastern Europe Clean Labelled Food Additives Market Value (USD Mn) Forecast by Ingredient Type , 2020-2035
  • Table 35: Eastern Europe Clean Labelled Food Additives Market Value (USD Mn) Forecast by Source, 2020-2035
  • Table 36: Eastern Europe Clean Labelled Food Additives Market Value (USD Mn) Forecast by Form, 2020-2035
  • Table 37: Eastern Europe Clean Labelled Food Additives Market Value (USD Mn) Forecast by Certification, 2020-2035
  • Table 38: Eastern Europe Clean Labelled Food Additives Market Value (USD Mn) Forecast by End Use, 2020-2035
  • Table 39: Eastern Europe Clean Labelled Food Additives Market Value (USD Mn) Forecast by Functionality, 2020-2035
  • Table 40: Eastern Europe Clean Labelled Food Additives Market Value (USD Mn) Forecast by Consumer, 2020-2035
  • Table 41: East Asia Clean Labelled Food Additives Market Value (USD Mn) Forecast by Country, 2020-2035
  • Table 42: East Asia Clean Labelled Food Additives Market Value (USD Mn) Forecast by Ingredient Type , 2020-2035
  • Table 43: East Asia Clean Labelled Food Additives Market Value (USD Mn) Forecast by Source, 2020-2035
  • Table 44: East Asia Clean Labelled Food Additives Market Value (USD Mn) Forecast by Form, 2020-2035
  • Table 45: East Asia Clean Labelled Food Additives Market Value (USD Mn) Forecast by Certification, 2020-2035
  • Table 46: East Asia Clean Labelled Food Additives Market Value (USD Mn) Forecast by End Use, 2020-2035
  • Table 47: East Asia Clean Labelled Food Additives Market Value (USD Mn) Forecast by Functionality, 2020-2035
  • Table 48: East Asia Clean Labelled Food Additives Market Value (USD Mn) Forecast by Consumer, 2020-2035
  • Table 49: South Asia and Pacific Clean Labelled Food Additives Market Value (USD Mn) Forecast by Country, 2020-2035
  • Table 50: South Asia and Pacific Clean Labelled Food Additives Market Value (USD Mn) Forecast by Ingredient Type , 2020-2035
  • Table 51: South Asia and Pacific Clean Labelled Food Additives Market Value (USD Mn) Forecast by Source, 2020-2035
  • Table 52: South Asia and Pacific Clean Labelled Food Additives Market Value (USD Mn) Forecast by Form, 2020-2035
  • Table 53: South Asia and Pacific Clean Labelled Food Additives Market Value (USD Mn) Forecast by Certification, 2020-2035
  • Table 54: South Asia and Pacific Clean Labelled Food Additives Market Value (USD Mn) Forecast by End Use, 2020-2035
  • Table 55: South Asia and Pacific Clean Labelled Food Additives Market Value (USD Mn) Forecast by Functionality, 2020-2035
  • Table 56: South Asia and Pacific Clean Labelled Food Additives Market Value (USD Mn) Forecast by Consumer, 2020-2035
  • Table 57: Middle East & Africa Clean Labelled Food Additives Market Value (USD Mn) Forecast by Country, 2020-2035
  • Table 58: Middle East & Africa Clean Labelled Food Additives Market Value (USD Mn) Forecast by Ingredient Type , 2020-2035
  • Table 59: Middle East & Africa Clean Labelled Food Additives Market Value (USD Mn) Forecast by Source, 2020-2035
  • Table 60: Middle East & Africa Clean Labelled Food Additives Market Value (USD Mn) Forecast by Form, 2020-2035
  • Table 61: Middle East & Africa Clean Labelled Food Additives Market Value (USD Mn) Forecast by Certification, 2020-2035
  • Table 62: Middle East & Africa Clean Labelled Food Additives Market Value (USD Mn) Forecast by End Use, 2020-2035
  • Table 63: Middle East & Africa Clean Labelled Food Additives Market Value (USD Mn) Forecast by Functionality, 2020-2035
  • Table 64: Middle East & Africa Clean Labelled Food Additives Market Value (USD Mn) Forecast by Consumer, 2020-2035

List of Figures

  • Figure 1: Global Clean Labelled Food Additives Market Pricing Analysis
  • Figure 2: Global Clean Labelled Food Additives Market Value (USD Mn) Forecast 2020–2035
  • Figure 3: Global Clean Labelled Food Additives Market Value (USD Mn) Share and BPS Analysis by Region, 2025 and 2035
  • Figure 4: Global Clean Labelled Food Additives Market Y-o-Y Growth Comparison by Region, 2025–2035
  • Figure 5: Global Clean Labelled Food Additives Market Attractiveness Analysis by Region
  • Figure 6: North America Clean Labelled Food Additives Market Incremental Dollar Opportunity, 2025–2035
  • Figure 7: Latin America Clean Labelled Food Additives Market Incremental Dollar Opportunity, 2025–2035
  • Figure 8: Western Europe Clean Labelled Food Additives Market Incremental Dollar Opportunity, 2025–2035
  • Figure 9: Eastern Europe Clean Labelled Food Additives Market Incremental Dollar Opportunity, 2025–2035
  • Figure 10: East Asia Clean Labelled Food Additives Market Incremental Dollar Opportunity, 2025–2035
  • Figure 11: South Asia and Pacific Clean Labelled Food Additives Market Incremental Dollar Opportunity, 2025–2035
  • Figure 12: Middle East & Africa Clean Labelled Food Additives Market Incremental Dollar Opportunity, 2025–2035
  • Figure 13: North America Clean Labelled Food Additives Market Value Share and BPS Analysis by Country, 2025 and 2035
  • Figure 14: Latin America Clean Labelled Food Additives Market Value Share and BPS Analysis by Country, 2025 and 2035
  • Figure 15: Western Europe Clean Labelled Food Additives Market Value Share and BPS Analysis by Country, 2025 and 2035
  • Figure 16: Eastern Europe Clean Labelled Food Additives Market Value Share and BPS Analysis by Country, 2025 and 2035
  • Figure 17: East Asia Clean Labelled Food Additives Market Value Share and BPS Analysis by Country, 2025 and 2035
  • Figure 18: South Asia and Pacific Clean Labelled Food Additives Market Value Share and BPS Analysis by Country, 2025 and 2035
  • Figure 19: Middle East & Africa Clean Labelled Food Additives Market Value Share and BPS Analysis by Country, 2025 and 2035
  • Figure 20: Global Clean Labelled Food Additives Market – Tier Structure Analysis
  • Figure 21: Global Clean Labelled Food Additives Market – Company Share Analysis

Frequently Asked Questions

How big is the clean labelled food additives market in 2025?

The global clean labelled food additives market is estimated to be valued at USD 47.9 billion in 2025.

What will be the size of clean labelled food additives market in 2035?

The market size for the clean labelled food additives market is projected to reach USD 84.2 billion by 2035.

How much will be the clean labelled food additives market growth between 2025 and 2035?

The clean labelled food additives market is expected to grow at a 5.8% CAGR between 2025 and 2035.

What are the key product types in the clean labelled food additives market?

The key product types in clean labelled food additives market are natural flavors, natural colors, natural preservatives, natural sweeteners, hydrocolloids and texturizers, functional native starches, natural emulsifiers and other.

Which source segment to contribute significant share in the clean labelled food additives market in 2025?

In terms of source, plant-based segment to command 42.6% share in the clean labelled food additives market in 2025.

Explore Similar Insights

Future Market Insights

Clean Labelled Food Additives Market