Codeless Testing Market
Market Insights on Codeless Testing covering sales outlook, demand forecast & up-to-date key trends
Codeless Testing Market By Solution (Codeless Testing Tools, Services), Application (API Testing, Mobile App, Desktop App, Web App), Enterprise Size (Small and Medium Enterprises, Large Enterprises), Industry (IT & Telecom, BFSI, Retail, Healthcare, Government, Education, Manufacturing, Travel & Hospitality) & Region - Forecast to 2021 - 2031
Codeless Testing Market Snapshot
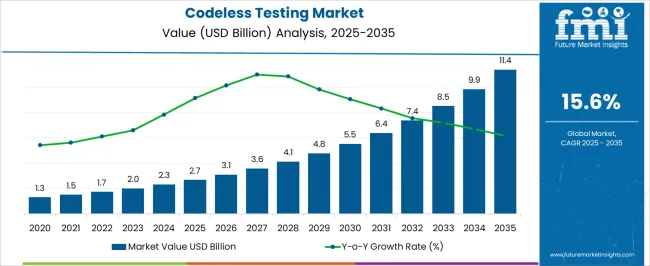
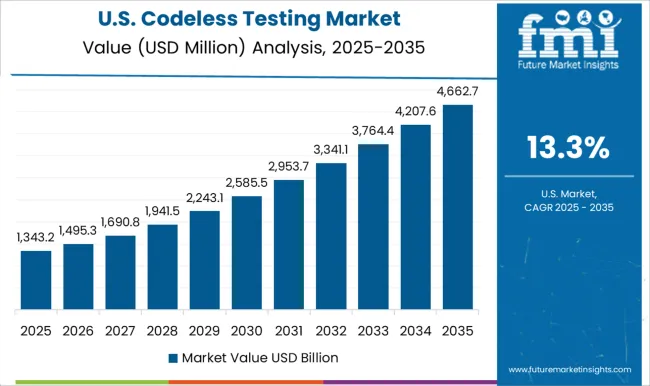
The codeless testing market will register exponential growth in 2021 and beyond, with the overall valuation estimated to reach US$ 1.5 Bn in 2021. Future Market Insights (FMI) projects codeless testing demand to increase at 15.5% CAGR between 2021 and 2031.
Following the onset of the COVID-19 crisis, the demand for codeless testing for remote operational applications will surge through 2021. The study also forecasts desktop applications of codeless testing to account for 36.9% of market share in 2021, while API testing applications are set to register relatively faster growth at 18.6% CAGR through the end of 2031.
Let us know your requirement to get
100% FREE customization
Key Points Covered in Codeless Testing Market Study
- Market estimates and forecast 2016-2031
- Key drivers and restraints impacting market growth
- Segment-wise, Country-wise, and Region-wise Analysis
- Competition Mapping and Benchmarking
- Market Share Analysis
- Key Product Innovations and Regulatory Climate
- COVID-19 Impact on Codeless Testing Market and how to Navigate
- Recommendation on Key Winning Strategies
2016-2020 Codeless Testing Market Outlook Compared to 2021-2031 Forecast
The demand for codeless testing will rise at 15.5% CAGR between 2021 and 2031 in comparison to the 10.6% CAGR registered during 2016-2020. Most software testing companies have come a long way, from manual testing to mostly automated testing methods.
Testers can now automate test cases without any coding knowledge, rather than spending a lot of time on writing scripts, by using sophisticated and computer assisted coding software. In addition, codeless/script-less testing tools allow users to automate swiftly through reusable tests by enabling testers with minimal exposure to test automation.
The factors responsible for rapid growth of codeless testing tools include the easy evaluation of code by non-technical team members, the reduction of time that testers spend on recurring test cases, which will bolster demand for codeless testing in the near future.
The shift towards codeless testing has been widely driven by advent of Machine Learning (ML), machine learning as a services, and Artificial Intelligence (AI). AI is being used in all aspects of testing, including codeless automation testing, performance testing, regression testing, and functional testing. Over the past few years, AI and ML has been gaining importance, as it reduces the test lifecycle. These advanced technologies help to increase the ROI of software testing firms.
How are Increasing Investments in Artificial Intelligence Impacting Market Growth?
Codeless testing solutions are characterized on technologies including DevOps, the Internet of Things (IoT), and AI. Rising investments in artificial intelligence technology is estimated to create growth opporunities for codeless testing as it has the ability to create test cases based on actual user data and to learn from different user flows.
Thus, helping test engineers to reduce the time spent on creating new test data as AI automates test cases based on actual user data, is a major factor for companies to opt for codeless testing solutions.
Replacing static locators with dynamic locators is projected to make testing software stable, due to which execution and authoring of tests run at high speed. This helps to increase test handling cases and to make automated tests much more effective.
In October 2019, IBM Corporation, announced that the company has released its Auto AI. It is a new set of competencies for its flagship product “Watson Studio”. Such new capabilities are designed for automating several of the monotonous and complex activities associated with optimizing, designing, and governing AI in the company.
Find your sweet spots for generating winning opportunities in this market.
Talk to AnalystWhat is the Impact of the COVID-19 Crisis on the Codeless Testing Market?
The COVID-19 pandemic has made automation coupled with testing a trending platform as companies take risks and expand business continuity plans. In May 2020, IBM Corporation had launched a comprehensive range of new AI-powered services designed to help enterprises in reducing the total costs of ownership and automation to survive upcoming disruptions.
At the time of the COVID-19 pandemic situation, major vendors operating in the market focused on automating IT operations to recover from the crisis. Companies will invest more in robotic process automation (RPA), artificial intelligence, and cognitive capabilities as businesses recover from the pandemic.
Country-wise Insights
How is the Codeless Testing Market Faring in the U.S.?
According to the study, the U.S. is expected to account for over 79% of the North America market through 2031. North America is predicted to remain one of the most attractive markets during the forecast period. This is contributed by major developments in the U.S. market for codeless testing.
For instance, in August 2019, Tricentis, which has a significant presence in the U.S., acquired TestProject, a community-powered automation testing platform designed for agile teams. As part of the commitment to TestProject, Tricentis plans to extend the community, help software testers enable the best Android and iOS test automation practices, while investing in research and development (R&D) to develop advanced products augmenting demand for codeless testing.
Why is the Demand for Codeless Testing Increasing in the U.K.?
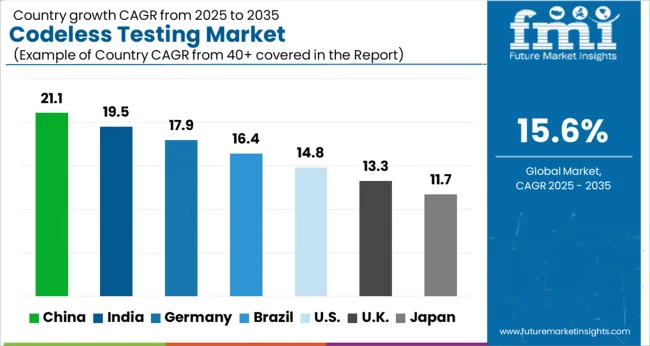
Demand in the U.K. market is expected to rise at nearly 16% CAGR over the forecast period. Over the coming decade, the software testing services industry is expected to continue growing strongly.
Increasing software investment among U.K. businesses and the continuing expansion of service offerings within the industry are expected to facilitate demand for codeless testing tools.
Furthermore, IT adoption is expected to continue to expand, although at a much slower rate, which will likely encourage investment in information technology infrastructure and further generate industry demand.
As per the report, the U.K. is recognized as a primary market, and it is expected to continue exhibiting high demand for codeless testing through the forecast period.
How is China Contributing Towards Codeless Testing Sales?
By 2031, China will account for over 44% of sales of codeless testing solutions in East Asia. China is the fastest-growing economy and is expected to offer a favorable market for codeless testing vendors.
The country is witnessing accelerated growth of digital transformation and rapidly increasing connectivity. The country also has many established SMEs, which are growing at an exponential rate to cater to their large customer base, which will create a conducive environment for long-term growth.

An unified Market Research Subscription Platform, built for today’s disparate research needs.
Category-wise Insights
Why is the Demand for Codeless Testing Tools on the Rise?
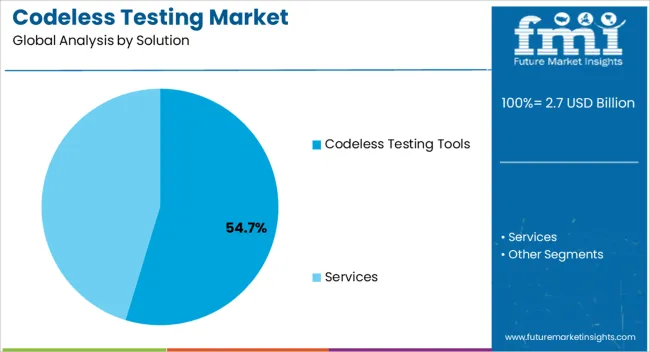
Based on solution, codeless testing tools are the leading segment, accounting for nearly 59.5% of the market in 2021. The growing adoption of cloud-based automation and testing is analyzed to be one of the major drivers for codeless testing solutions.
Cloud based automation tools are cost effective, agile, and scalable owing to which these tools are witnessing significant adoption in SMEs and start-ups. Apart from this, the integration of machine learning and artificial intelligence in codeless testing tools is easing usage, which is also set to assist market growth during 2021-2031.
Software testers prefer codeless test automation as a critical component when it comes to the agile development procedure. These elements are estimated to create new growth avenues for codeless testing tools, during the forecast period.
How API Testing is Projected to Create Demand?
API testing application of codeless testing is estimated to account for a growth of 18.6% CAGR through 2031. In the software testing industry, API testing is becoming a subject of discussion and is central to software development. API codeless testing is now recommended at various stages of the product development.
It involves testing application programming interfaces (APIs) directly and as a part of integration testing in order to determine if they meet expectations regarding functionality, reliability, performance, and security.
API testing offers a number of advantages including finding bugs in a time-efficient manner. Once the logic is designed, tests can be built for validating the correctness in data and responses with API testing.
How are Large Enterprises Likely to Influence Demand?
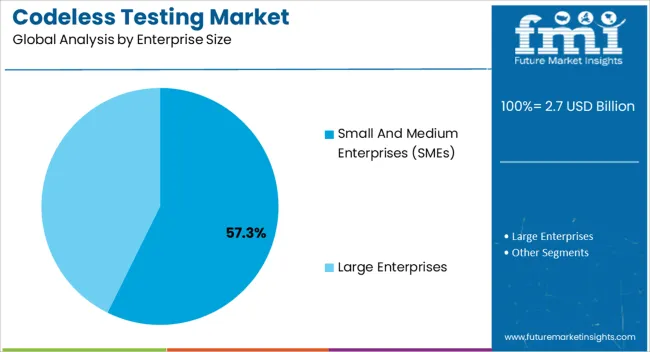
The large enterprises segment is estimated to hold the largest revenue share of more than 60% in 2021. The increasing preference among enterprises for efficient testing solutions and automation capabilities is expected to drive the demand for codeless testing in the large enterprise segment.
Furthermore, the growing emphasis on strategic decision-making and resource allocation is expected to further drive the growth of the large enterprise segment in the market.
Why Does the IT and Telecom Segment Hold Major Value Share?
The IT and telecom sector is expected to contribute maximum share of more than 24% in terms of global demand for codeless testing in 2021. With the help of codeless testing, IT and telecom organizations can gain quick feedback on the mainframe, and supercharge innovation without the risk of bottlenecks that disrupt operations, hinder customer experiences, or impacting revenues.
Enterprises can improve quality, velocity, and efficiency on the mainframe while lowering the problems of shortage of experienced developers, thereby contributing significantly to the development of codeless testing solutions.
Competitive Landscape
Companies operating in the codeless testing market are aiming at product innovation and strategic partnerships with other manufacturers to expand their portfolio and production capacity to meet the demand of an expanding customer pool.
- For instance, in March 2021, Ranorex GmbH introduced the latest version of Ranorex Studio 9.5. This release includes features such as reports merger and custom run test names. Ranorex Studio uses world-class UI object recognition across a variety of platforms. The company also has a powerful API that allows more flexibility for teams who prefer to code their automated tests.
- In February 2021, Mabl announced the beta release of their new native desktop application bolstering SaaS solution portfolios that enable high-velocity software teams to accelerate innovation while achieving exceptional quality engineering.
Manufacturers are also focusing on mergers and acquisitions to maintain global presence.
- For instance, in March 2021, Tricentis acquired Neotys. With this acquisition, Tricentis expanded its AI-driven, end-to-end continuous testing platform to offer a comprehensive testing solution to accelerate software delivery and innovation.
Scope of Report
Attribute |
Details |
Forecast Period |
2021-2031 |
Historical Data Available for |
2016-2020 |
Market Analysis |
USD Million for Value |
Key Countries Covered |
US, Canada, Germany, U.K., France, Italy, Spain, Russia, China, Japan, South Korea, India, ASEAN, Australia & New Zealand, GCC Countries, Turkey, and South Africa |
Key Segments Covered |
Solution, Application, Enterprise Size, Industry, and Region |
Key Companies Profiled |
|
Report Coverage |
Market Forecast, Company Share Analysis, Competition Intelligence, DROT Analysis, Market Dynamics and Challenges, and Strategic Growth Initiatives |
Customization & Pricing |
Available upon Request |
Codeless Testing Market by Category
By Solution:
- Codeless Testing Tools
- Services
- Testing & QA Services
- Consulting Services
- Integration & Implementation
- Support & Maintenance
By Application:
- API Testing
- Mobile App
- Desktop App
- Web App
By Enterprise Size:
- Small and Medium Enterprises (SMEs)
- Large Enterprises
By Industry:
- IT & Telecom
- BFSI
- Retail
- Healthcare
- Government
- Education
- Manufacturing
- Travel & Hospitality
- Media & Entertainment
- Others
By Region:
- North America
- Latin America
- Europe
- East Asia
- South Asia & Pacific
- Middle East and Africa (MEA)
Frequently Asked Questions
The codeless testing market was valued at ~US$ 1.5 Bn in 2021 and is estimated to grow at an exponential rate in the coming decade.
Desktop apps are currently the most attractive segment in the market, accounting for over 37% of revenue generated in 2020. However, API testing applications are expected to dominate the market share with over 40% through 2031.
Some of the leading companies in this landscape are Ranorex GmbH, Katalon, Inc., Mabl Inc., Usetrace, and Perforce Software, Inc. among others. As per FMI, nearly 50-55% of the market share is currently covered by the top 15-20 players.
The BFSI sector is expected to dominate the market over the forecast period, generating a revenue of US$ 1.6 Bn by 2031. However, applications in the healthcare sector are estimated to surge at a CAGR of nearly 20% over the forecast period.
The codeless testing market is expected to be valued at US$ 1.5 Bn by the end of 2021, and is likely to reach US$ 6.6 Bn by 2031.
The codeless testing market in last 5 years (2016 – 2020) grew by a CAGR of 10.6%.
Key trends in the market include, increasing demand for automated testing and strong demand for codeless testing tools for the upcoming decade.
The rising uptake of technologies such as agile and DevOps is increasing the requirement of QA solutions that can keep pace. Therefore, codeless testing tools and related services are estimated to register high demand during the forecast period.
The top 5 countries driving demand for codeless testing include the U.S., the U.K., India, China, and GCC countries.
North America is predicted to remain one of the most attractive markets during the forecast period. According to the study, the U.S. is expected to account for over 80% of the North America market through 2031.
The codeless testing market in Japan and South Korea is projected to register CAGR of 19.7% and 17.5% respectively between 2021 and 2031.
1. Executive Summary
1.1. Global Market Outlook
1.2. Demand Side Trends
1.3. Supply Side Trends
1.4. Analysis and Recommendations
2. Market Overview
2.1. Market Coverage / Taxonomy
2.2. Market Definition / Scope / Limitations
3. Key Market Trends
3.1. Key Trends Impacting the Market
3.2. Product Innovation / Development Trends
4. Codeless Testing Tools, Key Use Cases
4.1. How Codeless Testing Tool Helped a Business Banking Platform to Resolve Challenges Related to Manual Testing
4.2. Insurance Company Automated and Upgraded the Manual Testing using Codeless Testing Tool
4.3. Software Company Scaled QA & Reduce Regression Testing by using Codeless Testing Tool
4.4. Others
5. Pricing Analysis
5.1. Types of Pricing Models
5.1.1. Subscription-based Pricing ( Per User/Month)
5.1.2. Perpetual License (One Time License Fee)
5.2. Global Average Pricing Analysis Benchmark
6. COVID-19 Pandemic Crisis Impact Analysis
6.1. Impact of COVID-19 Pandemic Crisis on Codeless Testing Demand
6.1.1. Pre-COVID-19 Growth Analysis
6.1.2. Post-COVID-19 Impact Analysis
6.2. Expected Recovery Scenario (Short-term / Mid-term / Long-term)
6.3. Key Action Points for Codeless Testing Vendors
7. Key Features, Codeless Testing Tools
7.1. Integrations of ML or AI technologies
7.2. Complements code-based testing
7.3. Compatibility With Development Cycle Speed
7.4. Connects to Continuous Integration and Cloud
7.5. Others
8. Market Structure Analysis
8.1. Market Analysis by Tier of Companies
8.2. Market Share Analysis of Top Players
8.3. Market Presence Analysis
8.3.1. Regional footprint by Players
8.3.2. Solution footprint by Players
8.3.3. Channel footprint by Players
9. Global Codeless Testing Market Demand (in Value in US$ Mn) Analysis 2016-2020 and Forecast, 2021-2031
9.1. Historical Market Value (US$ Mn) Analysis, 2016-2020
9.2. Current and Future Market Value (US$ Mn) Projections, 2021-2031
9.2.1. Y-o-Y Growth Trend Analysis
9.2.2. Absolute $ Opportunity Analysis
10. Market Background
10.1. Macro-Economic Factors
10.1.1. Global GDP Growth Outlook
10.1.2. Worldwide ICT Spending
10.1.3. Global Internet Penetration Trends
10.1.4. Global IT Services Growth
10.2. Forecast Factors - Relevance & Impact
10.2.1. Historic Growth Rate of Codeless Testing Vendors
10.2.2. Impact of COVID-19 on Global Economic Growth
10.2.3. Rapid Adoption of Testing Platforms Among Industries
10.2.4. Technology Automation Trends
10.3. Value Chain
10.4. Market Dynamics
10.4.1. Drivers
10.4.2. Restraints
10.4.3. Opportunities
11. Global Codeless Testing Market Analysis 2016-2020 and Forecast 2021-2031, by Solution
11.1. Introduction / Key Findings
11.2. Historical Market Size (US$ Mn) Analysis By Solution, 2016 - 2020
11.3. Current and Future Market Size (US$ Mn) Analysis and Forecast By Solution, 2021 – 2031
11.3.1. Codeless Testing Tools
11.3.2. Services
11.3.2.1. Testing & QA Services
11.3.2.2. Consulting Services
11.3.2.3. Integration & Implementation
11.3.2.4. Support & Maintenance
11.4. Market Attractiveness Analysis By Solution
12. Global Codeless Testing Market Analysis 2016-2020 and Forecast 2021-2031, by Application
12.1. Introduction / Key Findings
12.2. Historical Market Size (US$ Mn) Analysis By Application, 2016 - 2020
12.3. Current and Future Market Size (US$ Mn) Analysis and Forecast By Application, 2021 - 2031
12.3.1. API Testing
12.3.2. Mobile App
12.3.3. Desktop App
12.3.4. Web App
12.4. Market Attractiveness Analysis By Application
13. Global Codeless Testing Market Analysis 2016-2020 and Forecast 2021-2031, By Enterprise Size
13.1. Introduction / Key Findings
13.2. Historical Market Size (US$ Mn) Analysis By Enterprise Size, 2016 - 2020
13.3. Current and Future Market Size (US$ Mn) Analysis and Forecast By Enterprise Size, 2021 - 2031
13.3.1. Small & Medium Enterprises (SMEs)
13.3.2. Large Enterprises
13.4. Market Attractiveness Analysis By Enterprise Size
14. Global Codeless Testing Market Analysis 2016-2020 and Forecast 2021-2031, By Industry
14.1. Introduction / Key Findings
14.2. Historical Market Size (US$ Mn) Analysis By Industry, 2016 - 2020
14.3. Current and Future Market Size (US$ Mn) Analysis and Forecast By Industry, 2021 - 2031
14.3.1. IT & Telecom
14.3.2. BFSI
14.3.3. Retail
14.3.4. Healthcare
14.3.5. Government
14.3.6. Education
14.3.7. Manufacturing
14.3.8. Travel & Hospitality
14.3.9. Media & Entertainment
14.3.10. Others
14.4. Market Attractiveness Analysis By Industry
15. Global Codeless Testing Market Analysis 2016-2020 and Forecast 2021-2031, by Region
15.1. Introduction / Key Findings
15.2. Historical Market Size (US$ Mn) Analysis By Region, 2016 - 2020
15.3. Current and Future Market Size (US$ Mn) Analysis and Forecast By Region, 2021 - 2031
15.3.1. North America
15.3.2. Latin America
15.3.3. Europe
15.3.4. East Asia
15.3.5. South Asia & Pacific
15.3.6. Middle East & Africa
15.4. Market Attractiveness Analysis By Region
16. North America Codeless Testing Market Analysis 2016-2020 and Forecast 2021-2031
16.1. Introduction
16.2. Historical Market Size (US$ Mn) Trend Analysis By Market Taxonomy, 2016 - 2020
16.3. Current and Future Market Size (US$ Mn) Forecast By Market Taxonomy, 2021 - 2031
16.3.1. By Solution
16.3.2. By Application
16.3.3. By Enterprise Size
16.3.4. By Industry
16.3.5. By Country
16.3.5.1. U.S.
16.3.5.2. Canada
16.4. Market Attractiveness Analysis
16.4.1. By Solution
16.4.2. By Application
16.4.3. By Enterprise Size
16.4.4. By Industry
16.4.5. By Country
16.5. Market Trends
16.6. Key Market Participants - Intensity Mapping
17. Latin America Codeless Testing Market Analysis 2016-2020 and Forecast 2021-2031
17.1. Introduction
17.2. Historical Market Size (US$ Mn) Trend Analysis By Market Taxonomy, 2016 - 2020
17.3. Current and Future Market Size (US$ Mn) Forecast By Market Taxonomy, 2021 - 2031
17.3.1. By Solution
17.3.2. By Application
17.3.3. By Enterprise Size
17.3.4. By Industry
17.3.5. By Country
17.3.5.1. Brazil
17.3.5.2. Mexico
17.3.5.3. Rest of Latin America
17.4. Market Attractiveness Analysis
17.4.1. By Solution
17.4.2. By Application
17.4.3. By Enterprise Size
17.4.4. By Industry
17.4.5. By Country
17.5. Market Trends
17.6. Key Market Participants - Intensity Mapping
18. Europe Codeless Testing Market Analysis 2016-2020 and Forecast 2021-2031
18.1. Introduction
18.2. Historical Market Size (US$ Mn) Trend Analysis By Market Taxonomy, 2016 - 2020
18.3. Current and Future Market Size (US$ Mn) Forecast By Market Taxonomy, 2021 - 2031
18.3.1. By Solution
18.3.2. By Application
18.3.3. By Enterprise Size
18.3.4. By Industry
18.3.5. By Country
18.3.5.1. Germany
18.3.5.2. Italy
18.3.5.3. France
18.3.5.4. U.K.
18.3.5.5. Spain
18.3.5.6. BENELUX
18.3.5.7. Russia
18.3.5.8. Rest of Europe
18.4. Market Attractiveness Analysis
18.4.1. By Solution
18.4.2. By Application
18.4.3. By Enterprise Size
18.4.4. By Industry
18.4.5. By Country
18.5. Market Trends
18.6. Key Market Participants - Intensity Mapping
19. East Asia Codeless Testing Market Analysis 2016-2020 and Forecast 2021-2031
19.1. Introduction
19.2. Historical Market Size (US$ Mn) Trend Analysis By Market Taxonomy, 2016 - 2020
19.3. Current and Future Market Size (US$ Mn) Forecast By Market Taxonomy, 2021 - 2031
19.3.1. By Solution
19.3.2. By Application
19.3.3. By Enterprise Size
19.3.4. By Industry
19.3.5. By Country
19.3.5.1. China
19.3.5.2. Japan
19.3.5.3. South Korea
19.4. Market Attractiveness Analysis
19.4.1. By Solution
19.4.2. By Application
19.4.3. By Enterprise Size
19.4.4. By Industry
19.4.5. By Country
19.5. Market Trends
19.6. Key Market Participants - Intensity Mapping
20. South Asia & Pacific Codeless Testing Market Analysis 2016-2020 and Forecast 2021-2031
20.1. Introduction
20.2. Historical Market Size (US$ Mn) Trend Analysis By Market Taxonomy, 2016 - 2020
20.3. Current and Future Market Size (US$ Mn) Forecast By Market Taxonomy, 2021 - 2031
20.3.1. By Solution
20.3.2. By Application
20.3.3. By Enterprise Size
20.3.4. By Industry
20.3.5. By Country
20.3.5.1. India
20.3.5.2. Thailand
20.3.5.3. Indonesia
20.3.5.4. Malaysia
20.3.5.5. Oceania
20.3.5.6. Rest of South Asia & Pacific
20.4. Market Attractiveness Analysis
20.4.1. By Solution
20.4.2. By Application
20.4.3. By Enterprise Size
20.4.4. By Industry
20.4.5. By Country
20.5. Market Trends
20.6. Key Market Participants - Intensity Mapping
21. Middle East and Africa Codeless Testing Market Analysis 2016-2020 and Forecast 2021-2031
21.1. Introduction
21.2. Historical Market Size (US$ Mn) Trend Analysis By Market Taxonomy, 2016 - 2020
21.3. Current and Future Market Size (US$ Mn) Forecast By Market Taxonomy, 2021 - 2031
21.3.1. By Solution
21.3.2. By Application
21.3.3. By Enterprise Size
21.3.4. By Industry
21.3.5. By Country
21.3.5.1. GCC Countries
21.3.5.2. Turkey
21.3.5.3. Northern Africa
21.3.5.4. South Africa
21.3.5.5. Rest of Middle East and Africa
21.4. Market Attractiveness Analysis
21.4.1. By Solution
21.4.2. By Application
21.4.3. By Enterprise Size
21.4.4. By Industry
21.4.5. By Country
21.5. Market Trends
21.6. Key Market Participants - Intensity Mapping
22. Key Countries Analysis- Codeless Testing Market
22.1. U.S. Codeless Testing Market Analysis
22.1.1. By Solution
22.1.2. By Application
22.1.3. By Enterprise Size
22.1.4. By Industry
22.2. Canada Codeless Testing Market Analysis
22.2.1. By Solution
22.2.2. By Application
22.2.3. By Enterprise Size
22.2.4. By Industry
22.3. Mexico Codeless Testing Market Analysis
22.3.1. By Solution
22.3.2. By Application
22.3.3. By Enterprise Size
22.3.4. By Industry
22.4. Brazil Codeless Testing Market Analysis
22.4.1. By Solution
22.4.2. By Application
22.4.3. By Enterprise Size
22.4.4. By Industry
22.5. Germany Codeless Testing Market Analysis
22.5.1. By Solution
22.5.2. By Application
22.5.3. By Enterprise Size
22.5.4. By Industry
22.6. Italy Codeless Testing Market Analysis
22.6.1. By Solution
22.6.2. By Application
22.6.3. By Enterprise Size
22.6.4. By Industry
22.7. France Codeless Testing Market Analysis
22.7.1. By Solution
22.7.2. By Application
22.7.3. By Enterprise Size
22.7.4. By Industry
22.8. U.K. Codeless Testing Market Analysis
22.8.1. By Solution
22.8.2. By Application
22.8.3. By Enterprise Size
22.8.4. By Industry
22.9. Spain Codeless Testing Market Analysis
22.9.1. By Solution
22.9.2. By Application
22.9.3. By Enterprise Size
22.9.4. By Industry
22.10. BENELUX Codeless Testing Market Analysis
22.10.1. By Solution
22.10.2. By Application
22.10.3. By Enterprise Size
22.10.4. By Industry
22.11. Russia Codeless Testing Market Analysis
22.11.1. By Solution
22.11.2. By Application
22.11.3. By Enterprise Size
22.11.4. By Industry
22.12. China Codeless Testing Market Analysis
22.12.1. By Solution
22.12.2. By Application
22.12.3. By Enterprise Size
22.12.4. By Industry
22.13. Japan Codeless Testing Market Analysis
22.13.1. By Solution
22.13.2. By Application
22.13.3. By Enterprise Size
22.13.4. By Industry
22.14. South Korea Codeless Testing Market Analysis
22.14.1. By Solution
22.14.2. By Application
22.14.3. By Enterprise Size
22.14.4. By Industry
22.15. India Codeless Testing Market Analysis
22.15.1. By Solution
22.15.2. By Application
22.15.3. By Enterprise Size
22.15.4. By Industry
22.16. ASEAN Codeless Testing Market Analysis
22.16.1. By Solution
22.16.2. By Application
22.16.3. By Enterprise Size
22.16.4. By Industry
22.17. Australia and New Zealand Codeless Testing Market Analysis
22.17.1. By Solution
22.17.2. By Application
22.17.3. By Enterprise Size
22.17.4. By Industry
22.18. GCC Countries Codeless Testing Market Analysis
22.18.1. By Solution
22.18.2. By Application
22.18.3. By Enterprise Size
22.18.4. By Industry
22.19. Turkey Codeless Testing Market Analysis
22.19.1. By Solution
22.19.2. By Application
22.19.3. By Enterprise Size
22.19.4. By Industry
22.20. South Africa Codeless Testing Market Analysis
22.20.1. By Solution
22.20.2. By Application
22.20.3. By Enterprise Size
22.20.4. By Industry
23. Competition Analysis
23.1. Competition Dashboard
23.2. Pricing Analysis, By Competition
23.3. Key Strategy, By Competition
23.4. Competition Deep Dive
23.4.1. Ranorex GmbH
23.4.1.1. Business Overview
23.4.1.2. Product Portfolio
23.4.1.3. Profitability by Market Segments (Business Segment/Region)
23.4.1.4. Market Development
23.4.1.5. Strategy Overview
23.4.1.5.1. Marketing Strategy
23.4.1.5.2. Services Strategy
23.4.2. Katalon, Inc.
23.4.2.1. Business Overview
23.4.2.2. Product Portfolio
23.4.2.3. Profitability by Market Segments (Business Segment/Region)
23.4.2.4. Market Development
23.4.2.5. Strategy Overview
23.4.2.5.1. Marketing Strategy
23.4.2.5.2. Services Strategy
23.4.3. Mabl Inc.
23.4.3.1. Business Overview
23.4.3.2. Product Portfolio
23.4.3.3. Profitability by Market Segments (Business Segment/Region)
23.4.3.4. Market Development
23.4.3.5. Strategy Overview
23.4.3.5.1. Marketing Strategy
23.4.3.5.2. Services Strategy
23.4.4. Usetrace
23.4.4.1. Business Overview
23.4.4.2. Product Portfolio
23.4.4.3. Profitability by Market Segments (Business Segment/Region)
23.4.4.4. Market Development
23.4.4.5. Strategy Overview
23.4.4.5.1. Marketing Strategy
23.4.4.5.2. Services Strategy
23.4.5. Perforce Software, Inc.
23.4.5.1. Business Overview
23.4.5.2. Product Portfolio
23.4.5.3. Profitability by Market Segments (Business Segment/Region)
23.4.5.4. Market Development
23.4.5.5. Strategy Overview
23.4.5.5.1. Marketing Strategy
23.4.5.5.2. Services Strategy
23.4.6. Cygnet-Infotech
23.4.6.1. Business Overview
23.4.6.2. Product Portfolio
23.4.6.3. Profitability by Market Segments (Business Segment/Region)
23.4.6.4. Market Development
23.4.6.5. Strategy Overview
23.4.6.5.1. Marketing Strategy
23.4.6.5.2. Services Strategy
23.4.7. Worksoft, Inc.
23.4.7.1. Business Overview
23.4.7.2. Product Portfolio
23.4.7.3. Profitability by Market Segments (Business Segment/Region)
23.4.7.4. Market Development
23.4.7.5. Strategy Overview
23.4.7.5.1. Marketing Strategy
23.4.7.5.2. Services Strategy
23.4.8. Testim
23.4.8.1. Business Overview
23.4.8.2. Product Portfolio
23.4.8.3. Profitability by Market Segments (Business Segment/Region)
23.4.8.4. Market Development
23.4.8.5. Strategy Overview
23.4.8.5.1. Marketing Strategy
23.4.8.5.2. Services Strategy
23.4.9. froglogic GmbH
23.4.9.1. Business Overview
23.4.9.2. Product Portfolio
23.4.9.3. Profitability by Market Segments (Business Segment/Region)
23.4.9.4. Market Development
23.4.9.5. Strategy Overview
23.4.9.5.1. Marketing Strategy
23.4.9.5.2. Services Strategy
23.4.10. Statnetics LLC
23.4.10.1. Business Overview
23.4.10.2. Product Portfolio
23.4.10.3. Profitability by Market Segments (Business Segment/Region)
23.4.10.4. Market Development
23.4.10.5. Strategy Overview
23.4.10.5.1. Marketing Strategy
23.4.10.5.2. Services Strategy
23.4.11. ACCELQ Inc.
23.4.11.1. Business Overview
23.4.11.2. Product Portfolio
23.4.11.3. Profitability by Market Segments (Business Segment/Region)
23.4.11.4. Market Development
23.4.11.5. Strategy Overview
23.4.11.5.1. Marketing Strategy
23.4.11.5.2. Services Strategy
23.4.12. QMetry Inc.
23.4.12.1. Business Overview
23.4.12.2. Product Portfolio
23.4.12.3. Profitability by Market Segments (Business Segment/Region)
23.4.12.4. Market Development
23.4.12.5. Strategy Overview
23.4.12.5.1. Marketing Strategy
23.4.12.5.2. Services Strategy
23.4.13. Micro Focus
23.4.13.1. Business Overview
23.4.13.2. Product Portfolio
23.4.13.3. Profitability by Market Segments (Business Segment/Region)
23.4.13.4. Market Development
23.4.13.5. Strategy Overview
23.4.13.5.1. Marketing Strategy
23.4.13.5.2. Services Strategy
23.4.14. Tricentis
23.4.14.1. Business Overview
23.4.14.2. Product Portfolio
23.4.14.3. Profitability by Market Segments (Business Segment/Region)
23.4.14.4. Market Development
23.4.14.5. Strategy Overview
23.4.14.5.1. Marketing Strategy
23.4.14.5.2. Services Strategy
23.4.15. Eggplant
23.4.15.1. Business Overview
23.4.15.2. Product Portfolio
23.4.15.3. Profitability by Market Segments (Business Segment/Region)
23.4.15.4. Market Development
23.4.15.5. Strategy Overview
23.4.15.5.1. Marketing Strategy
23.4.15.5.2. Services Strategy
24. Assumptions and Acronyms Used
25. Research Methodology
Let us know your requirement to get
100% FREE customization
Table 01: Global Codeless Testing Market Size (US$ Mn) Analysis and Forecast by Solution, 2016–2031
Table 02: Global Codeless Testing Market Size (US$ Mn) Analysis and Forecast by Application, 2016–2031
Table 03: Global Codeless Testing Market Size (US$ Mn) Analysis and Forecast by Enterprise Size, 2016–2031
Table 04: Global Codeless Testing Market Size (US$ Mn) Analysis and Forecast by Industry, 2016–2031
Table 05: Global Codeless Testing Market Size (US$ Mn) Analysis and Forecast by Region, 2016–2031
Table 06: North America Codeless Testing Market Size (US$ Mn) Analysis and Forecast by Solution, 2016–2031
Table 07: North America Codeless Testing Market Size (US$ Mn) Analysis and Forecast by Application, 2016–2031
Table 08: North America Codeless Testing Market Size (US$ Mn) Analysis and Forecast by Enterprise Size, 2016–2031
Table 09: North America Codeless Testing Market Size (US$ Mn) Analysis and Forecast by Industry, 2016–2031
Table 10: North America Codeless Testing Market Size (US$ Mn) Analysis and Forecast by Country, 2016–2031
Table 11: Latin America Codeless Testing Market Size (US$ Mn) Analysis and Forecast by Solution, 2016–2031
Table 12: Latin America Codeless Testing Market Size (US$ Mn) Analysis and Forecast by Application, 2016–2031
Table 13: Latin America Codeless Testing Market Size (US$ Mn) Analysis and Forecast by Enterprise Size, 2016–2031
Table 14: Latin America Codeless Testing Market Size (US$ Mn) Analysis and Forecast by Industry, 2016–2031
Table 15: Latin America Codeless Testing Market Size (US$ Mn) Analysis and Forecast by Country, 2016–2031
Table 16: Europe Codeless Testing Market Size (US$ Mn) Analysis and Forecast by Solution, 2016–2031
Table 17: Europe Codeless Testing Market Size (US$ Mn) Analysis and Forecast by Application, 2016–2031
Table 18: Europe Codeless Testing Market Size (US$ Mn) Analysis and Forecast by Enterprise Size, 2016–2031
Table 19: Europe Codeless Testing Market Size (US$ Mn) Analysis and Forecast by Industry, 2016–2031
Table 20: Europe Codeless Testing Market Size (US$ Mn) Analysis and Forecast by Country, 2016–2031
Table 21: East Asia Codeless Testing Market Size (US$ Mn) Analysis and Forecast by Solution, 2016–2031
Table 22: East Asia Codeless Testing Market Size (US$ Mn) Analysis and Forecast by Application, 2016–2031
Table 23: East Asia Codeless Testing Market Size (US$ Mn) Analysis and Forecast by Enterprise Size, 2016–2031
Table 24: East Asia Codeless Testing Market Size (US$ Mn) Analysis and Forecast by Industry, 2016–2031
Table 25: East Asia Codeless Testing Market Size (US$ Mn) Analysis and Forecast by Country, 2016–2031
Table 26: South Asia & Pacific Codeless Testing Market Size (US$ Mn) Analysis and Forecast by Solution, 2016–2031
Table 27: South Asia & Pacific Codeless Testing Market Size (US$ Mn) Analysis and Forecast by Application, 2016–2031
Table 28: South Asia & Pacific Codeless Testing Market Size (US$ Mn) Analysis and Forecast by Enterprise Size, 2016–2031
Table 29: South Asia & Pacific Codeless Testing Market Size (US$ Mn) Analysis and Forecast by Industry, 2016–2031
Table 30: South Asia & Pacific Codeless Testing Market Size (US$ Mn) Analysis and Forecast by Country, 2016–2031
Table 31: Middle East & Africa Codeless Testing Market Size (US$ Mn) Analysis and Forecast by Solution, 2016–2031
Table 32: Middle East & Africa Codeless Testing Market Size (US$ Mn) Analysis and Forecast by Application, 2016–2031
Table 33: Middle East & Africa Codeless Testing Market Size (US$ Mn) Analysis and Forecast by Enterprise Size, 2016–2031
Table 34: Middle East & Africa Codeless Testing Market Size (US$ Mn) Analysis and Forecast by Industry, 2016–2031
Table 35: Middle East & Africa Codeless Testing Market Size (US$ Mn) Analysis and Forecast by Country, 2016–2031
Find your sweet spots for generating winning opportunities in this market.
Talk to AnalystFigure 01: Global Codeless Testing Market Size and Y-o-Y Growth Rate from 2021 – 2031
Figure 02: Global Codeless Testing Market Absolute $ Opportunity (US$ Mn), 2020 – 2031
Figure 03: Global Codeless Testing Market Value (US$ Mn), 2016-2020
Figure 04: Global codeless testing Value (US$ Mn), 2021-2031
Figure 05: Global Codeless Testing Market: Market Share Analysis by Solution – 2021 & 2031
Figure 06: Global Codeless Testing Market: Y-o-Y Growth Comparison by Solution, 2021-2031
Figure 07: Global Codeless Testing Market: Market Attractiveness by Solution
Figure 08: Global Codeless Testing Market: Market Share Analysis by Application – 2021 & 2031
Figure 09: Global Codeless Testing Market: Y-o-Y Growth Comparison by Application, 2021-2031
Figure 10: Global Codeless Testing Market: Market Attractiveness by Application
Figure 11: Global Codeless Testing Market: Market Share Analysis by Enterprise Size– 2021 & 2031
Figure 12: Global Codeless Testing Market: Y-o-Y Growth Comparison by Enterprise Size, 2021-2031
Figure 13: Global Codeless Testing Market: Market Attractiveness by Enterprise Size
Figure 14: Global Codeless Testing Market: Market Share Analysis by Industry– 2021 & 2031
Figure 15: Global Codeless Testing Market: Y-o-Y Growth Comparison by Industry, 2021-2031
Figure 16: Global Codeless Testing Market: Market Attractiveness by Industry
Figure 17: Global Codeless Testing Market: Market Share Analysis by Region – 2021-2031
Figure 18: Global Codeless Testing Market: Y-o-Y Growth Comparison by Region, 2021-2031
Figure 19: Global Codeless Testing Market: Market Attractiveness by Region
Figure 20: North America Codeless Testing Market Absolute $ Opportunity (US$ Mn), 2016–2031
Figure 21: Latin America Codeless Testing Market Absolute $ Opportunity (US$ Mn), 2016–2031
Figure 22: Europe Codeless Testing Market Absolute $ Opportunity (US$ Mn), 2016–2031
Figure 23: East Asia Codeless Testing Market Absolute $ Opportunity (US$ Mn), 2016–2031
Figure 24: South Asia & Pacific Codeless Testing Market Absolute $ Opportunity (US$ Mn), 2016–2031
Figure 25: Middle East & Africa Codeless Testing Market Absolute $ Opportunity (US$ Mn), 2016–2031
Figure 26: North America Codeless Testing Market Value (US$ Mn), 2016-2020
Figure 27: North America Codeless Testing Market Value (US$ Mn), 2021-2031
Figure 28: North America Codeless Testing Market: Market Share Analysis by Solution – 2021 & 2031
Figure 29: North America Codeless Testing Market: Y-o-Y Growth Comparison by Solution, 2021-2031
Figure 30: North America Codeless Testing Market: Market Attractiveness by Solution
Figure 31: North America Codeless Testing Market: Market Share Analysis by Application – 2021 & 2031
Figure 32: North America Codeless Testing Market: Y-o-Y Growth Comparison by Application, 2021-2031
Figure 33: North America Codeless Testing Market: Market Attractiveness by Application
Figure 34: North America Codeless Testing Market: Market Share Analysis by Enterprise Size– 2021 & 2031
Figure 35: North America Codeless Testing Market: Y-o-Y Growth Comparison by Enterprise Size, 2021-2031
Figure 36: North America Codeless Testing Market: Market Attractiveness by Enterprise Size
Figure 37: North America Codeless Testing Market: Market Share Analysis by Industry– 2021 & 2031
Figure 38: North America Codeless Testing Market: Y-o-Y Growth Comparison by Industry, 2021-2031
Figure 39: North America Codeless Testing Market: Market Attractiveness by Industry
Figure 40: North America Codeless Testing Market: Market Share Analysis by Country – 2021-2031
Figure 41: North America Codeless Testing Market: Y-o-Y Growth Comparison by Country, 2021-2031
Figure 42: North America Codeless Testing Market: Market Attractiveness by Country
Figure 43: U.S. Codeless Testing Market Absolute $ Opportunity (US$ Mn), 2016–2031
Figure 44: Canada Codeless Testing Market Absolute $ Opportunity (US$ Mn), 2016–2031
Figure 45: Latin America Codeless Testing Market Value (US$ Mn), 2016-2020
Figure 46: Latin America Codeless Testing Market Value (US$ Mn), 2021-2031
Figure 47: Latin America Codeless Testing Market: Market Share Analysis by Solution – 2021 & 2031
Figure 48: Latin America Codeless Testing Market: Y-o-Y Growth Comparison by Solution, 2021-2031
Figure 49: Latin America Codeless Testing Market: Market Attractiveness by Solution
Figure 50: Latin America Codeless Testing Market: Market Share Analysis by Application – 2021 & 2031
Figure 51: Latin America Codeless Testing Market: Y-o-Y Growth Comparison by Application, 2021-2031
Figure 52: Latin America Codeless Testing Market: Market Attractiveness by Application
Figure 53: Latin America Codeless Testing Market: Market Share Analysis by Enterprise Size– 2021 & 2031
Figure 54: Latin America Codeless Testing Market: Y-o-Y Growth Comparison by Enterprise Size, 2021-2031
Figure 55: Latin America Codeless Testing Market: Market Attractiveness by Enterprise Size
Figure 56: Latin America Codeless Testing Market: Market Share Analysis by Industry– 2021 & 2031
Figure 57: Latin America Codeless Testing Market: Y-o-Y Growth Comparison by Industry, 2021-2031
Figure 58: Latin America Codeless Testing Market: Market Attractiveness by Industry
Figure 59: Latin America Codeless Testing Market: Market Share Analysis by Country – 2021-2031
Figure 60: Latin America Codeless Testing Market: Y-o-Y Growth Comparison by Country, 2021-2031
Figure 61: Latin America Codeless Testing Market: Market Attractiveness by Country
Figure 62: Brazil Codeless Testing Market Absolute $ Opportunity (US$ Mn), 2016–2031
Figure 63: Mexico Codeless Testing Market Absolute $ Opportunity (US$ Mn), 2016–2031
Figure 64: Rest of Latin America Codeless Testing Market Absolute $ Opportunity (US$ Mn), 2016–2031
Figure 65: Europe Codeless Testing Market Value (US$ Mn), 2016-2020
Figure 66: Europe Codeless Testing Market Value (US$ Mn), 2021-2031
Figure 67: Europe Codeless Testing Market: Market Share Analysis by Solution – 2021 & 2031
Figure 68: Europe Codeless Testing Market: Y-o-Y Growth Comparison by Solution, 2021-2031
Figure 69: Europe Codeless Testing Market: Market Attractiveness by Solution
Figure 70: Europe Codeless Testing Market: Market Share Analysis by Application – 2021 & 2031
Figure 71: Europe Codeless Testing Market: Y-o-Y Growth Comparison by Application, 2021-2031
Figure 72: Europe Codeless Testing Market: Market Attractiveness by Application
Figure 73: Europe Codeless Testing Market: Market Share Analysis by Enterprise Size– 2021 & 2031
Figure 74: Europe Codeless Testing Market: Y-o-Y Growth Comparison by Enterprise Size, 2021-2031
Figure 75: Europe Codeless Testing Market: Market Attractiveness by Enterprise Size
Figure 76: Europe Codeless Testing Market: Market Share Analysis by Industry– 2021 & 2031
Figure 77: Europe Codeless Testing Market: Y-o-Y Growth Comparison by Industry, 2021-2031
Figure 78: Europe Codeless Testing Market: Market Attractiveness by Industry
Figure 79: Europe Codeless Testing Market: Market Share Analysis by Country – 2021-2031
Figure 80: Europe Codeless Testing Market: Y-o-Y Growth Comparison by Country, 2021-2031
Figure 81: Europe Codeless Testing Market: Market Attractiveness by Country
Figure 82: Germany Codeless Testing Market Absolute $ Opportunity (US$ Mn), 2016–2031
Figure 83: Italy Codeless Testing Market Absolute $ Opportunity (US$ Mn), 2016–2031
Figure 84: France Codeless Testing Market Absolute $ Opportunity (US$ Mn), 2016–2031
Figure 85: U.K. Codeless Testing Market Absolute $ Opportunity (US$ Mn), 2016–2031
Figure 86: Spain Codeless Testing Market Absolute $ Opportunity (US$ Mn), 2016–2031
Figure 87: Benelux Codeless Testing Market Absolute $ Opportunity (US$ Mn), 2016–2031
Figure 88: Russia Codeless Testing Market Absolute $ Opportunity (US$ Mn), 2016–2031
Figure 89: Rest of Europe Codeless Testing Market Absolute $ Opportunity (US$ Mn), 2016–2031
Figure 90: East Asia Codeless Testing Market Value (US$ Mn), 2016-2020
Figure 91: East Asia Codeless Testing Market Value (US$ Mn), 2021-2031
Figure 92: East Asia Codeless Testing Market: Market Share Analysis by Solution – 2021 & 2031
Figure 93: East Asia Codeless Testing Market: Y-o-Y Growth Comparison by Solution, 2021-2031
Figure 94: East Asia Codeless Testing Market: Market Attractiveness by Solution
Figure 95: East Asia Codeless Testing Market: Market Share Analysis by Application – 2021 & 2031
Figure 96: East Asia Codeless Testing Market: Y-o-Y Growth Comparison by Application, 2021-2031
Figure 97: East Asia Codeless Testing Market: Market Attractiveness by Application
Figure 98: East Asia Codeless Testing Market: Market Share Analysis by Enterprise Size– 2021 & 2031
Figure 99: East Asia Codeless Testing Market: Y-o-Y Growth Comparison by Enterprise Size, 2021-2031
Figure 100: East Asia Codeless Testing Market: Market Attractiveness by Enterprise Size
Figure 101: East Asia Codeless Testing Market: Market Share Analysis by Industry– 2021 & 2031
Figure 102: East Asia Codeless Testing Market: Y-o-Y Growth Comparison by Industry, 2021-2031
Figure 103: East Asia Codeless Testing Market: Market Attractiveness by Industry
Figure 104: East Asia Codeless Testing Market: Market Share Analysis by Country – 2021-2031
Figure 105: East Asia Codeless Testing Market: Y-o-Y Growth Comparison by Country, 2021-2031
Figure 106: East Asia Codeless Testing Market: Market Attractiveness by Country
Figure 107: China Codeless Testing Market Absolute $ Opportunity (US$ Mn), 2016–2031
Figure 108: Japan Codeless Testing Market Absolute $ Opportunity (US$ Mn), 2016–2031
Figure 109: South Korea Codeless Testing Market Absolute $ Opportunity (US$ Mn), 2016–2031
Figure 110: South Asia & Pacific Codeless Testing Market Value (US$ Mn), 2016-2020
Figure 111: South Asia & Pacific Codeless Testing Market Value (US$ Mn), 2021-2031
Figure 112: South Asia & Pacific Codeless Testing Market: Market Share Analysis by Solution – 2021 & 2031
Figure 113: South Asia & Pacific Codeless Testing Market: Y-o-Y Growth Comparison by Solution, 2021-2031
Figure 114: South Asia & Pacific Codeless Testing Market: Market Attractiveness by Solution
Figure 115: South Asia & Pacific Codeless Testing Market: Market Share Analysis by Application – 2021 & 2031
Figure 116: South Asia & Pacific Codeless Testing Market: Y-o-Y Growth Comparison by Application, 2021-2031
Figure 117: South Asia & Pacific Codeless Testing Market: Market Attractiveness by Application
Figure 118: South Asia & Pacific Codeless Testing Market: Market Share Analysis by Enterprise Size– 2021 & 2031
Figure 119: South Asia & Pacific Codeless Testing Market: Y-o-Y Growth Comparison by Enterprise Size, 2021-2031
Figure 120: South Asia & Pacific Codeless Testing Market: Market Attractiveness by Enterprise Size
Figure 121: South Asia & Pacific Codeless Testing Market: Market Share Analysis by Industry– 2021 & 2031
Figure 122: South Asia & Pacific Codeless Testing Market: Y-o-Y Growth Comparison by Industry, 2021-2031
Figure 123: South Asia & Pacific Codeless Testing Market: Market Attractiveness by Industry
Figure 124: South Asia & Pacific Codeless Testing Market: Market Share Analysis by Country – 2021-2031
Figure 125: South Asia & Pacific Codeless Testing Market: Y-o-Y Growth Comparison by Country, 2021-2031
Figure 126: South Asia & Pacific Codeless Testing Market: Market Attractiveness by Country
Figure 127: India Codeless Testing Market Absolute $ Opportunity (US$ Mn), 2016–2031
Figure 128: ASEAN Codeless Testing Market Absolute $ Opportunity (US$ Mn), 2016–2031
Figure 129: Australia & New Zealand Codeless Testing Market Absolute $ Opportunity (US$ Mn), 2016–2031
Figure 130: Rest of South Asia & Pacific Codeless Testing Market Absolute $ Opportunity (US$ Mn), 2016–2031
Figure 131: Middle East & Africa Codeless Testing Market Value (US$ Mn), 2016-2020
Figure 132: Middle East & Africa Codeless Testing Market Value (US$ Mn), 2021-2031
Figure 133: Middle East & Africa Codeless Testing Market: Market Share Analysis by Solution – 2021 & 2031
Figure 134: Middle East & Africa Codeless Testing Market: Y-o-Y Growth Comparison by Solution, 2021-2031
Figure 135: Middle East & Africa Codeless Testing Market: Market Attractiveness by Solution
Figure 136: Middle East & Africa Codeless Testing Market: Market Share Analysis by Application – 2021 & 2031
Figure 137: Middle East & Africa Codeless Testing Market: Y-o-Y Growth Comparison by Application, 2021-2031
Figure 138: Middle East & Africa Codeless Testing Market: Market Attractiveness by Application
Figure 139: Middle East & Africa Codeless Testing Market: Market Share Analysis by Enterprise Size– 2021 & 2031
Figure 140: Middle East & Africa Codeless Testing Market: Y-o-Y Growth Comparison by Enterprise Size, 2021-2031
Figure 141: Middle East & Africa Codeless Testing Market: Market Attractiveness by Enterprise Size
Figure 142: Middle East & Africa Codeless Testing Market: Market Share Analysis by Industry– 2021 & 2031
Figure 143: Middle East & Africa Codeless Testing Market: Y-o-Y Growth Comparison by Industry, 2021-2031
Figure 144: Middle East & Africa Codeless Testing Market: Market Attractiveness by Industry
Figure 145: Middle East & Africa Codeless Testing Market: Market Share Analysis by Country – 2021-2031
Figure 146: Middle East & Africa Codeless Testing Market: Y-o-Y Growth Comparison by Country, 2021-2031
Figure 147: Middle East & Africa Codeless Testing Market: Market Attractiveness by Country
Figure 148: GCC Countries Codeless Testing Market Absolute $ Opportunity (US$ Mn), 2016–2031
Figure 149: Turkey Codeless Testing Market Absolute $ Opportunity (US$ Mn), 2016–2031
Figure 150: South Africa Codeless Testing Market Absolute $ Opportunity (US$ Mn), 2016–2031
Figure 151: Rest of MEA Codeless Testing Market Absolute $ Opportunity (US$ Mn), 2016–2031
Figure 152: U.S. Incremental Opportunity (US$ Mn) Analysis, 2021 – 2031
Figure 153: Canada Incremental Opportunity (US$ Mn) Analysis, 2021 – 2031
Figure 154: Brazil Incremental Opportunity (US$ Mn) Analysis, 2021 – 2031
Figure 155: Mexico Incremental Opportunity (US$ Mn) Analysis, 2021 – 2031
Figure 156: Germany Incremental Opportunity (US$ Mn) Analysis, 2021 – 2031
Figure 157: Italy Incremental Opportunity (US$ Mn) Analysis, 2021 – 2031
Figure 158: France Incremental Opportunity (US$ Mn) Analysis, 2021 – 2031
Figure 159: U.K. Incremental Opportunity (US$ Mn) Analysis, 2021 – 2031
Figure 160: Spain Incremental Opportunity (US$ Mn) Analysis, 2021 – 2031
Figure 161: BENELUX Incremental Opportunity (US$ Mn) Analysis, 2021 – 2031
Figure 162: Russia Incremental Opportunity (US$ Mn) Analysis, 2021 – 2031
Figure 163: China Incremental Opportunity (US$ Mn) Analysis, 2021 – 2031
Figure 164: Japan Incremental Opportunity (US$ Mn) Analysis, 2021 – 2031
Figure 165: South Korea Incremental Opportunity (US$ Mn) Analysis, 2021 – 2031
Figure 166: India Incremental Opportunity (US$ Mn) Analysis, 2021 – 2031
Figure 167: ASEAN Incremental Opportunity (US$ Mn) Analysis, 2021 – 2031
Figure 168: Australia & New Zealand Incremental Opportunity (US$ Mn) Analysis, 2021 – 2031
Figure 169: GCC Countries Incremental Opportunity (US$ Mn) Analysis, 2021 – 2031
Figure 170: Turkey Incremental Opportunity (US$ Mn) Analysis, 2021 – 2031
Figure 171: South Africa Incremental Opportunity (US$ Mn) Analysis, 2021 – 2031
Need specific information?
Request CustomizationExplore Technology Insights
View Reports