

- Market Size (2026)
- USD 980.7 Mn
- Forecast (2036)
- USD 1723.4 Mn
- CAGR (2026 to 2036)
- 5.8%
How big is the Concrete Form Liners Market in 2026?
USD 980.7 million in 2026 and USD 1,723.4 million by 2036 at a 5.8% CAGR.
The concrete form liners market is likely to push valuation from USD 980.7 million in 2026 to USD 1,723.4 million by 2036, expanding at a 5.8% CAGR over the forecast period. Public construction backlogs are reinforcing demand for liners that reduce rework on exposed concrete surfaces. USA Census Bureau reported June 2026 that April 2026 construction spending reached a seasonally adjusted annual rate of USD 2,172.4 billion.
India and China are anticipated to favor direct supply routes as public works, metro corridors and precast activity raise demand for repeatable surface finishes. United States buyers are expected to place more weight on pattern records, reusable elastomeric liners and job references. Specification-led accounts are projected to favor suppliers that protect visible concrete quality through repeat pours and field stripping.
Precast plants and municipal engineering teams are expected to purchase concrete form liners to protect surface detail during repeat pours. These teams face adoption pressure from schedule exposure and approval evidence on repeat pours. Pattern tooling has a direct bearing on panel rejection risk due to visible texture variation after stripping. Sourcing teams compare liner durability beside construction chemicals procurement routines that already require product files. Direct manufacturer channels gain value by keeping design support and replacement availability under one accountable source.
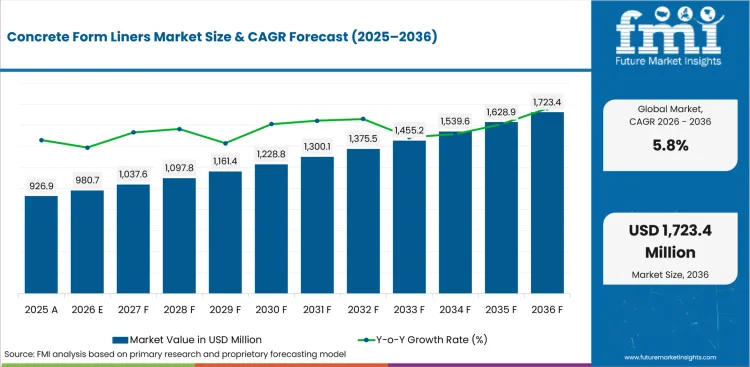
| Metric | Value |
|---|---|
| 2025 Market Size | USD 926.9 million |
| 2026 Market Size | USD 980.7 million |
| 2036 Market Size | USD 1,723.4 million |
| Forecast CAGR (2026-2036) | 5.8% |
| Sales Channel Focus | Direct Manufacturer |
| Direct Manufacturer Share (2026) | 61.8% |
| Material Focus | Elastomeric Form Liners |
| Elastomeric Form Liners Share (2026) | 38.0% |
| Pattern Type Focus | Brick / Stone Texture |
| Brick / Stone Texture Share (2026) | 38.0% |
| Fastest-growing Country | India |
| India CAGR by 2036 | 7.9% |
Summary of the Concrete Form Liners Market
| Market Signal | Commercial Impact |
|---|---|
| Demand and Growth Drivers | Project teams are expected to raise spending if surface finish risk is likely to delay handover. Specification records are projected to make direct support more valuable before repeat ordering expands across visible concrete work for contractors working on visible surface workflows.
|
| Product and Segment View | Direct manufacturer and elastomeric form liners are expected to lead their parent categories in 2026. Brick / stone texture is forecast to remain the main pattern reference for public-facing concrete.
|
| Geography and Growth Outlook | India and China are projected to form the higher-growth tier due to infrastructure volume and formalized project channels. The United States and Europe are expected to move under specification-led adoption cycles where supplier lists are deeper.
|
| Competitive Landscape | Competition is moderately fragmented across specialist formliner makers and broader forming-system suppliers serving decorative and structural concrete accounts. Purchase criteria are expected to center on pattern libraries and technical service reach before recurring orders are approved.
|
| Analyst Perspective | Adoption of concrete form liners is often influenced by the ability to consistently deliver the desired surface finish and minimize visual defects before precast elements or panels arrive on-site. Long-term customer retention is likely to be driven by dependable local technical support and the liner’s ability to reproduce uniform patterns across multiple projects.
- Nikhil Kaitwade, Principal Analyst at Future Market Insights |
Source: FMI's proprietary forecasting model and primary research
How is the Concrete Form Liners Market segmented?
The concrete form liners industry is segmented by material, pattern type, application, end use, sales channel, and region.
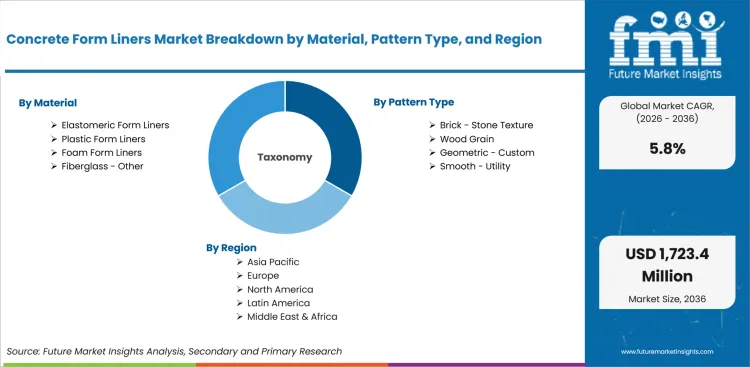
The concrete form liners market is segmented by material, pattern type, application, end use, sales channel, and region. By material, the market covers elastomeric form liners, plastic form liners, foam form liners, and fiberglass / other liners. By pattern type, it covers brick / stone texture, wood grain, geometric / custom, and smooth / utility patterns. By application, it covers architectural concrete, infrastructure walls, precast panels, and retaining walls. By end use, it covers commercial construction, infrastructure, residential, and precast plants. By sales channel, it covers direct manufacturer, concrete contractors, and building material dealers. Regional coverage includes North America, Latin America, Europe, East Asia, South Asia and Pacific, and Middle East and Africa.
How do direct manufacturer channels shape purchasing within sales channels?
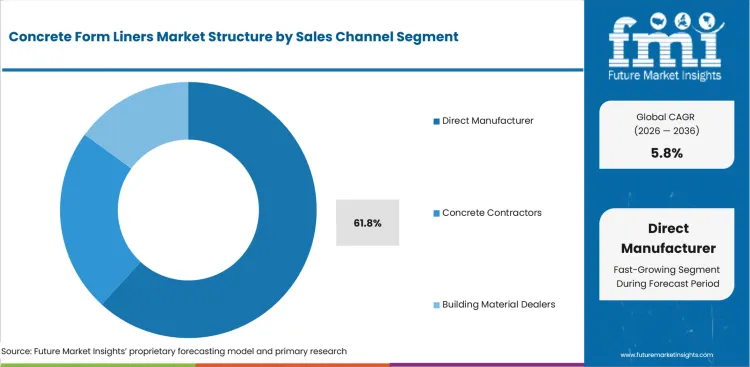
Direct manufacturer routes become valuable for contractors that need pattern advice and replacement timing inside the same order process. RECKLI announced in May 2026 that US Formliner opened a production facility in Commerce, Georgia. Local production support raises the value of direct ordering for accounts that need design help and delivery control before a pour window closes.
- By sales channel, direct manufacturer is projected to account for 61.8% share in 2026 driven by tighter service control and project-specific pattern support. RECKLI said the Commerce facility supports North American architectural concrete surfaces, which makes direct supply more practical for contractors that need issue ownership before field placement.
- Direct manufacturer channels are witnessing demand from contractors owing to cleaner accountability during sample approval and repeat panel work. Project teams comparing waterproofing admixtures demand also value technical files that shorten specification review and reduce coordination delays.
What supports elastomeric form liners within the material category?
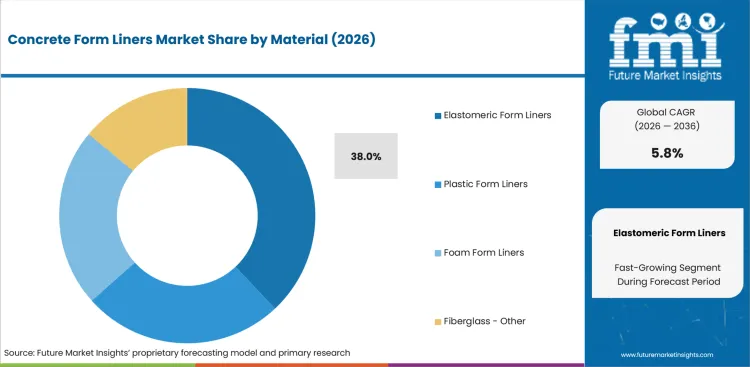
Elastomeric liner selection is shaped by reuse expectations and detailed texture transfer in architectural concrete work. USA Geological Survey reported 2025 cement shipments at 100 million tons in its February 2026 cement summary. The shipment base keeps concrete product manufacturing and contractor work visible in material selection. Engineering teams test elastomeric liners against stripping cycles and surface consistency before repeat specification.
- Elastomeric form liners are estimated to hold 38.0% share in 2026 owing to reuse value and sharper detail reproduction. USA Geological Survey stated that 70% to 75% of 2025 cement sales went to ready-mixed concrete producers, which keeps liner performance tied to concrete workflow planning.
- Demand for elastomeric form liners is expected to grow among precast plants attributable to repeat pours and tighter surface inspection. Plants handling shotcrete and sprayed concrete comparisons need liner materials that survive demolding routines without losing pattern definition.
How is brick / stone texture positioned within pattern type choices?
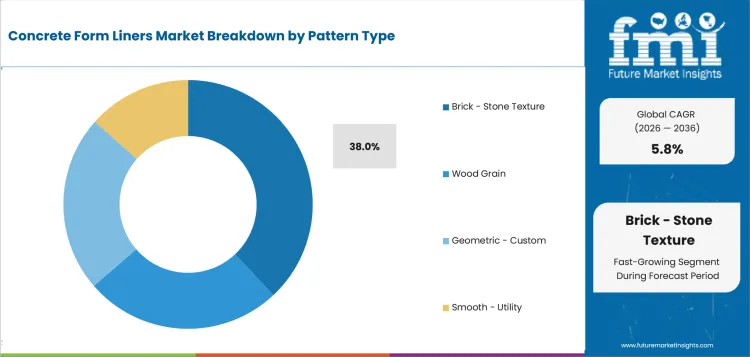
Brick / stone texture remains a familiar design language for owners that want masonry appearance without separate cladding work. Spec Formliners lists more than 300 standard patterns and custom 3D CNC designs on its official 2026 site. Pattern breadth gives architects a practical route to match brand facades and civic walls without forcing contractors into unfamiliar finishing methods.
- By pattern type, brick / stone texture is forecast to represent 38.0% share in 2026 supported by recognizable masonry cues and easier owner approval. Spec Formliners described DOT and bridge-ready pattern capabilities in 2026, which strengthens the case for stone textures in public infrastructure and sound-wall programs.
- Architectural practices are increasingly purchasing brick / stone texture led by the need to align civic surfaces and retail facades. Pattern reviews connected to green building materials demand are expected to favor recognizable textures that reduce owner uncertainty during approval.
What drives architectural concrete within the application category?
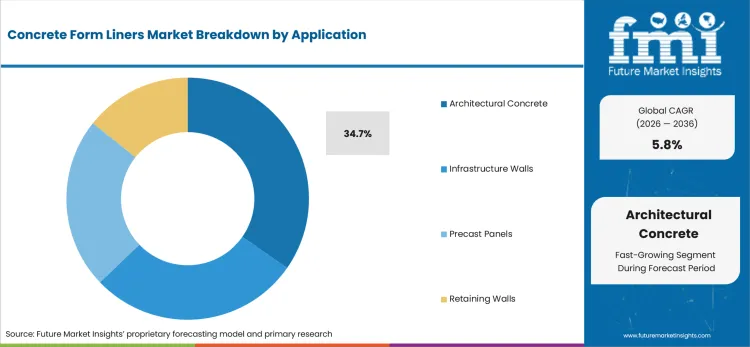
Architectural concrete applications depend on visible finish quality after stripping and curing where exposed surfaces stay visible after completion. Federal Highway Administration posted 2025 National Bridge Inventory files covering more than 624000 bridges on public roads. Bridge walls and transportation assets create repeat opportunities for textured concrete surfaces during renewal and sound-wall programs. Municipal engineering teams judge formliners by pattern clarity and field support before writing specifications.
- Architectural concrete is likely to capture 34.7% share in 2026 attributable to owner-facing surfaces and specification-driven facade work. Federal Highway Administration noted 2025 NBI data for more than 624000 bridges, which keeps public infrastructure aesthetics tied to repeatable concrete finish requirements.
- Purchase activity for architectural concrete form liners is anticipated to rise driven by municipal projects and commercial facades that need durable texture. Contractors test sample boards and cleaning routines before selecting a liner for visible walls and retaining structures.
How do commercial construction accounts evaluate end-use demand?
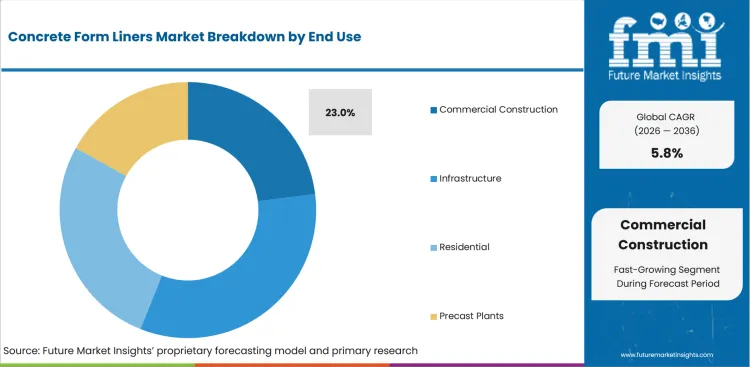
Commercial construction accounts examine formliner choice against schedule control and owner-facing finish risk before specifications move into pricing. USA Census Bureau reported private nonresidential construction spending at USD 729.8 billion in April 2026. The spending base signals many projects that review facade panels and exposed walls before handover. Contractors favor suppliers that provide mock-ups and installation notes early on facade packages and tilt-up walls.
- Commercial construction is set to lead the end-use category with 23.0% share in 2026 due to visible facade programs and tilt-up project scheduling. USA Census Bureau placed private nonresidential construction spending at USD 729.8 billion in April 2026, which keeps surface quality tied to large commercial work.
- Commercial contractors are expected to favor concrete form liners over improvised finishes due to schedule discipline and cleaner owner sign-off. Repeat retail and institutional programs require pattern continuity before product approval moves beyond one project.
What are the drivers, restraints, and opportunities in the Concrete Form Liners Market?
Near-term purchases are being shaped by exposed-surface quality and qualification burden. Specification-led access is the expansion route outlined below.
- Driver: Contractors are expected to spend on liners that reduce rework risk on visible concrete walls and panels.
- Restraint: Adoption is anticipated to slow if sample boards and installation records fail to satisfy project reviewers.
- Opportunity: Direct specification support is projected to open access to infrastructure and branded commercial facade programs.
Commercial and infrastructure contractors are expected to raise attention on liner selection if finish defects threaten handover timing. USA Census Bureau reported highway construction spending at USD 149.6 billion in April 2026 in its June 2026 release. Highway and wall programs keep surface durability and pattern repeatability inside sourcing reviews before field placement. A liner supplier gains a stronger case from instructions that reduce patching work after forms are stripped.
Qualification burden is likely to slow orders if project teams lack sample boards and documented installation steps. USA Geological Survey stated that cement was produced at 97 plants in 2025 in its February 2026 summary. Regional cement and concrete supply differences keep surface outcomes dependent on local mixes during exposed finish work. Contractor teams need trial records before accepting a new liner on visible panels.
Specification-led selling is expected to convert documentation pressure into account access for specialists that support design review early. Spec Formliners reported in November 2025 that two Florida retail tilt-wall projects exceeded 270,000 square feet together. Large panel programs favor early texture planning and direct technical support before shop drawing approval and pour scheduling. The same project discipline supports adjacent roofing chemicals demand checks for accounts that use product files to build sourcing confidence.
Which country CAGRs are profiled in the Concrete Form Liners Market?
.webp "Top Country Growth Comparison Concrete Form Liners Market Cagr (2026 2036)")
| Country | CAGR |
|---|---|
| United States | 4.5% |
| China | 6.9% |
| India | 7.9% |
| Germany | 3.9% |
| United Kingdom | 4.3% |
| Japan | 3.7% |
| South Korea | 5.1% |
Source: FMI's proprietary forecasting model and primary research
How do country-level CAGRs compare in the Concrete Form Liners Market?
India is projected at 7.9% CAGR and China is forecast at 6.9% CAGR due to infrastructure scale and formal sourcing growth. Rest of World is anticipated at 6.37% CAGR supported by private infrastructure finance in developing infrastructure corridors. South Korea is estimated at 5.1% CAGR owing to construction contract recovery after public and private awards rebound. The United Kingdom and United States are expected at 4.3% and 4.5% CAGR under deeper supplier screening. Germany and Japan are likely to remain steadier at 3.9% and 3.7% CAGR due to slower building cycles and specification discipline.
- US form liner demand tracks permit activity across a mixed residential and public infrastructure pipeline. The United States is projected to grow at 4.5% CAGR by 2036 driven by contractor approval lists and public infrastructure repair needs. USA Census Bureau reported May 2026 building permits at 1.413 million units in June 2026. Permit softness makes repeatable surface work more dependent on projects that already have funding. State highway agencies and public works departments also keep approved product lists that raise the value of documented installation histories. Public owners and large contractors are expected to concentrate purchases among suppliers that provide mock-ups and field support before bid packages close.
- China remains scale-sensitive due to real estate pressure that pushes suppliers toward infrastructure and public-facing concrete work. Concrete form liner demand in China is forecast to rise at 6.9% CAGR over the forecast period attributable to large project volumes and tighter channel control. National Bureau of Statistics of China reported newly built commercial building floor space sold at 881.01 million square meters in 2025. The decline in property sales makes infrastructure walls and civic projects a more practical route. Large municipal contractors still screen replacement lead times before switching pattern libraries during compressed program delivery. Suppliers with local inventory and pattern libraries are expected to receive stronger consideration from contractors managing fast project turns.
- India shows a different purchase case due to cement demand moving beside public infrastructure work. Adoption of concrete form liners in India is estimated to expand at 7.9% CAGR through 2036 owing to cement-linked infrastructure growth. The Office of Economic Adviser reported cement production growth of 8.4% in May 2026. Higher cement output supports more concrete placement and raises attention on repeatable surface finishes. Local sourcing behavior resembles India construction chemical procurement in accounts that screen local support before wider use.
- Germany is a qualification-heavy setting owing to lower completions that keep project teams cautious about specification changes. Germany concrete form liners sector is likely to reach 3.9% CAGR during the assessment period shaped by slow housing delivery and strict technical review. Destatis placed completed dwellings at 206,586 in 2025 in its construction work table release. The smaller delivery base makes architects and contractors more selective in moving from familiar finishes to textured concrete liners.
- United Kingdom demand is influenced by repair activity and cautious new-work planning for textured architectural concrete projects. In the United Kingdom, concrete form liner demand is predicted to advance at 4.3% CAGR through 2036 reinforced by public non-housing work and fit-out discipline. Office for National Statistics reported annual construction output growth of 1.8% in 2025 in its February 2026 release. The modest expansion keeps decorative concrete orders linked to funded projects and refurbishment-led schemes. Public-sector contractors also weigh repair-and-maintenance workflows before testing textured form liner packages during tender planning.
- Japan places more weight on planned public works and construction cost discipline than fast housing volume. Concrete form liner sales in Japan are forecast to expand at 3.7% CAGR by 2036 influenced by resilience work and renovation-led demand. Japanese MLIT data placed fiscal 2025 construction investment near JPY 76.67 trillion in its quick estimate release. Public works and renewal projects create demand for precise surface treatments on retaining walls and station assets. General contractors also screen cleaning behavior before approving liners for repeat civil works on public assets.
- South Korea is shaped by contract recovery and concentrated construction accounts that require faster sample approval. South Korea is estimated to post 5.1% CAGR over the forecast period led by higher construction contract value and civil engineering demand. The contract rebound supports selective use of liners in projects that need repeatable architectural surfaces. Large builders also need quick sample approval before installing decorative surfaces on compressed urban schedules. Dealer support remains part of vendor evaluation during compressed replacement windows for larger contractor accounts.
Who are the notable companies in the Concrete Form Liners Market?
Fitzgerald Formliners, Scott System, US Formliner, Spec Formliners, RECKLI, NOE-Schaltechnik, Dayton Superior, and Custom Rock Formliner are the notable companies shaping this market.
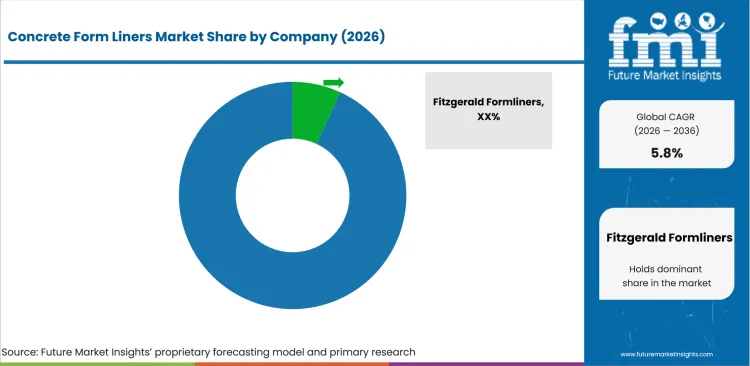
The competitive base is moderately fragmented due to specialist pattern makers competing beside broader forming and concrete accessory suppliers. Established multinational and regional specialists hold an advantage in project files and reusable elastomeric liner know-how. Competition centers on pattern breadth and documentation depth after sample approval and project documentation enter reviews.
- Pattern breadth defines the first competitive role for Fitzgerald Formliners and Spec Formliners in architectural concrete accounts. Contractors use these companies for architectural textures that need predictable repeat across tilt-up and precast panels. Fitzgerald offers established pattern families and Spec Formliners supports DOT and bridge-ready designs during specification review.
- Service reach separates Scott System and Dayton Superior in accounts that combine formwork planning and accessory sourcing. Scott System offers urethane and plastic liner options for custom concrete surfaces in architectural and infrastructure accounts. Dayton Superior provides formliner systems across wood grain and stone patterns for repeat texture applications.
- North American support gives US Formliner and RECKLI a distinct sourcing route for architectural concrete projects. RECKLI opened the Georgia production facility in 2026 to serve design and surface programs in the region. US Formliner offers reusable elastic and single-use recyclable liners for architectural concrete projects and design programs.
- Custom design capability keeps Custom Rock Formliner and NOE-Schaltechnik visible in projects that need shape-specific surfaces. Custom Rock emphasizes standard and custom patterns for precast and cast-in-place work in architectural accounts. NOE-Schaltechnik brings forming system knowledge beside textured concrete options for contractors that need integrated formwork guidance.
Competitive Benchmarking: Concrete Form Liners Market
| Company | Pattern Library Fit | Reusable Liner Capability | Specification Support | Service Reach |
|---|---|---|---|---|
| Fitzgerald Formliners | High | Strong | Strong | Global |
| Scott System | High | Strong | Medium | Regional |
| US Formliner | High | Strong | Strong | North America |
| Spec Formliners | Strong | Medium | Strong | Regional |
| RECKLI | High | Strong | Strong | Global |
| NOE-Schaltechnik | Medium | High | Strong | Global |
| Dayton Superior | Medium | Medium | Strong | Global |
| Custom Rock Formliner | Strong | Medium | Medium | Regional |
Source: Future Market Insights competitive analysis, 2026. Ratings reflect relative portfolio relevance and workflow fit. Service capability and geographic reach shape the remaining comparison.
Key Developments in the Concrete Form Liners Market
- In May 2026, RECKLI announced the opening of a new US Formliner production facility in Commerce in Georgia. The facility supports North American architectural concrete surface programs and strengthens local production access.
- In November 2025, Spec Formliners highlighted two Home Depot tilt-wall projects in Florida as a cited project update. The projects covered more than 270,000 square feet and used architectural formliner tooling during panel fabrication. The project update signals a shift toward early texture planning in large retail projects.
- In September 2025, Fitzgerald Formliners issued a cut sheet for Pattern 16969 Davidson Highway Rope. The document specified a 48 inch by 96-inch part size and 2.0-inch maximum depth. The development is expected to support infrastructure and barrier rail specifications that need exact pattern geometry before approval.
Key Players in the Concrete Form Liners Market
Formliner specialists
- Fitzgerald Formliners
- Scott System
- US Formliner
- Spec Formliners
- Custom Rock Formliner
Architectural concrete system suppliers
- RECKLI
- NOE-Schaltechnik
Concrete forming and accessory suppliers
- Dayton Superior
Concrete Form Liners Market - Report Scope
| Coverage field | Report scope |
|---|---|
| Market breakdown | Concrete Form Liners Market Breakdown By Material, Pattern Type, Application, End Use, Sales Channel, and Region |
| Market Definition | Concrete form liners are reusable or single-use liners placed inside concrete forms to create specified textures for contractors, precast plants, and municipal project teams. |
| Regions Covered | North America, Latin America, Europe, East Asia, South Asia and Pacific, and Middle East and Africa |
| Countries Covered | United States, China, India, Germany, United Kingdom, Japan, South Korea, and 30+ countries |
| Key Companies Profiled | Fitzgerald Formliners, Scott System, US Formliner, Spec Formliners, RECKLI, NOE-Schaltechnik, Dayton Superior, and Custom Rock Formliner |
| Forecast Period | 2026 to 2036 |
| Approach | Hybrid bottom-up and top-down methodology using material mix, pattern selection, application use cases, project channel access, and country-level construction indicators |
Source: Future Market Insights - analysis driven by proprietary forecasting models and primary research
Concrete Form Liners Market - Research Methodology
| Method | Approach |
|---|---|
| Primary Research | Primary interviews covered commercial contractors, precast plant managers, municipal engineering teams, architectural specifiers, and building material distributors. Discussions focused on pattern approval pain points and liner reuse claims. Interviews also tested supplier service expectations, sample-board use, direct manufacturer access, and barriers that delay repeat ordering across visible concrete projects. They also tested how sample boards affect approval timing and replacement planning. |
| Desk Research | Desk research reviewed government construction spending data and cement statistics beside national construction indicators for the profiled countries. Official company product pages and project updates were checked against direct form liner relevance. Product relevance was verified against material type, pattern library, application fit, end-use route, and sales channel role. Each source was screened for direct construction and exposed concrete relevance. |
| Market Sizing and Forecasting | Market sizing used a hybrid bottom-up and top-down model across concrete placement signals and formliner application intensity. The model combined material shares and pattern shares with contractor channel preferences. Forecast assumptions were adjusted for reusable liner economics, commercial facade demand, infrastructure wall use, and regional construction cycles identified during research. Country adjustments reflected contractor route differences and public works exposure. |
| Data Validation | Data validation compared forecasts against country-level construction indicators and official cement or building activity references. Company portfolios were reviewed to avoid counting decorative concrete products without form liner relevance. Segment totals were checked against parent category shares, channel splits, project application fit, and supplier capability evidence from primary interviews. Outlier checks removed adjacent decorative products without placement inside concrete forms during review. |
Source: Future Market Insights (FMI) analysis, based on proprietary forecasting model and primary research
Concrete Form Liners Market by Segments
Concrete Form Liners Market segmented by Material:
- Elastomeric Form Liners
- Plastic Form Liners
- Foam Form Liners
- Fiberglass / Other
Concrete Form Liners Market segmented by Pattern Type:
- Brick / Stone Texture
- Wood Grain
- Geometric / Custom
- Smooth / Utility
Concrete Form Liners Market segmented by Application:
- Architectural Concrete
- Infrastructure Walls
- Precast Panels
- Retaining Walls
Concrete Form Liners Market segmented by End Use:
- Commercial Construction
- Infrastructure
- Residential
- Precast Plants
Concrete Form Liners Market segmented by Sales Channel:
- Direct Manufacturer
- Concrete Contractors
- Building Material Dealers
Concrete Form Liners Market by Region:
- North America
- United States
- Canada
- Latin America
- Brazil
- Mexico
- Argentina
- Europe
- Germany
- United Kingdom
- France
- Italy
- Spain
- East Asia
- China
- Japan
- South Korea
- South Asia and Pacific
- India
- Australia
- ASEAN
- Middle East and Africa
- GCC Countries
- South Africa
- Turkey
Research Sources and Bibliography
- USA Census Bureau. (2026, June). Monthly Construction Spending, April 2026. USA Census Bureau.
- USA Census Bureau. (2026, June). New Residential Construction. USA Census Bureau.
- USA Geological Survey. (2026, February). Cement. USA Geological Survey.
- Federal Highway Administration. (2025, June). 2025 - Download NBI ASCII files. Federal Highway Administration.
- National Bureau of Statistics of China. (2026, January). Investment in Real Estate Development for 2025. National Bureau of Statistics of China.
- Office of Economic Adviser. (2026, June). Index of Eight Core Industries. Ministry of Commerce and Industry, Government of India.
- Federal Statistical Office of Germany. (2026, May). Construction work completed. Destatis.
- Office for National Statistics. (2026, February). Construction output in Great Britain: December 2025, new orders and Construction Output Price Indices, October to December 2025. Office for National Statistics.
- Department for Business and Trade. (2026, February). Construction building materials: commentary January 2026. GOV.UK.
- Ministry of Land, Infrastructure, Transport and Tourism. (2025, October). Quick Estimate of Construction Investment. MLIT.
- Ministry of Data and Statistics. (2025, August). Preliminary Results of the 2024 Construction Survey (Construction Output Record). Ministry of Data and Statistics.
- World Bank Group. (2025, October). PPI 2024 Annual Report. World Bank Group.
- Spec Formliners. (2025, November). Florida retail at scale: Home Depot Wildwood & Viera. Spec Formliners.
- Spec Formliners. (2026, July). Architectural Concrete Formliners. Spec Formliners.
- RECKLI. (2026, May). New US Formliner Production Facility Opens in Georgia. RECKLI.
- Fitzgerald Formliners. (2025, September). Pattern 16969 Davidson Highway Rope. Fitzgerald Formliners.
- Custom Rock Formliner. (2024, December). Easy Ways to Customize Concrete in Architecture. Custom Rock Formliner.
This bibliography is provided for reader reference and uses primary government, standards-body, official trade body, and company sources.
This Report Answers
- What are the estimated Concrete Form Liners Market values in 2026 and 2036?
- What CAGR is forecast for the Concrete Form Liners Market from 2026 to 2036?
- Which material, pattern type, application, end-use, and sales channel segments shape demand?
- Which specification and field-service pressures support concrete form liner purchase activity?
- How do country CAGRs differ across the United States, China, India, and other profiled countries?
- Which companies compete across pattern breadth, reusable liner capability, specification support, and service reach?
- How does FMI validate forecasts using hybrid bottom-up and top-down methodology?
- What should contractors and sourcing teams address before broader account expansion or sourcing commitment?
- How do claims review, sample boards, and project documentation affect supplier selection?
Frequently Asked Questions
What is driving growth in the Concrete Form Liners Market?
Growth is being driven by increasing demand for decorative concrete finishes in commercial and infrastructure projects. Rising use of precast panels and architectural concrete is further supporting demand for reusable form liner systems.
Who are the key players in the Concrete Form Liners Market?
Key companies include Fitzgerald Formliners, Scott System, US Formliner, Spec Formliners, RECKLI, NOE Schaltechnik, Dayton Superior, and Custom Rock Formliner. Competition is based on pattern variety, liner durability, and technical support capabilities.
What is a significant restraint in the Concrete Form Liners Market?
Lengthy approval processes for patterns, mock ups and sample boards can delay product adoption. Unclear installation practices and rework risks also discourage supplier switching on visible concrete projects.
Why should executives track the Concrete Form Liners Market?
Executives should track this category due to liner choice affecting rework exposure and handover timing in visible concrete work. Supplier capability also shapes whether a project team expands from trial orders to recurring use.
What business problem does the Concrete Form Liners Market address?
The market addresses surface finish variation on architectural and infrastructure concrete during visible wall and panel work. Form liners help contractors transfer approved patterns into repeatable pours without adding separate cladding steps.
What should procurement leaders evaluate before selecting suppliers?
Procurement leaders should assess pattern library depth and liner reuse evidence before shortlisting suppliers. Sample-board support and replacement lead times should then shape final award decisions across repeat concrete programs. Field instructions and local service ownership should guide broader sourcing decisions after mock-up approval.
What limits return on investment for contractors?
Return on investment is often constrained by poor sample approval and unclear installation responsibility on visible concrete packages. Excessive rework after stripping reduces the value gained from lower unit pricing on visible panels.
How should suppliers build long-term account confidence?
Suppliers should provide pattern files and job-specific installation guidance before the first pour on each project. Confidence improves if the supplier supports field issues and replacement timing after approval in repeat accounts.
Preview the report firsthand - request a free sample
Get SampleGet the brochure for pricing and purchase details.
Get PDFTable of Content
- Key Takeaways
- Market Size and CAGR
- Top Growth Driver
- Fastest Growing Segment
- Leading Region
- Key Companies
- Emerging Opportunities
- Executive Summary
- Global Market Outlook
- Demand-side Trends
- Supply-side Trends
- Technology Roadmap Analysis
- Analysis and Recommendations
- Analyst Perspective (What is happening? Why now? What should investors know?)
- Key Questions Answered
- How large is the market?
- What is the CAGR?
- What are key trends?
- Which region dominates?
- Who are the leaders?
- Market Overview
- Market Coverage / Taxonomy
- Market Definition / Scope / Limitations
- Research Methodology
- Chapter Orientation
- Analytical Lens and Working Hypotheses
- Market Structure, Signals, and Trend Drivers
- Benchmarking and Cross-market Comparability
- Market Sizing, Forecasting, and Opportunity Mapping
- Research Design and Evidence Framework
- Desk Research Programme (Secondary Evidence)
- Expert Input and Fieldwork (Primary Evidence)
- Tooling, Models, and Reference Databases
- Data Engineering and Model Build
- Quality Assurance and Audit Trail
- Market Background
- Market Dynamics (Drivers, Restraints, Opportunity, Trends)
- Scenario Forecast (Optimistic, Likely, Conservative)
- Impact Analysis
- AI Impact
- Sustainability Impact
- Regulatory Impact
- Technology Impact
- Consumer / Buyer Analysis
- Purchase Drivers
- Adoption Barriers
- Buyer Journey
- Opportunity Map Analysis
- Product Life Cycle Analysis
- Supply Chain Analysis
- Investment Feasibility Matrix
- Value Chain Analysis
- PESTLE and Porter's Analysis
- Regulatory Landscape
- Regional Parent Market Outlook
- Production and Consumption Statistics
- Import and Export Statistics
- Global Market Analysis and Forecast, 2021 to 2036
- Historical Market Size Value (USD Million) & Volume (Unit) Analysis, 2021 to 2025
- Current and Future Market Size Value (USD Million) & Volume (Unit) Projections, 2026 to 2036
- Y-o-Y Growth Trend Analysis
- Absolute $ Opportunity Analysis
- Global Market Pricing Analysis, 2021 to 2036
- Global Market Analysis and Forecast, By Material, 2021 to 2036
- Introduction / Key Findings
- Historical Market Size Value (USD Million) & Volume (Unit) Analysis By Material, 2021 to 2025
- Current and Future Market Size Value (USD Million) & Volume (Unit) Analysis and Forecast By Material, 2026 to 2036
- Elastomeric Form Liners
- Plastic Form Liners
- Foam Form Liners
- Fiberglass - Other
- Elastomeric Form Liners
- Y-o-Y Growth Trend Analysis By Material, 2021 to 2025
- Absolute $ Opportunity Analysis By Material, 2026 to 2036
- Global Market Analysis and Forecast, By Pattern Type, 2021 to 2036
- Introduction / Key Findings
- Historical Market Size Value (USD Million) & Volume (Unit) Analysis By Pattern Type, 2021 to 2025
- Current and Future Market Size Value (USD Million) & Volume (Unit) Analysis and Forecast By Pattern Type, 2026 to 2036
- Brick - Stone Texture
- Wood Grain
- Geometric - Custom
- Smooth - Utility
- Brick - Stone Texture
- Y-o-Y Growth Trend Analysis By Pattern Type, 2021 to 2025
- Absolute $ Opportunity Analysis By Pattern Type, 2026 to 2036
- Global Market Analysis and Forecast, By Application, 2021 to 2036
- Introduction / Key Findings
- Historical Market Size Value (USD Million) & Volume (Unit) Analysis By Application, 2021 to 2025
- Current and Future Market Size Value (USD Million) & Volume (Unit) Analysis and Forecast By Application, 2026 to 2036
- Architectural Concrete
- Infrastructure Walls
- Precast Panels
- Retaining Walls
- Architectural Concrete
- Y-o-Y Growth Trend Analysis By Application, 2021 to 2025
- Absolute $ Opportunity Analysis By Application, 2026 to 2036
- Global Market Analysis and Forecast, By End Use, 2021 to 2036
- Introduction / Key Findings
- Historical Market Size Value (USD Million) & Volume (Unit) Analysis By End Use, 2021 to 2025
- Current and Future Market Size Value (USD Million) & Volume (Unit) Analysis and Forecast By End Use, 2026 to 2036
- Commercial Construction
- Infrastructure
- Residential
- Precast Plants
- Commercial Construction
- Y-o-Y Growth Trend Analysis By End Use, 2021 to 2025
- Absolute $ Opportunity Analysis By End Use, 2026 to 2036
- Global Market Analysis and Forecast, By Sales Channel, 2021 to 2036
- Introduction / Key Findings
- Historical Market Size Value (USD Million) & Volume (Unit) Analysis By Sales Channel, 2021 to 2025
- Current and Future Market Size Value (USD Million) & Volume (Unit) Analysis and Forecast By Sales Channel, 2026 to 2036
- Direct Manufacturer
- Concrete Contractors
- Building Material Dealers
- Direct Manufacturer
- Y-o-Y Growth Trend Analysis By Sales Channel, 2021 to 2025
- Absolute $ Opportunity Analysis By Sales Channel, 2026 to 2036
- Global Market Analysis and Forecast, By Region, 2021 to 2036
- Introduction
- Historical Market Size Value (USD Million) & Volume (Unit) Analysis By Region, 2021 to 2025
- Current Market Size Value (USD Million) & Volume (Unit) Analysis and Forecast By Region, 2026 to 2036
- North America
- Latin America
- Western Europe
- Eastern Europe
- East Asia
- South Asia and Pacific
- Middle East & Africa
- Market Attractiveness Analysis By Region
- North America Market Analysis and Forecast, By Country, 2021 to 2036
- Historical Market Size Value (USD Million) & Volume (Unit) Trend Analysis By Market Taxonomy, 2021 to 2025
- Market Size Value (USD Million) & Volume (Unit) Forecast By Market Taxonomy, 2026 to 2036
- By Country
- USA
- Canada
- Mexico
- By Material
- By Pattern Type
- By Application
- By End Use
- By Sales Channel
- By Country
- Market Attractiveness Analysis
- By Country
- By Material
- By Pattern Type
- By Application
- By End Use
- By Sales Channel
- Key Takeaways
- Latin America Market Analysis and Forecast, By Country
- Historical Market Size Value (USD Million) & Volume (Unit) Trend Analysis By Market Taxonomy, 2021 to 2025
- Market Size Value (USD Million) & Volume (Unit) Forecast By Market Taxonomy, 2026 to 2036
- By Country
- Brazil
- Chile
- Rest of Latin America
- By Material
- By Pattern Type
- By Application
- By End Use
- By Sales Channel
- By Country
- Market Attractiveness Analysis
- By Country
- By Material
- By Pattern Type
- By Application
- By End Use
- By Sales Channel
- Key Takeaways
- Western Europe Market Analysis and Forecast, By Country
- Historical Market Size Value (USD Million) & Volume (Unit) Trend Analysis By Market Taxonomy, 2021 to 2025
- Market Size Value (USD Million) & Volume (Unit) Forecast By Market Taxonomy, 2026 to 2036
- By Country
- Germany
- UK
- Italy
- Spain
- France
- Nordic
- BENELUX
- Rest of Western Europe
- By Material
- By Pattern Type
- By Application
- By End Use
- By Sales Channel
- By Country
- Market Attractiveness Analysis
- By Country
- By Material
- By Pattern Type
- By Application
- By End Use
- By Sales Channel
- Key Takeaways
- Eastern Europe Market Analysis and Forecast, By Country
- Historical Market Size Value (USD Million) & Volume (Unit) Trend Analysis By Market Taxonomy, 2021 to 2025
- Market Size Value (USD Million) & Volume (Unit) Forecast By Market Taxonomy, 2026 to 2036
- By Country
- Russia
- Poland
- Hungary
- Balkan & Baltic
- Rest of Eastern Europe
- By Material
- By Pattern Type
- By Application
- By End Use
- By Sales Channel
- By Country
- Market Attractiveness Analysis
- By Country
- By Material
- By Pattern Type
- By Application
- By End Use
- By Sales Channel
- Key Takeaways
- East Asia Market Analysis and Forecast, By Country
- Historical Market Size Value (USD Million) & Volume (Unit) Trend Analysis By Market Taxonomy, 2021 to 2025
- Market Size Value (USD Million) & Volume (Unit) Forecast By Market Taxonomy, 2026 to 2036
- By Country
- China
- Japan
- South Korea
- By Material
- By Pattern Type
- By Application
- By End Use
- By Sales Channel
- By Country
- Market Attractiveness Analysis
- By Country
- By Material
- By Pattern Type
- By Application
- By End Use
- By Sales Channel
- Key Takeaways
- South Asia and Pacific Market Analysis and Forecast, By Country
- Historical Market Size Value (USD Million) & Volume (Unit) Trend Analysis By Market Taxonomy, 2021 to 2025
- Market Size Value (USD Million) & Volume (Unit) Forecast By Market Taxonomy, 2026 to 2036
- By Country
- India
- ASEAN
- Australia & New Zealand
- Rest of South Asia and Pacific
- By Material
- By Pattern Type
- By Application
- By End Use
- By Sales Channel
- By Country
- Market Attractiveness Analysis
- By Country
- By Material
- By Pattern Type
- By Application
- By End Use
- By Sales Channel
- Key Takeaways
- Middle East & Africa Market Analysis and Forecast, By Country
- Historical Market Size Value (USD Million) & Volume (Unit) Trend Analysis By Market Taxonomy, 2021 to 2025
- Market Size Value (USD Million) & Volume (Unit) Forecast By Market Taxonomy, 2026 to 2036
- By Country
- Kingdom of Saudi Arabia
- Other GCC Countries
- Türkiye
- South Africa
- Other African Union
- Rest of Middle East & Africa
- By Material
- By Pattern Type
- By Application
- By End Use
- By Sales Channel
- By Country
- Market Attractiveness Analysis
- By Country
- By Material
- By Pattern Type
- By Application
- By End Use
- By Sales Channel
- Key Takeaways
- Key Countries Market Analysis
- USA
- Pricing Analysis
- Market Share Analysis, 2025
- By Material
- By Pattern Type
- By Application
- By End Use
- By Sales Channel
- Canada
- Pricing Analysis
- Market Share Analysis, 2025
- By Material
- By Pattern Type
- By Application
- By End Use
- By Sales Channel
- Mexico
- Pricing Analysis
- Market Share Analysis, 2025
- By Material
- By Pattern Type
- By Application
- By End Use
- By Sales Channel
- Brazil
- Pricing Analysis
- Market Share Analysis, 2025
- By Material
- By Pattern Type
- By Application
- By End Use
- By Sales Channel
- Chile
- Pricing Analysis
- Market Share Analysis, 2025
- By Material
- By Pattern Type
- By Application
- By End Use
- By Sales Channel
- Germany
- Pricing Analysis
- Market Share Analysis, 2025
- By Material
- By Pattern Type
- By Application
- By End Use
- By Sales Channel
- UK
- Pricing Analysis
- Market Share Analysis, 2025
- By Material
- By Pattern Type
- By Application
- By End Use
- By Sales Channel
- Italy
- Pricing Analysis
- Market Share Analysis, 2025
- By Material
- By Pattern Type
- By Application
- By End Use
- By Sales Channel
- Spain
- Pricing Analysis
- Market Share Analysis, 2025
- By Material
- By Pattern Type
- By Application
- By End Use
- By Sales Channel
- France
- Pricing Analysis
- Market Share Analysis, 2025
- By Material
- By Pattern Type
- By Application
- By End Use
- By Sales Channel
- India
- Pricing Analysis
- Market Share Analysis, 2025
- By Material
- By Pattern Type
- By Application
- By End Use
- By Sales Channel
- ASEAN
- Pricing Analysis
- Market Share Analysis, 2025
- By Material
- By Pattern Type
- By Application
- By End Use
- By Sales Channel
- Australia & New Zealand
- Pricing Analysis
- Market Share Analysis, 2025
- By Material
- By Pattern Type
- By Application
- By End Use
- By Sales Channel
- China
- Pricing Analysis
- Market Share Analysis, 2025
- By Material
- By Pattern Type
- By Application
- By End Use
- By Sales Channel
- Japan
- Pricing Analysis
- Market Share Analysis, 2025
- By Material
- By Pattern Type
- By Application
- By End Use
- By Sales Channel
- South Korea
- Pricing Analysis
- Market Share Analysis, 2025
- By Material
- By Pattern Type
- By Application
- By End Use
- By Sales Channel
- Russia
- Pricing Analysis
- Market Share Analysis, 2025
- By Material
- By Pattern Type
- By Application
- By End Use
- By Sales Channel
- Poland
- Pricing Analysis
- Market Share Analysis, 2025
- By Material
- By Pattern Type
- By Application
- By End Use
- By Sales Channel
- Hungary
- Pricing Analysis
- Market Share Analysis, 2025
- By Material
- By Pattern Type
- By Application
- By End Use
- By Sales Channel
- Kingdom of Saudi Arabia
- Pricing Analysis
- Market Share Analysis, 2025
- By Material
- By Pattern Type
- By Application
- By End Use
- By Sales Channel
- Türkiye
- Pricing Analysis
- Market Share Analysis, 2025
- By Material
- By Pattern Type
- By Application
- By End Use
- By Sales Channel
- South Africa
- Pricing Analysis
- Market Share Analysis, 2025
- By Material
- By Pattern Type
- By Application
- By End Use
- By Sales Channel
- USA
- Market Structure Analysis
- Competition Dashboard
- Competition Benchmarking
- Market Share Analysis of Top Players
- By Regional
- By Material
- By Pattern Type
- By Application
- By End Use
- By Sales Channel
- Emerging Startups
- Innovation Benchmarking
- Competition Analysis
- Competition Deep Dive
- Fitzgerald Formliners
- Overview
- Product Portfolio
- Profitability by Market Segments (Product/Region/Sales Channel)
- Sales Footprint
- Strategy Overview
- Marketing Strategy
- Product Strategy
- Channel Strategy
- Scott System
- US Formliner
- Spec Formliners
- RECKLI
- NOE-Schaltechnik
- Dayton Superior
- and Custom Rock Formliner
- Fitzgerald Formliners
- Case Studies
- Success Stories
- Recent Developments
- Competition Deep Dive
- Assumptions & Acronyms Used


