Reports

- Global Locations -

Headquarters

Future Market Insights, Inc.

Christiana Corporate, 200
Continental Drive, Suite 401,
Newark, Delaware - 19713,
United States

T: +1-845-579-5705

Americas

Future Market Insights, Inc.

616 Corporate Way, Suite 2-9018,
Valley Cottage, NY 10989, United States

T: +1-347-918-3531

MEA

Future Market Insights

1602-6 Jumeirah Bay X2 Tower, Plot No: JLT-PH2-X2A,
Jumeirah Lakes Towers, Dubai,
United Arab Emirates

Europe

Future Market Insights

3rd Floor, 207 Regent Street,
W1B 3HH London
United Kingdom

T: + 44 (0) 20 8123 9659
D: +44 (0) 20 3287 4268

Asia Pacific

Future Market Insights

IndiaLand Global Tech Park, Unit UG-1, Behind Grand HighStreet, Phase 1, Hinjawadi, MH, Pune – 411057, India

Desiccated Coconut Market Outlook for 2024 to 2034

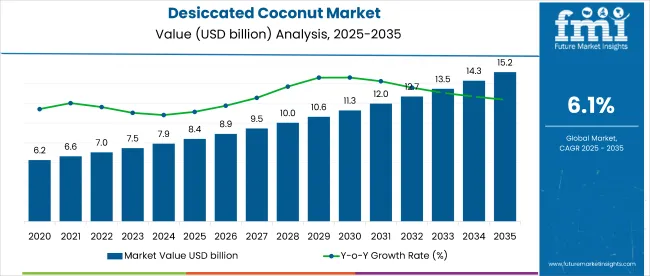
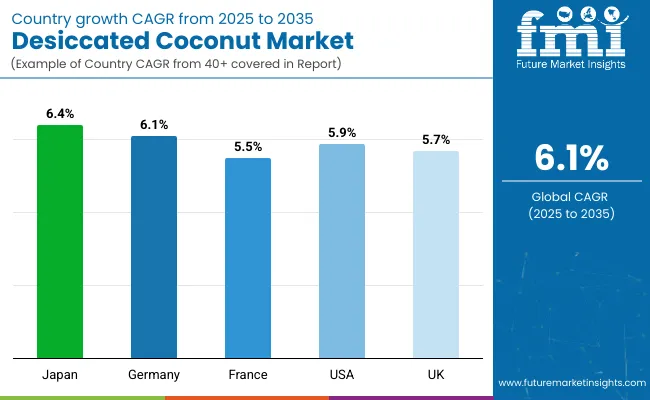
The desiccated coconut market has secured a decent consumer base to generate a revenue of around US$ 8,016.7 million in 2024. The overall market is set to progress at a moderate CAGR of 6.1% during the forecast period. The desiccated coconut industry share is expanding promisingly to garner a revenue of around US$ 14,452.4 million by 2034.

Trends & Analysis

  • Owing to its mild flavor and sweet fragrance, desiccated coconut has been gaining high popularity among bakers and chefs preparing gourmet dishes.
  • It is a popular option for people who are sensitive to gluten as it is inherently gluten-free.
  • Nowadays, health-conscious millennials are also demanding coconut-topped confectionaries and beverages that are nutritious and yet have good taste.
Report Attribute Details
Market Size (2024) US$ 8,016.7 million
Market Forecast Value (2034) US$ 14,452.4 million
Market Projected Growth Rate (2024 to 2034) 6.1% CAGR

Don't pay for what you don't need

Customize your report by selecting specific countries or regions and save 30%!

Desiccated Coconut Market Historical Analysis (2019 to 2023) Vs Forecast Outlook (2024 to 2034)

The desiccated coconut industry was valued at US$ 8,005.4 million in 2019. The net worth of the desiccated coconut flakes market surged at a rate of 5.6% between 2019 and 2023.

Surge in adoption of a healthy lifestyle by consumers worldwide to maintain their overall health and boost metabolism drove the dehydrated coconut market during the pandemic years. Moreover, a general shift toward natural and organic food items during this historical period helped in positioning the desiccated organic coconut market firmly.

Attributes Details
Desiccated Coconut Industry Value (2019) US$ 8,005.4 million
Market Historical Growth Rate (CAGR 2019 to 2023) 5.6% CAGR

Prominent Factors Fueling the Market Growth

Coconut has a wide applicability in confectionary items, baked goods, and coffee. In addition, it is considered to be an integral part of functional beverages. So, the rising demand for desiccated coconuts on the back of their increased use in the preparation of food items such as roasted coconut chips and beverages that people can include in snacks is set to aid growth.

The expansion of the food service industry and the escalating adoption of advanced technologies for the manufacturing of novel food ingredients have fueled the market trends recently. Coconut in dried form can be used in a large number of applications. For instance, a coconut in its raw grated form can be utilized in chocolate bars, cakes, and puddings.

Nandini Roy Choudhury

Principal Consultant

Talk to Analyst

Find your sweet spots for generating winning opportunities in this market.

Comparative View of Adjacent Markets

Well-known desiccated coconut powder market players have expanded their product portfolio by entering into other related niche markets in recent years. One such lucrative sector is the traditional coconut milk market with a sufficient consumer base and well-established supply chain. The coconut flour market is in an early stage of development which can provide further opportunities for diversification.

Desiccated Coconut Market:

Attributes Desiccated Coconut Market
CAGR (2024 to 2034) 6.1%
Growth Factor Growing inclination toward natural, healthful meals has increased the consumption of coconut in all its forms.
Market Opportunities Organic desiccated coconut to exhibit higher demand and new growth opportunities for the market players.
Market Challenges Consumer understanding of how to utilize desiccated or powdered coconut in cooking or baking is widely inadequate.

Coconut Flour Market:

Attributes Coconut Flour Market
CAGR (2024 to 2034) 7.8%
Growth Factor Growing demand for high-fiber snacks or functional packaged foods that use coconut flour.
Market Opportunities End users are experimenting with the distinctive features of coconut flour in baking and cuisine.
Market Challenges Maintaining the consistent quality of coconut flour is difficult and it restricts the market supply of the product.

Coconut Milk Market:

Attributes Coconut Milk Market
CAGR (2024 to 2034) 6.3%
Growth Factor Coconut milk is becoming more popular as a dairy-free substitute for cooking or baking conventional milk-based recipes.
Market Opportunities Emerging trends of using coconut milk in restaurants and bars as a component in cocktails, alcoholic beverages, and other drinks.
Market Challenges Expanding market share of various other plant-based milk substitutes, such as almond milk, oat milk, soy milk, and cashew milk.

Country-wise Insights

The table below lists the countries that are observed to be creating enough opportunities for their in-house desiccated coconut producers to meet the peak demand.

Regional Market Comparison CAGR (2024 to 2034)
United States 7.1%
Germany 5.0%
United Kingdom 4.9%
China 4.1%
India 5.6%

Cardiovascular Patients are Boosting Desiccated Coconut Demand in the United States

The United States desiccated coconut market players are well positioned to follow a lucrative year-on-year growth rate of 7.1% from 2024 to 2034.

As desiccated coconut offers numerous beneficial properties such as low trans-fats or cholesterol content, its utilization is projected to surge in the food industry across the United States. The rising prevalence of cardiovascular diseases across the country is another vital factor that is expected to drive demand for dried desiccated coconut in the upcoming decade.

European Nations are Influencing Germany’s Dried Coconut Market Exports

Sales of desiccated coconut in Germany are observed to develop at 5.0% each year which could continue till 2034.

Consumers in Western Europe mainly prefer products that are rich in vitamins and minerals as well as low in cholesterol. Moreover, higher consumption of coconut-based products such as coconut cream, and coconut chocolate in Europe is resulting in a higher supply of desiccated coconuts from Germany to other regional markets.

Organic Movement has Evolved the Coconut Product Market in the United Kingdom

The vegan movement is set to drive the desiccated coconut product market sales at 4.9% CAGR through 2034 in the United Kingdom.

The growing popularity of plant-based and vegan diets has expanded the coconut meat market sales in the United Kingdom in the last few years. Moreover, health-conscious customers in the country are looking more for organic alternatives as it is devoid of chemicals and preservatives. Also, consumers in the United Kingdom prefer online channels to buy frozen desiccated coconut, which has favored regional market expansion.

China Desiccated Coconut Industry is Growing Impressively

The desiccated coconut industry of China has been gaining traction in recent years and is about to advance at 4.1% CAGR from 2024 to 2034.

The increased spending capacity of the growing population and shifting consumer preference for healthy food alternatives positively impact the market in China. In addition, the low price, easy availability, and long shelf-life of desiccated coconut, along with its numerous health benefits, have attracted the attention of the Chinese government to develop it as a profitable small-scale industrial sector in the country.

India Set to Dominate the Asia Pacific Desiccated Coconut Flakes Market

India currently is the most lucrative market for desiccated coconut producers they are striving to achieve an average CAGR of 5.6% for the next ten years.

It is predominantly grown in Southeast Asian countries and extensively used in Indian, Burmese, and Indonesian cuisines. Besides, higher consumption of desiccated coconut in India's domestic market encourages desiccated coconut manufacturers to export larger quantities to neighboring countries.

Get the data you need at a Fraction of the cost

Personalize your report by choosing insights you need
and save 40%!

Category-wise Insights

Desiccated Coconut Shreds are in Higher Demand in the Food & Beverage Industry

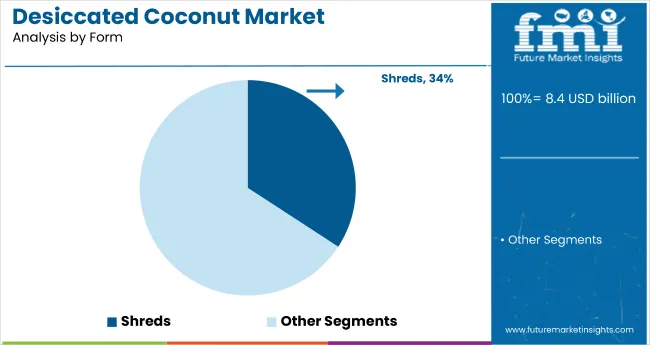
Based on form type, the desiccated coconut in shredded form is poised to contribute 34.2% of the total demand in 2024.

Attributes Details
Top Form Type or Segment Shred
Total Market Share in 2024 to 2034 34.2%

Desiccated shredded coconut is gaining immense popularity across the globe owing to its wide range of applications in the food and beverage industry. It also provides numerous health benefits such as anemia prevention, antibacterial properties, healthy heart, and breathing regulation.

Bakeries are in Greater Need of Desiccated Coconut Powder

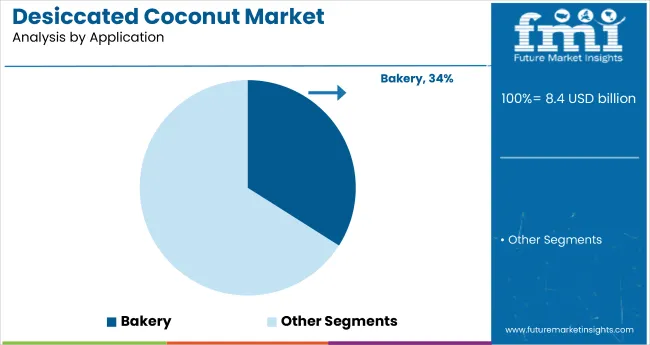
Based on application, 34% of the total desiccated coconut produced in 2024 could be consumed by the bakery sector.

Attributes Details
Top Application Type or Segment Bakery
Total Market Share in 2024 34%

Consumption of powdered coconut-based food items can improve cholesterol levels in the human body. These help in lowering bad cholesterol or LDL and increasing good cholesterol or HDL. Owing to the aforementioned benefits, demand for powdered desiccated coconut in bakeries is expected to surge in the next few years.

Competitive Landscape for Desiccated Coconut Market

The overall market is highly concentrated in tropical regions and the producers located here are focusing on introducing new products to attract more consumers. Some of the other top companies in the market are engaging in collaborations with local players to conduct research and development activities and discover innovative products.

Recent Developments

  • In October 2022, Biona Organic made a new addition to its award-winning coconut product line, Biona Desiccated Coconut. It is manufactured with 100% fresh organic coconut kernels to meet the growing demand for natural and organic baking ingredients. This naturally high-fiber product lends a crisp texture and coconutty flavor to a wide range of sweet and savory recipes, including baked goods, smoothies, and aromatic curries making them ideal for all health-conscious foodies.
  • In February 2023, India-based iD Fresh Food introduced its Smart Sip Tender Coconut and Grated Coconut packaged in coconut shell. The firm has adopted this novel and environmentally friendly packaging solution in an endeavor to provide sustainable solutions for its goods. The firm also claims its Grated Coconut provides a healthier alternative to the chemically preserved frozen or desiccated coconut currently accessible in the market.

Key Players Profiled in the Report

  • Celebes Coconut Corporation
  • Ken Taste Products Limited
  • VV Industries
  • Coloma Bio Organic
  • Bake King
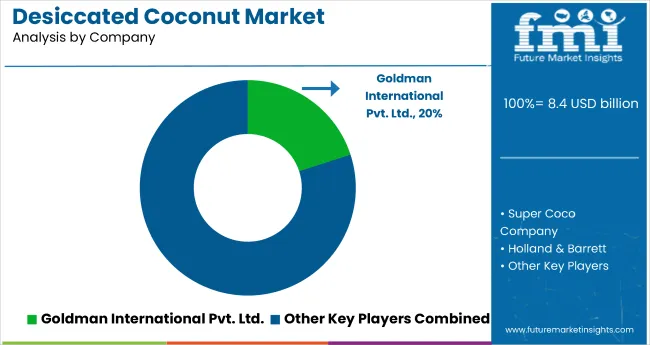
  • Goldman International Pvt. Ltd.
  • Super Coco Company
  • Holland & Barrett
  • Primex Coco Products Inc.
  • CBL Natural Foods
  • S & P industries SDN. BHD.
  • Pacific Eastern Coconut Utama
  • VIET DELTA Corporation
  • Silvermill Group
  • Cocomi
  • Caribean
  • Fiesta

Key Coverage in the Desiccated Coconut Market Report

  • Adjacent Study on Desiccated Coconut Machine Market
  • Market Dynamics of Coconut Flakes
  • Overview of Coconut Powder Market
  • Impact of Dehydrated Coconut Applications

Desiccated Coconut Market Report Scope

Attribute Details
Estimated Market Size (2024) US$ 8,016.7 million
Projected Market Size (2034) US$ 14,452.4 million
Anticipated Growth Rate (2024 to 2034) 6.1%
Forecast Period 2024 to 2034
Historical Data Available for 2019 to 2023
Market Analysis US$ million or billion for Value and Units for Volume
Key Regions Covered North America, Latin America, Europe, Middle East & Africa (MEA), East Asia, South Asia and Oceania
Key Countries Covered United States, Canada, Brazil, Mexico, Germany, Spain, Italy, France, United Kingdom, Russia, China, India, Australia & New Zealand, GCC Countries, and South Africa
Key Segments Covered By Product Type, By Application, By gdgdg, By End Use Verticals, and By Region
Key Companies Profiled
  • Celebes Coconut Corporation
  • Ken Taste Products Limited
  • VV Industries
  • Coloma Bio Organic
  • Bake King
  • Goldman International Pvt. Ltd.
  • Super Coco Company
  • Holland & Barrett
  • Primex Coco Products Inc.
  • CBL Natural Foods
  • S & P industries SDN. BHD.
  • Pacific Eastern Coconut Utama
  • VIET DELTA Corporation
  • Silvermill Group
  • Cocomi
  • Caribean
  • Fiesta
Report Coverage Market Forecast, Company Share Analysis, Competition Intelligence, DROT Analysis, Market Dynamics and Challenges, and Strategic Growth Initiatives
Customization & Pricing Available upon Request

Key Segments Covered by Desiccated Coconut Industry Survey Report

By Form Type:

  • Powder
  • Granular
  • Flakes
  • Chips
  • Shreds

By Application:

  • Bakery
  • Confectionery
  • Dairy Products
  • Frozen Dessert
  • Other Applications

By Distribution Channel:

  • Direct
  • Indirect
    • Hypermarkets/Supermarkets
    • Convenience Stores
    • Specialty Stores
    • Independent Retailers
    • Online Retailers

By Region:

  • North America
  • Latin America
  • Europe
  • East Asia
  • South Asia and Pacific
  • Middle East and Africa (MEA)

Frequently Asked Questions

How Big is the Desiccated Coconut Market Currently?

The market is valued at US$ 8,016.7 million in 2024.

What is the Growth Outlook of the Desiccated Coconut Market?

The market to rise at 6.1% during the forecast period.

What is the Projected Value of Desiccated Coconut Market by 2034?

The market is predicted to be valued at US$ 14,452.4 million by 2034.

What was the Historical Size of the Desiccated Coconut Market?

The market was valued at US$ 8,005.4 million in 2019.

Which Form Segment Dominates the Market?

Shred segment accounts for nearly 34.2% revenue share of the market.

Which Regional Market has the Highest Growth Potential?

The United States is predicted to witness a CAGR of 7.1% in sales of desiccated coconuts through 2034.

Table of Content

1. Executive Summary

    1.1. Global Market Outlook

    1.2. Demand-side Trends

    1.3. Supply-side Trends

    1.4. Technology Roadmap Analysis

    1.5. Analysis and Recommendations

2. Market Overview

    2.1. Market Coverage / Taxonomy

    2.2. Market Definition / Scope / Limitations

3. Market Background

    3.1. Market Dynamics

        3.1.1. Drivers

        3.1.2. Restraints

        3.1.3. Opportunity

        3.1.4. Trends

    3.2. Scenario Forecast

        3.2.1. Demand in Optimistic Scenario

        3.2.2. Demand in Likely Scenario

        3.2.3. Demand in Conservative Scenario

    3.3. Opportunity Map Analysis

    3.4. Product Life Cycle Analysis

    3.5. Supply Chain Analysis

        3.5.1. Supply Side Participants and their Roles

            3.5.1.1. Producers

            3.5.1.2. Mid-Level Participants

        3.5.2. Value Added and Value Created at Node in the Supply Chain

        3.5.3. List of Raw Material Suppliers

        3.5.4. List of Existing and Potential Buyer’s

    3.6. Investment Feasibility Matrix

    3.7. Value Chain Analysis

        3.7.1. Profit Margin Analysis

        3.7.2. Retailers

    3.8. PESTLE and Porter’s Analysis

    3.9. Regulatory Landscape

        3.9.1. By Key Regions

        3.9.2. By Key Countries

    3.10. Regional Parent Market Outlook

    3.11. Production and Consumption Statistics

    3.12. Import and Export Statistics

4. Global Market Analysis 2019 to 2023 and Forecast, 2024 to 2034

    4.1. Historical Market Size Value (US$ Million) & Volume (Tons) Analysis, 2019 to 2023

    4.2. Current and Future Market Size Value (US$ Million) & Volume (Tons) Projections, 2024 to 2034

        4.2.1. Y-o-Y Growth Trend Analysis

        4.2.2. Absolute $ Opportunity Analysis

5. Global Market Analysis 2019 to 2023 and Forecast 2024 to 2034, By Form

    5.1. Introduction / Key Findings

    5.2. Historical Market Size Value (US$ Million) & Volume (Tons) Analysis By Form, 2019 to 2023

    5.3. Current and Future Market Size Value (US$ Million) & Volume (Tons) Analysis and Forecast By Form, 2024 to 2034

        5.3.1. Powder

        5.3.2. Granular

        5.3.3. Flakes

        5.3.4. Chips

        5.3.5. Shreds

    5.4. Y-o-Y Growth Trend Analysis By Form, 2019 to 2023

    5.5. Absolute $ Opportunity Analysis By Form, 2024 to 2034

6. Global Market Analysis 2019 to 2023 and Forecast 2024 to 2034, By Application

    6.1. Introduction / Key Findings

    6.2. Historical Market Size Value (US$ Million) & Volume (Tons) Analysis By Application, 2019 to 2023

    6.3. Current and Future Market Size Value (US$ Million) & Volume (Tons) Analysis and Forecast By Application, 2024 to 2034

        6.3.1. Bakery

        6.3.2. Confectionery

        6.3.3. Dairy Products

        6.3.4. Frozen Dessert

        6.3.5. Other Applications

    6.4. Y-o-Y Growth Trend Analysis By Application, 2019 to 2023

    6.5. Absolute $ Opportunity Analysis By Application, 2024 to 2034

7. Global Market Analysis 2019 to 2023 and Forecast 2024 to 2034, By Distribution Channel

    7.1. Introduction / Key Findings

    7.2. Historical Market Size Value (US$ Million) & Volume (Tons) Analysis By Distribution Channel, 2019 to 2023

    7.3. Current and Future Market Size Value (US$ Million) & Volume (Tons) Analysis and Forecast By Distribution Channel, 2024 to 2034

        7.3.1. Direct

        7.3.2. Indirect

            7.3.2.1. Hypermarkets/Supermarkets

            7.3.2.2. Convenience Stores

            7.3.2.3. Specialty Stores

            7.3.2.4. Online Retailers

    7.4. Y-o-Y Growth Trend Analysis By Distribution Channel, 2019 to 2023

    7.5. Absolute $ Opportunity Analysis By Distribution Channel, 2024 to 2034

8. Global Market Analysis 2019 to 2023 and Forecast 2024 to 2034, By Region

    8.1. Introduction

    8.2. Historical Market Size Value (US$ Million) & Volume (Tons) Analysis By Region, 2019 to 2023

    8.3. Current Market Size Value (US$ Million) & Volume (Tons) Analysis and Forecast By Region, 2024 to 2034

        8.3.1. North America

        8.3.2. Latin America

        8.3.3. Western Europe

        8.3.4. Eastern Europe

        8.3.5. South Asia and Pacific

        8.3.6. East Asia

        8.3.7. Middle East and Africa

    8.4. Market Attractiveness Analysis By Region

9. North America Market Analysis 2019 to 2023 and Forecast 2024 to 2034, By Country

    9.1. Historical Market Size Value (US$ Million) & Volume (Tons) Trend Analysis By Market Taxonomy, 2019 to 2023

    9.2. Market Size Value (US$ Million) & Volume (Tons) Forecast By Market Taxonomy, 2024 to 2034

        9.2.1. By Country

            9.2.1.1. USA

            9.2.1.2. Canada

        9.2.2. By Form

        9.2.3. By Application

        9.2.4. By Distribution Channel

    9.3. Market Attractiveness Analysis

        9.3.1. By Country

        9.3.2. By Form

        9.3.3. By Application

        9.3.4. By Distribution Channel

    9.4. Key Takeaways

10. Latin America Market Analysis 2019 to 2023 and Forecast 2024 to 2034, By Country

    10.1. Historical Market Size Value (US$ Million) & Volume (Tons) Trend Analysis By Market Taxonomy, 2019 to 2023

    10.2. Market Size Value (US$ Million) & Volume (Tons) Forecast By Market Taxonomy, 2024 to 2034

        10.2.1. By Country

            10.2.1.1. Brazil

            10.2.1.2. Mexico

            10.2.1.3. Rest of Latin America

        10.2.2. By Form

        10.2.3. By Application

        10.2.4. By Distribution Channel

    10.3. Market Attractiveness Analysis

        10.3.1. By Country

        10.3.2. By Form

        10.3.3. By Application

        10.3.4. By Distribution Channel

    10.4. Key Takeaways

11. Western Europe Market Analysis 2019 to 2023 and Forecast 2024 to 2034, By Country

    11.1. Historical Market Size Value (US$ Million) & Volume (Tons) Trend Analysis By Market Taxonomy, 2019 to 2023

    11.2. Market Size Value (US$ Million) & Volume (Tons) Forecast By Market Taxonomy, 2024 to 2034

        11.2.1. By Country

            11.2.1.1. Germany

            11.2.1.2. UK

            11.2.1.3. France

            11.2.1.4. Spain

            11.2.1.5. Italy

            11.2.1.6. Rest of Western Europe

        11.2.2. By Form

        11.2.3. By Application

        11.2.4. By Distribution Channel

    11.3. Market Attractiveness Analysis

        11.3.1. By Country

        11.3.2. By Form

        11.3.3. By Application

        11.3.4. By Distribution Channel

    11.4. Key Takeaways

12. Eastern Europe Market Analysis 2019 to 2023 and Forecast 2024 to 2034, By Country

    12.1. Historical Market Size Value (US$ Million) & Volume (Tons) Trend Analysis By Market Taxonomy, 2019 to 2023

    12.2. Market Size Value (US$ Million) & Volume (Tons) Forecast By Market Taxonomy, 2024 to 2034

        12.2.1. By Country

            12.2.1.1. Poland

            12.2.1.2. Russia

            12.2.1.3. Czech Republic

            12.2.1.4. Romania

            12.2.1.5. Rest of Eastern Europe

        12.2.2. By Form

        12.2.3. By Application

        12.2.4. By Distribution Channel

    12.3. Market Attractiveness Analysis

        12.3.1. By Country

        12.3.2. By Form

        12.3.3. By Application

        12.3.4. By Distribution Channel

    12.4. Key Takeaways

13. South Asia and Pacific Market Analysis 2019 to 2023 and Forecast 2024 to 2034, By Country

    13.1. Historical Market Size Value (US$ Million) & Volume (Tons) Trend Analysis By Market Taxonomy, 2019 to 2023

    13.2. Market Size Value (US$ Million) & Volume (Tons) Forecast By Market Taxonomy, 2024 to 2034

        13.2.1. By Country

            13.2.1.1. India

            13.2.1.2. Bangladesh

            13.2.1.3. Australia

            13.2.1.4. New Zealand

            13.2.1.5. Rest of South Asia and Pacific

        13.2.2. By Form

        13.2.3. By Application

        13.2.4. By Distribution Channel

    13.3. Market Attractiveness Analysis

        13.3.1. By Country

        13.3.2. By Form

        13.3.3. By Application

        13.3.4. By Distribution Channel

    13.4. Key Takeaways

14. East Asia Market Analysis 2019 to 2023 and Forecast 2024 to 2034, By Country

    14.1. Historical Market Size Value (US$ Million) & Volume (Tons) Trend Analysis By Market Taxonomy, 2019 to 2023

    14.2. Market Size Value (US$ Million) & Volume (Tons) Forecast By Market Taxonomy, 2024 to 2034

        14.2.1. By Country

            14.2.1.1. China

            14.2.1.2. Japan

            14.2.1.3. South Korea

        14.2.2. By Form

        14.2.3. By Application

        14.2.4. By Distribution Channel

    14.3. Market Attractiveness Analysis

        14.3.1. By Country

        14.3.2. By Form

        14.3.3. By Application

        14.3.4. By Distribution Channel

    14.4. Key Takeaways

15. Middle East and Africa Market Analysis 2019 to 2023 and Forecast 2024 to 2034, By Country

    15.1. Historical Market Size Value (US$ Million) & Volume (Tons) Trend Analysis By Market Taxonomy, 2019 to 2023

    15.2. Market Size Value (US$ Million) & Volume (Tons) Forecast By Market Taxonomy, 2024 to 2034

        15.2.1. By Country

            15.2.1.1. GCC Countries

            15.2.1.2. South Africa

            15.2.1.3. Israel

            15.2.1.4. Rest of MEA

        15.2.2. By Form

        15.2.3. By Application

        15.2.4. By Distribution Channel

    15.3. Market Attractiveness Analysis

        15.3.1. By Country

        15.3.2. By Form

        15.3.3. By Application

        15.3.4. By Distribution Channel

    15.4. Key Takeaways

16. Key Countries Market Analysis

    16.1. USA

        16.1.1. Pricing Analysis

        16.1.2. Market Share Analysis, 2023

            16.1.2.1. By Form

            16.1.2.2. By Application

            16.1.2.3. By Distribution Channel

    16.2. Canada

        16.2.1. Pricing Analysis

        16.2.2. Market Share Analysis, 2023

            16.2.2.1. By Form

            16.2.2.2. By Application

            16.2.2.3. By Distribution Channel

    16.3. Brazil

        16.3.1. Pricing Analysis

        16.3.2. Market Share Analysis, 2023

            16.3.2.1. By Form

            16.3.2.2. By Application

            16.3.2.3. By Distribution Channel

    16.4. Mexico

        16.4.1. Pricing Analysis

        16.4.2. Market Share Analysis, 2023

            16.4.2.1. By Form

            16.4.2.2. By Application

            16.4.2.3. By Distribution Channel

    16.5. Germany

        16.5.1. Pricing Analysis

        16.5.2. Market Share Analysis, 2023

            16.5.2.1. By Form

            16.5.2.2. By Application

            16.5.2.3. By Distribution Channel

    16.6. UK

        16.6.1. Pricing Analysis

        16.6.2. Market Share Analysis, 2023

            16.6.2.1. By Form

            16.6.2.2. By Application

            16.6.2.3. By Distribution Channel

    16.7. France

        16.7.1. Pricing Analysis

        16.7.2. Market Share Analysis, 2023

            16.7.2.1. By Form

            16.7.2.2. By Application

            16.7.2.3. By Distribution Channel

    16.8. Spain

        16.8.1. Pricing Analysis

        16.8.2. Market Share Analysis, 2023

            16.8.2.1. By Form

            16.8.2.2. By Application

            16.8.2.3. By Distribution Channel

    16.9. Italy

        16.9.1. Pricing Analysis

        16.9.2. Market Share Analysis, 2023

            16.9.2.1. By Form

            16.9.2.2. By Application

            16.9.2.3. By Distribution Channel

    16.10. Poland

        16.10.1. Pricing Analysis

        16.10.2. Market Share Analysis, 2023

            16.10.2.1. By Form

            16.10.2.2. By Application

            16.10.2.3. By Distribution Channel

    16.11. Russia

        16.11.1. Pricing Analysis

        16.11.2. Market Share Analysis, 2023

            16.11.2.1. By Form

            16.11.2.2. By Application

            16.11.2.3. By Distribution Channel

    16.12. Czech Republic

        16.12.1. Pricing Analysis

        16.12.2. Market Share Analysis, 2023

            16.12.2.1. By Form

            16.12.2.2. By Application

            16.12.2.3. By Distribution Channel

    16.13. Romania

        16.13.1. Pricing Analysis

        16.13.2. Market Share Analysis, 2023

            16.13.2.1. By Form

            16.13.2.2. By Application

            16.13.2.3. By Distribution Channel

    16.14. India

        16.14.1. Pricing Analysis

        16.14.2. Market Share Analysis, 2023

            16.14.2.1. By Form

            16.14.2.2. By Application

            16.14.2.3. By Distribution Channel

    16.15. Bangladesh

        16.15.1. Pricing Analysis

        16.15.2. Market Share Analysis, 2023

            16.15.2.1. By Form

            16.15.2.2. By Application

            16.15.2.3. By Distribution Channel

    16.16. Australia

        16.16.1. Pricing Analysis

        16.16.2. Market Share Analysis, 2023

            16.16.2.1. By Form

            16.16.2.2. By Application

            16.16.2.3. By Distribution Channel

    16.17. New Zealand

        16.17.1. Pricing Analysis

        16.17.2. Market Share Analysis, 2023

            16.17.2.1. By Form

            16.17.2.2. By Application

            16.17.2.3. By Distribution Channel

    16.18. China

        16.18.1. Pricing Analysis

        16.18.2. Market Share Analysis, 2023

            16.18.2.1. By Form

            16.18.2.2. By Application

            16.18.2.3. By Distribution Channel

    16.19. Japan

        16.19.1. Pricing Analysis

        16.19.2. Market Share Analysis, 2023

            16.19.2.1. By Form

            16.19.2.2. By Application

            16.19.2.3. By Distribution Channel

    16.20. South Korea

        16.20.1. Pricing Analysis

        16.20.2. Market Share Analysis, 2023

            16.20.2.1. By Form

            16.20.2.2. By Application

            16.20.2.3. By Distribution Channel

    16.21. GCC Countries

        16.21.1. Pricing Analysis

        16.21.2. Market Share Analysis, 2023

            16.21.2.1. By Form

            16.21.2.2. By Application

            16.21.2.3. By Distribution Channel

    16.22. South Africa

        16.22.1. Pricing Analysis

        16.22.2. Market Share Analysis, 2023

            16.22.2.1. By Form

            16.22.2.2. By Application

            16.22.2.3. By Distribution Channel

    16.23. Israel

        16.23.1. Pricing Analysis

        16.23.2. Market Share Analysis, 2023

            16.23.2.1. By Form

            16.23.2.2. By Application

            16.23.2.3. By Distribution Channel

17. Market Structure Analysis

    17.1. Competition Dashboard

    17.2. Competition Benchmarking

    17.3. Market Share Analysis of Top Players

        17.3.1. By Regional

        17.3.2. By Form

        17.3.3. By Application

        17.3.4. By Distribution Channel

18. Competition Analysis

    18.1. Competition Deep Dive

        18.1.1. Goldman International Pvt. Ltd.

            18.1.1.1. Overview

            18.1.1.2. Product Portfolio

            18.1.1.3. Profitability by Market Segments

            18.1.1.4. Sales Footprint

            18.1.1.5. Strategy Overview

                18.1.1.5.1. Marketing Strategy

                18.1.1.5.2. Product Strategy

                18.1.1.5.3. Channel Strategy

        18.1.2. Super Coco Company

            18.1.2.1. Overview

            18.1.2.2. Product Portfolio

            18.1.2.3. Profitability by Market Segments

            18.1.2.4. Sales Footprint

            18.1.2.5. Strategy Overview

                18.1.2.5.1. Marketing Strategy

                18.1.2.5.2. Product Strategy

                18.1.2.5.3. Channel Strategy

        18.1.3. Holland & Barrett

            18.1.3.1. Overview

            18.1.3.2. Product Portfolio

            18.1.3.3. Profitability by Market Segments

            18.1.3.4. Sales Footprint

            18.1.3.5. Strategy Overview

                18.1.3.5.1. Marketing Strategy

                18.1.3.5.2. Product Strategy

                18.1.3.5.3. Channel Strategy

        18.1.4. Primex Coco Products Inc.

            18.1.4.1. Overview

            18.1.4.2. Product Portfolio

            18.1.4.3. Profitability by Market Segments

            18.1.4.4. Sales Footprint

            18.1.4.5. Strategy Overview

                18.1.4.5.1. Marketing Strategy

                18.1.4.5.2. Product Strategy

                18.1.4.5.3. Channel Strategy

        18.1.5. CBL Natural Foods

            18.1.5.1. Overview

            18.1.5.2. Product Portfolio

            18.1.5.3. Profitability by Market Segments

            18.1.5.4. Sales Footprint

            18.1.5.5. Strategy Overview

                18.1.5.5.1. Marketing Strategy

                18.1.5.5.2. Product Strategy

                18.1.5.5.3. Channel Strategy

        18.1.6. S & P industries SDN. BHD.

            18.1.6.1. Overview

            18.1.6.2. Product Portfolio

            18.1.6.3. Profitability by Market Segments

            18.1.6.4. Sales Footprint

            18.1.6.5. Strategy Overview

                18.1.6.5.1. Marketing Strategy

                18.1.6.5.2. Product Strategy

                18.1.6.5.3. Channel Strategy

        18.1.7. Pacific Eastern Coconut Utama

            18.1.7.1. Overview

            18.1.7.2. Product Portfolio

            18.1.7.3. Profitability by Market Segments

            18.1.7.4. Sales Footprint

            18.1.7.5. Strategy Overview

                18.1.7.5.1. Marketing Strategy

                18.1.7.5.2. Product Strategy

                18.1.7.5.3. Channel Strategy

        18.1.8. VIET DELTA Corporation

            18.1.8.1. Overview

            18.1.8.2. Product Portfolio

            18.1.8.3. Profitability by Market Segments

            18.1.8.4. Sales Footprint

            18.1.8.5. Strategy Overview

                18.1.8.5.1. Marketing Strategy

                18.1.8.5.2. Product Strategy

                18.1.8.5.3. Channel Strategy

        18.1.9. Silvermill Group

            18.1.9.1. Overview

            18.1.9.2. Product Portfolio

            18.1.9.3. Profitability by Market Segments

            18.1.9.4. Sales Footprint

            18.1.9.5. Strategy Overview

                18.1.9.5.1. Marketing Strategy

                18.1.9.5.2. Product Strategy

                18.1.9.5.3. Channel Strategy

        18.1.10. Ken Taste Products Limited

            18.1.10.1. Overview

            18.1.10.2. Product Portfolio

            18.1.10.3. Profitability by Market Segments

            18.1.10.4. Sales Footprint

            18.1.10.5. Strategy Overview

                18.1.10.5.1. Marketing Strategy

                18.1.10.5.2. Product Strategy

                18.1.10.5.3. Channel Strategy

19. Assumptions & Acronyms Used

20. Research Methodology

Don't pay for what you don't need

Customize your report by selecting specific countries or regions and save 30%!

List of Tables

Table 1: Global Market Value (US$ Million) Forecast by Region, 2019 to 2034

Table 2: Global Market Volume (Tons) Forecast by Region, 2019 to 2034

Table 3: Global Market Value (US$ Million) Forecast by Form, 2019 to 2034

Table 4: Global Market Volume (Tons) Forecast by Form, 2019 to 2034

Table 5: Global Market Value (US$ Million) Forecast by Application, 2019 to 2034

Table 6: Global Market Volume (Tons) Forecast by Application, 2019 to 2034

Table 7: Global Market Value (US$ Million) Forecast by Distribution Channel, 2019 to 2034

Table 8: Global Market Volume (Tons) Forecast by Distribution Channel, 2019 to 2034

Table 9: North America Market Value (US$ Million) Forecast by Country, 2019 to 2034

Table 10: North America Market Volume (Tons) Forecast by Country, 2019 to 2034

Table 11: North America Market Value (US$ Million) Forecast by Form, 2019 to 2034

Table 12: North America Market Volume (Tons) Forecast by Form, 2019 to 2034

Table 13: North America Market Value (US$ Million) Forecast by Application, 2019 to 2034

Table 14: North America Market Volume (Tons) Forecast by Application, 2019 to 2034

Table 15: North America Market Value (US$ Million) Forecast by Distribution Channel, 2019 to 2034

Table 16: North America Market Volume (Tons) Forecast by Distribution Channel, 2019 to 2034

Table 17: Latin America Market Value (US$ Million) Forecast by Country, 2019 to 2034

Table 18: Latin America Market Volume (Tons) Forecast by Country, 2019 to 2034

Table 19: Latin America Market Value (US$ Million) Forecast by Form, 2019 to 2034

Table 20: Latin America Market Volume (Tons) Forecast by Form, 2019 to 2034

Table 21: Latin America Market Value (US$ Million) Forecast by Application, 2019 to 2034

Table 22: Latin America Market Volume (Tons) Forecast by Application, 2019 to 2034

Table 23: Latin America Market Value (US$ Million) Forecast by Distribution Channel, 2019 to 2034

Table 24: Latin America Market Volume (Tons) Forecast by Distribution Channel, 2019 to 2034

Table 25: Western Europe Market Value (US$ Million) Forecast by Country, 2019 to 2034

Table 26: Western Europe Market Volume (Tons) Forecast by Country, 2019 to 2034

Table 27: Western Europe Market Value (US$ Million) Forecast by Form, 2019 to 2034

Table 28: Western Europe Market Volume (Tons) Forecast by Form, 2019 to 2034

Table 29: Western Europe Market Value (US$ Million) Forecast by Application, 2019 to 2034

Table 30: Western Europe Market Volume (Tons) Forecast by Application, 2019 to 2034

Table 31: Western Europe Market Value (US$ Million) Forecast by Distribution Channel, 2019 to 2034

Table 32: Western Europe Market Volume (Tons) Forecast by Distribution Channel, 2019 to 2034

Table 33: Eastern Europe Market Value (US$ Million) Forecast by Country, 2019 to 2034

Table 34: Eastern Europe Market Volume (Tons) Forecast by Country, 2019 to 2034

Table 35: Eastern Europe Market Value (US$ Million) Forecast by Form, 2019 to 2034

Table 36: Eastern Europe Market Volume (Tons) Forecast by Form, 2019 to 2034

Table 37: Eastern Europe Market Value (US$ Million) Forecast by Application, 2019 to 2034

Table 38: Eastern Europe Market Volume (Tons) Forecast by Application, 2019 to 2034

Table 39: Eastern Europe Market Value (US$ Million) Forecast by Distribution Channel, 2019 to 2034

Table 40: Eastern Europe Market Volume (Tons) Forecast by Distribution Channel, 2019 to 2034

Table 41: South Asia and Pacific Market Value (US$ Million) Forecast by Country, 2019 to 2034

Table 42: South Asia and Pacific Market Volume (Tons) Forecast by Country, 2019 to 2034

Table 43: South Asia and Pacific Market Value (US$ Million) Forecast by Form, 2019 to 2034

Table 44: South Asia and Pacific Market Volume (Tons) Forecast by Form, 2019 to 2034

Table 45: South Asia and Pacific Market Value (US$ Million) Forecast by Application, 2019 to 2034

Table 46: South Asia and Pacific Market Volume (Tons) Forecast by Application, 2019 to 2034

Table 47: South Asia and Pacific Market Value (US$ Million) Forecast by Distribution Channel, 2019 to 2034

Table 48: South Asia and Pacific Market Volume (Tons) Forecast by Distribution Channel, 2019 to 2034

Table 49: East Asia Market Value (US$ Million) Forecast by Country, 2019 to 2034

Table 50: East Asia Market Volume (Tons) Forecast by Country, 2019 to 2034

Table 51: East Asia Market Value (US$ Million) Forecast by Form, 2019 to 2034

Table 52: East Asia Market Volume (Tons) Forecast by Form, 2019 to 2034

Table 53: East Asia Market Value (US$ Million) Forecast by Application, 2019 to 2034

Table 54: East Asia Market Volume (Tons) Forecast by Application, 2019 to 2034

Table 55: East Asia Market Value (US$ Million) Forecast by Distribution Channel, 2019 to 2034

Table 56: East Asia Market Volume (Tons) Forecast by Distribution Channel, 2019 to 2034

Table 57: Middle East and Africa Market Value (US$ Million) Forecast by Country, 2019 to 2034

Table 58: Middle East and Africa Market Volume (Tons) Forecast by Country, 2019 to 2034

Table 59: Middle East and Africa Market Value (US$ Million) Forecast by Form, 2019 to 2034

Table 60: Middle East and Africa Market Volume (Tons) Forecast by Form, 2019 to 2034

Table 61: Middle East and Africa Market Value (US$ Million) Forecast by Application, 2019 to 2034

Table 62: Middle East and Africa Market Volume (Tons) Forecast by Application, 2019 to 2034

Table 63: Middle East and Africa Market Value (US$ Million) Forecast by Distribution Channel, 2019 to 2034

Table 64: Middle East and Africa Market Volume (Tons) Forecast by Distribution Channel, 2019 to 2034
Nandini Roy Choudhury

Principal Consultant

Talk to Analyst

Find your sweet spots for generating winning opportunities in this market.

List of Charts

Figure 1: Global Market Value (US$ Million) by Form, 2024 to 2034

Figure 2: Global Market Value (US$ Million) by Application, 2024 to 2034

Figure 3: Global Market Value (US$ Million) by Distribution Channel, 2024 to 2034

Figure 4: Global Market Value (US$ Million) by Region, 2024 to 2034

Figure 5: Global Market Value (US$ Million) Analysis by Region, 2019 to 2034

Figure 6: Global Market Volume (Tons) Analysis by Region, 2019 to 2034

Figure 7: Global Market Value Share (%) and BPS Analysis by Region, 2024 to 2034

Figure 8: Global Market Y-o-Y Growth (%) Projections by Region, 2024 to 2034

Figure 9: Global Market Value (US$ Million) Analysis by Form, 2019 to 2034

Figure 10: Global Market Volume (Tons) Analysis by Form, 2019 to 2034

Figure 11: Global Market Value Share (%) and BPS Analysis by Form, 2024 to 2034

Figure 12: Global Market Y-o-Y Growth (%) Projections by Form, 2024 to 2034

Figure 13: Global Market Value (US$ Million) Analysis by Application, 2019 to 2034

Figure 14: Global Market Volume (Tons) Analysis by Application, 2019 to 2034

Figure 15: Global Market Value Share (%) and BPS Analysis by Application, 2024 to 2034

Figure 16: Global Market Y-o-Y Growth (%) Projections by Application, 2024 to 2034

Figure 17: Global Market Value (US$ Million) Analysis by Distribution Channel, 2019 to 2034

Figure 18: Global Market Volume (Tons) Analysis by Distribution Channel, 2019 to 2034

Figure 19: Global Market Value Share (%) and BPS Analysis by Distribution Channel, 2024 to 2034

Figure 20: Global Market Y-o-Y Growth (%) Projections by Distribution Channel, 2024 to 2034

Figure 21: Global Market Attractiveness by Form, 2024 to 2034

Figure 22: Global Market Attractiveness by Application, 2024 to 2034

Figure 23: Global Market Attractiveness by Distribution Channel, 2024 to 2034

Figure 24: Global Market Attractiveness by Region, 2024 to 2034

Figure 25: North America Market Value (US$ Million) by Form, 2024 to 2034

Figure 26: North America Market Value (US$ Million) by Application, 2024 to 2034

Figure 27: North America Market Value (US$ Million) by Distribution Channel, 2024 to 2034

Figure 28: North America Market Value (US$ Million) by Country, 2024 to 2034

Figure 29: North America Market Value (US$ Million) Analysis by Country, 2019 to 2034

Figure 30: North America Market Volume (Tons) Analysis by Country, 2019 to 2034

Figure 31: North America Market Value Share (%) and BPS Analysis by Country, 2024 to 2034

Figure 32: North America Market Y-o-Y Growth (%) Projections by Country, 2024 to 2034

Figure 33: North America Market Value (US$ Million) Analysis by Form, 2019 to 2034

Figure 34: North America Market Volume (Tons) Analysis by Form, 2019 to 2034

Figure 35: North America Market Value Share (%) and BPS Analysis by Form, 2024 to 2034

Figure 36: North America Market Y-o-Y Growth (%) Projections by Form, 2024 to 2034

Figure 37: North America Market Value (US$ Million) Analysis by Application, 2019 to 2034

Figure 38: North America Market Volume (Tons) Analysis by Application, 2019 to 2034

Figure 39: North America Market Value Share (%) and BPS Analysis by Application, 2024 to 2034

Figure 40: North America Market Y-o-Y Growth (%) Projections by Application, 2024 to 2034

Figure 41: North America Market Value (US$ Million) Analysis by Distribution Channel, 2019 to 2034

Figure 42: North America Market Volume (Tons) Analysis by Distribution Channel, 2019 to 2034

Figure 43: North America Market Value Share (%) and BPS Analysis by Distribution Channel, 2024 to 2034

Figure 44: North America Market Y-o-Y Growth (%) Projections by Distribution Channel, 2024 to 2034

Figure 45: North America Market Attractiveness by Form, 2024 to 2034

Figure 46: North America Market Attractiveness by Application, 2024 to 2034

Figure 47: North America Market Attractiveness by Distribution Channel, 2024 to 2034

Figure 48: North America Market Attractiveness by Country, 2024 to 2034

Figure 49: Latin America Market Value (US$ Million) by Form, 2024 to 2034

Figure 50: Latin America Market Value (US$ Million) by Application, 2024 to 2034

Figure 51: Latin America Market Value (US$ Million) by Distribution Channel, 2024 to 2034

Figure 52: Latin America Market Value (US$ Million) by Country, 2024 to 2034

Figure 53: Latin America Market Value (US$ Million) Analysis by Country, 2019 to 2034

Figure 54: Latin America Market Volume (Tons) Analysis by Country, 2019 to 2034

Figure 55: Latin America Market Value Share (%) and BPS Analysis by Country, 2024 to 2034

Figure 56: Latin America Market Y-o-Y Growth (%) Projections by Country, 2024 to 2034

Figure 57: Latin America Market Value (US$ Million) Analysis by Form, 2019 to 2034

Figure 58: Latin America Market Volume (Tons) Analysis by Form, 2019 to 2034

Figure 59: Latin America Market Value Share (%) and BPS Analysis by Form, 2024 to 2034

Figure 60: Latin America Market Y-o-Y Growth (%) Projections by Form, 2024 to 2034

Figure 61: Latin America Market Value (US$ Million) Analysis by Application, 2019 to 2034

Figure 62: Latin America Market Volume (Tons) Analysis by Application, 2019 to 2034

Figure 63: Latin America Market Value Share (%) and BPS Analysis by Application, 2024 to 2034

Figure 64: Latin America Market Y-o-Y Growth (%) Projections by Application, 2024 to 2034

Figure 65: Latin America Market Value (US$ Million) Analysis by Distribution Channel, 2019 to 2034

Figure 66: Latin America Market Volume (Tons) Analysis by Distribution Channel, 2019 to 2034

Figure 67: Latin America Market Value Share (%) and BPS Analysis by Distribution Channel, 2024 to 2034

Figure 68: Latin America Market Y-o-Y Growth (%) Projections by Distribution Channel, 2024 to 2034

Figure 69: Latin America Market Attractiveness by Form, 2024 to 2034

Figure 70: Latin America Market Attractiveness by Application, 2024 to 2034

Figure 71: Latin America Market Attractiveness by Distribution Channel, 2024 to 2034

Figure 72: Latin America Market Attractiveness by Country, 2024 to 2034

Figure 73: Western Europe Market Value (US$ Million) by Form, 2024 to 2034

Figure 74: Western Europe Market Value (US$ Million) by Application, 2024 to 2034

Figure 75: Western Europe Market Value (US$ Million) by Distribution Channel, 2024 to 2034

Figure 76: Western Europe Market Value (US$ Million) by Country, 2024 to 2034

Figure 77: Western Europe Market Value (US$ Million) Analysis by Country, 2019 to 2034

Figure 78: Western Europe Market Volume (Tons) Analysis by Country, 2019 to 2034

Figure 79: Western Europe Market Value Share (%) and BPS Analysis by Country, 2024 to 2034

Figure 80: Western Europe Market Y-o-Y Growth (%) Projections by Country, 2024 to 2034

Figure 81: Western Europe Market Value (US$ Million) Analysis by Form, 2019 to 2034

Figure 82: Western Europe Market Volume (Tons) Analysis by Form, 2019 to 2034

Figure 83: Western Europe Market Value Share (%) and BPS Analysis by Form, 2024 to 2034

Figure 84: Western Europe Market Y-o-Y Growth (%) Projections by Form, 2024 to 2034

Figure 85: Western Europe Market Value (US$ Million) Analysis by Application, 2019 to 2034

Figure 86: Western Europe Market Volume (Tons) Analysis by Application, 2019 to 2034

Figure 87: Western Europe Market Value Share (%) and BPS Analysis by Application, 2024 to 2034

Figure 88: Western Europe Market Y-o-Y Growth (%) Projections by Application, 2024 to 2034

Figure 89: Western Europe Market Value (US$ Million) Analysis by Distribution Channel, 2019 to 2034

Figure 90: Western Europe Market Volume (Tons) Analysis by Distribution Channel, 2019 to 2034

Figure 91: Western Europe Market Value Share (%) and BPS Analysis by Distribution Channel, 2024 to 2034

Figure 92: Western Europe Market Y-o-Y Growth (%) Projections by Distribution Channel, 2024 to 2034

Figure 93: Western Europe Market Attractiveness by Form, 2024 to 2034

Figure 94: Western Europe Market Attractiveness by Application, 2024 to 2034

Figure 95: Western Europe Market Attractiveness by Distribution Channel, 2024 to 2034

Figure 96: Western Europe Market Attractiveness by Country, 2024 to 2034

Figure 97: Eastern Europe Market Value (US$ Million) by Form, 2024 to 2034

Figure 98: Eastern Europe Market Value (US$ Million) by Application, 2024 to 2034

Figure 99: Eastern Europe Market Value (US$ Million) by Distribution Channel, 2024 to 2034

Figure 100: Eastern Europe Market Value (US$ Million) by Country, 2024 to 2034

Figure 101: Eastern Europe Market Value (US$ Million) Analysis by Country, 2019 to 2034

Figure 102: Eastern Europe Market Volume (Tons) Analysis by Country, 2019 to 2034

Figure 103: Eastern Europe Market Value Share (%) and BPS Analysis by Country, 2024 to 2034

Figure 104: Eastern Europe Market Y-o-Y Growth (%) Projections by Country, 2024 to 2034

Figure 105: Eastern Europe Market Value (US$ Million) Analysis by Form, 2019 to 2034

Figure 106: Eastern Europe Market Volume (Tons) Analysis by Form, 2019 to 2034

Figure 107: Eastern Europe Market Value Share (%) and BPS Analysis by Form, 2024 to 2034

Figure 108: Eastern Europe Market Y-o-Y Growth (%) Projections by Form, 2024 to 2034

Figure 109: Eastern Europe Market Value (US$ Million) Analysis by Application, 2019 to 2034

Figure 110: Eastern Europe Market Volume (Tons) Analysis by Application, 2019 to 2034

Figure 111: Eastern Europe Market Value Share (%) and BPS Analysis by Application, 2024 to 2034

Figure 112: Eastern Europe Market Y-o-Y Growth (%) Projections by Application, 2024 to 2034

Figure 113: Eastern Europe Market Value (US$ Million) Analysis by Distribution Channel, 2019 to 2034

Figure 114: Eastern Europe Market Volume (Tons) Analysis by Distribution Channel, 2019 to 2034

Figure 115: Eastern Europe Market Value Share (%) and BPS Analysis by Distribution Channel, 2024 to 2034

Figure 116: Eastern Europe Market Y-o-Y Growth (%) Projections by Distribution Channel, 2024 to 2034

Figure 117: Eastern Europe Market Attractiveness by Form, 2024 to 2034

Figure 118: Eastern Europe Market Attractiveness by Application, 2024 to 2034

Figure 119: Eastern Europe Market Attractiveness by Distribution Channel, 2024 to 2034

Figure 120: Eastern Europe Market Attractiveness by Country, 2024 to 2034

Figure 121: South Asia and Pacific Market Value (US$ Million) by Form, 2024 to 2034

Figure 122: South Asia and Pacific Market Value (US$ Million) by Application, 2024 to 2034

Figure 123: South Asia and Pacific Market Value (US$ Million) by Distribution Channel, 2024 to 2034

Figure 124: South Asia and Pacific Market Value (US$ Million) by Country, 2024 to 2034

Figure 125: South Asia and Pacific Market Value (US$ Million) Analysis by Country, 2019 to 2034

Figure 126: South Asia and Pacific Market Volume (Tons) Analysis by Country, 2019 to 2034

Figure 127: South Asia and Pacific Market Value Share (%) and BPS Analysis by Country, 2024 to 2034

Figure 128: South Asia and Pacific Market Y-o-Y Growth (%) Projections by Country, 2024 to 2034

Figure 129: South Asia and Pacific Market Value (US$ Million) Analysis by Form, 2019 to 2034

Figure 130: South Asia and Pacific Market Volume (Tons) Analysis by Form, 2019 to 2034

Figure 131: South Asia and Pacific Market Value Share (%) and BPS Analysis by Form, 2024 to 2034

Figure 132: South Asia and Pacific Market Y-o-Y Growth (%) Projections by Form, 2024 to 2034

Figure 133: South Asia and Pacific Market Value (US$ Million) Analysis by Application, 2019 to 2034

Figure 134: South Asia and Pacific Market Volume (Tons) Analysis by Application, 2019 to 2034

Figure 135: South Asia and Pacific Market Value Share (%) and BPS Analysis by Application, 2024 to 2034

Figure 136: South Asia and Pacific Market Y-o-Y Growth (%) Projections by Application, 2024 to 2034

Figure 137: South Asia and Pacific Market Value (US$ Million) Analysis by Distribution Channel, 2019 to 2034

Figure 138: South Asia and Pacific Market Volume (Tons) Analysis by Distribution Channel, 2019 to 2034

Figure 139: South Asia and Pacific Market Value Share (%) and BPS Analysis by Distribution Channel, 2024 to 2034

Figure 140: South Asia and Pacific Market Y-o-Y Growth (%) Projections by Distribution Channel, 2024 to 2034

Figure 141: South Asia and Pacific Market Attractiveness by Form, 2024 to 2034

Figure 142: South Asia and Pacific Market Attractiveness by Application, 2024 to 2034

Figure 143: South Asia and Pacific Market Attractiveness by Distribution Channel, 2024 to 2034

Figure 144: South Asia and Pacific Market Attractiveness by Country, 2024 to 2034

Figure 145: East Asia Market Value (US$ Million) by Form, 2024 to 2034

Figure 146: East Asia Market Value (US$ Million) by Application, 2024 to 2034

Figure 147: East Asia Market Value (US$ Million) by Distribution Channel, 2024 to 2034

Figure 148: East Asia Market Value (US$ Million) by Country, 2024 to 2034

Figure 149: East Asia Market Value (US$ Million) Analysis by Country, 2019 to 2034

Figure 150: East Asia Market Volume (Tons) Analysis by Country, 2019 to 2034

Figure 151: East Asia Market Value Share (%) and BPS Analysis by Country, 2024 to 2034

Figure 152: East Asia Market Y-o-Y Growth (%) Projections by Country, 2024 to 2034

Figure 153: East Asia Market Value (US$ Million) Analysis by Form, 2019 to 2034

Figure 154: East Asia Market Volume (Tons) Analysis by Form, 2019 to 2034

Figure 155: East Asia Market Value Share (%) and BPS Analysis by Form, 2024 to 2034

Figure 156: East Asia Market Y-o-Y Growth (%) Projections by Form, 2024 to 2034

Figure 157: East Asia Market Value (US$ Million) Analysis by Application, 2019 to 2034

Figure 158: East Asia Market Volume (Tons) Analysis by Application, 2019 to 2034

Figure 159: East Asia Market Value Share (%) and BPS Analysis by Application, 2024 to 2034

Figure 160: East Asia Market Y-o-Y Growth (%) Projections by Application, 2024 to 2034

Figure 161: East Asia Market Value (US$ Million) Analysis by Distribution Channel, 2019 to 2034

Figure 162: East Asia Market Volume (Tons) Analysis by Distribution Channel, 2019 to 2034

Figure 163: East Asia Market Value Share (%) and BPS Analysis by Distribution Channel, 2024 to 2034

Figure 164: East Asia Market Y-o-Y Growth (%) Projections by Distribution Channel, 2024 to 2034

Figure 165: East Asia Market Attractiveness by Form, 2024 to 2034

Figure 166: East Asia Market Attractiveness by Application, 2024 to 2034

Figure 167: East Asia Market Attractiveness by Distribution Channel, 2024 to 2034

Figure 168: East Asia Market Attractiveness by Country, 2024 to 2034

Figure 169: Middle East and Africa Market Value (US$ Million) by Form, 2024 to 2034

Figure 170: Middle East and Africa Market Value (US$ Million) by Application, 2024 to 2034

Figure 171: Middle East and Africa Market Value (US$ Million) by Distribution Channel, 2024 to 2034

Figure 172: Middle East and Africa Market Value (US$ Million) by Country, 2024 to 2034

Figure 173: Middle East and Africa Market Value (US$ Million) Analysis by Country, 2019 to 2034

Figure 174: Middle East and Africa Market Volume (Tons) Analysis by Country, 2019 to 2034

Figure 175: Middle East and Africa Market Value Share (%) and BPS Analysis by Country, 2024 to 2034

Figure 176: Middle East and Africa Market Y-o-Y Growth (%) Projections by Country, 2024 to 2034

Figure 177: Middle East and Africa Market Value (US$ Million) Analysis by Form, 2019 to 2034

Figure 178: Middle East and Africa Market Volume (Tons) Analysis by Form, 2019 to 2034

Figure 179: Middle East and Africa Market Value Share (%) and BPS Analysis by Form, 2024 to 2034

Figure 180: Middle East and Africa Market Y-o-Y Growth (%) Projections by Form, 2024 to 2034

Figure 181: Middle East and Africa Market Value (US$ Million) Analysis by Application, 2019 to 2034

Figure 182: Middle East and Africa Market Volume (Tons) Analysis by Application, 2019 to 2034

Figure 183: Middle East and Africa Market Value Share (%) and BPS Analysis by Application, 2024 to 2034

Figure 184: Middle East and Africa Market Y-o-Y Growth (%) Projections by Application, 2024 to 2034

Figure 185: Middle East and Africa Market Value (US$ Million) Analysis by Distribution Channel, 2019 to 2034

Figure 186: Middle East and Africa Market Volume (Tons) Analysis by Distribution Channel, 2019 to 2034

Figure 187: Middle East and Africa Market Value Share (%) and BPS Analysis by Distribution Channel, 2024 to 2034

Figure 188: Middle East and Africa Market Y-o-Y Growth (%) Projections by Distribution Channel, 2024 to 2034

Figure 189: Middle East and Africa Market Attractiveness by Form, 2024 to 2034

Figure 190: Middle East and Africa Market Attractiveness by Application, 2024 to 2034

Figure 191: Middle East and Africa Market Attractiveness by Distribution Channel, 2024 to 2034

Figure 192: Middle East and Africa Market Attractiveness by Country, 2024 to 2034

Recommendations

Food and Beverage

Coconut Flour Market

Published : October 2023

Food and Beverage

Coconut Milk Market

Published : October 2023

Food and Beverage

Coconut Sugar Market

Published : July 2023

Food and Beverage

Coconut Water Market

Published : July 2020

Explore Food and Beverage Insights

View Reports

Desiccated Coconut Market