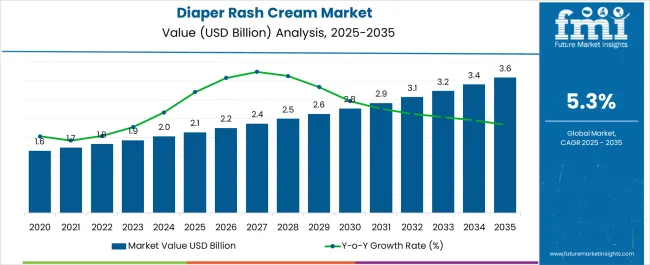
The Diaper Rash Cream Market is estimated to be valued at USD 2.1 billion in 2025 and is projected to reach USD 3.6 billion by 2035, registering a compound annual growth rate (CAGR) of 5.3% over the forecast period.

| Metric | Value |
|---|---|
| Diaper Rash Cream Market Estimated Value in (2025 E) | USD 2.1 billion |
| Diaper Rash Cream Market Forecast Value in (2035 F) | USD 3.6 billion |
| Forecast CAGR (2025 to 2035) | 5.3% |
The diaper rash cream market is showing steady expansion, driven by increasing awareness of infant skincare and rising consumer preference for safe and natural products. Industry updates and product launch announcements have emphasized a clear shift toward organic and plant-based formulations, reflecting growing parental concern over chemical exposure. Healthcare professionals and pediatric associations have reinforced the importance of effective rash prevention, boosting the demand for clinically tested and dermatologist-approved creams.
The rising birth rate in emerging economies, coupled with higher disposable incomes in developed regions, has broadened the consumer base for premium rash care products. Additionally, the household application of diaper rash creams has expanded as parents increasingly rely on convenient, at-home solutions for preventive care and treatment.
Digital commerce growth and retail diversification have enhanced product accessibility, while strategic investments by skincare brands have accelerated innovation in organic and sensitive-skin formulations. Looking forward, the market is expected to benefit from continued emphasis on safe ingredients, expanding infant population demographics, and growing global healthcare awareness.

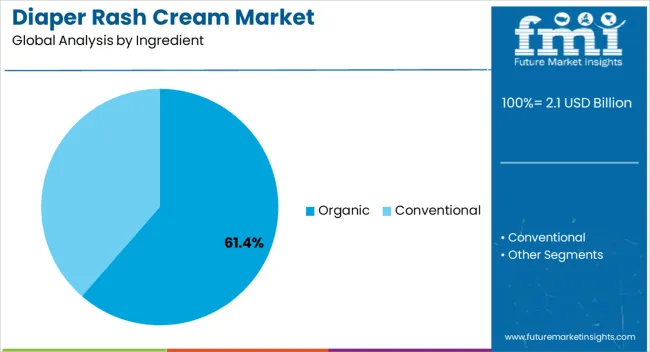
The Organic segment is projected to account for 61.40% of the diaper rash cream market revenue in 2025, sustaining its position as the leading ingredient category. Growth in this segment has been influenced by the rising parental preference for natural, toxin-free formulations that prioritize infant safety. Industry news and dermatological studies have highlighted the benefits of organic ingredients such as aloe vera, calendula, and coconut oil, which provide soothing and protective effects on sensitive skin.
Consumer confidence in organic skincare has been reinforced by increasing product certifications and transparent labeling standards. Moreover, premium skincare brands have actively expanded their organic product portfolios, targeting health-conscious parents seeking sustainable and safe solutions.
With global awareness around avoiding parabens, phthalates, and artificial fragrances in baby care products, the Organic segment is expected to continue leading the market, supported by regulatory guidance and consumer-driven demand for clean-label skincare.

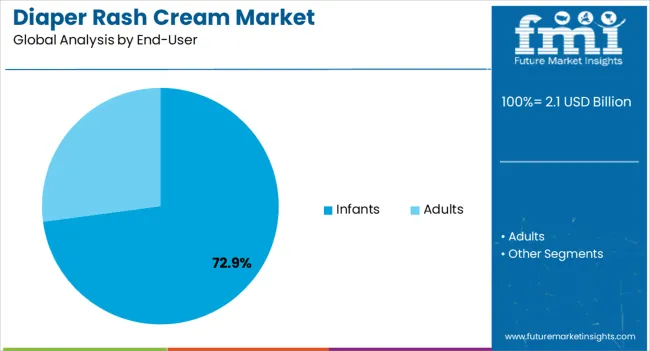
The Infants segment is projected to hold 72.90% of the diaper rash cream market revenue in 2025, making it the most significant end-user category. This dominance has been supported by the high incidence of diaper rash in babies due to prolonged exposure to moisture, friction, and irritants. Pediatric journals have reported that consistent use of rash cream plays a preventive role in maintaining skin barrier function, reinforcing its routine use among parents.
Healthcare providers have increasingly recommended rash creams for daily application, further strengthening the infant-focused demand. Additionally, marketing strategies and brand campaigns have heavily emphasized infant safety and comfort, influencing consumer purchasing behavior.
The availability of infant-specific formulations with added vitamins and skin-calming agents has enhanced adoption across both premium and mass-market segments. As infant population growth continues in emerging economies and parental awareness rises globally, the Infants segment is expected to maintain its leadership in the market.

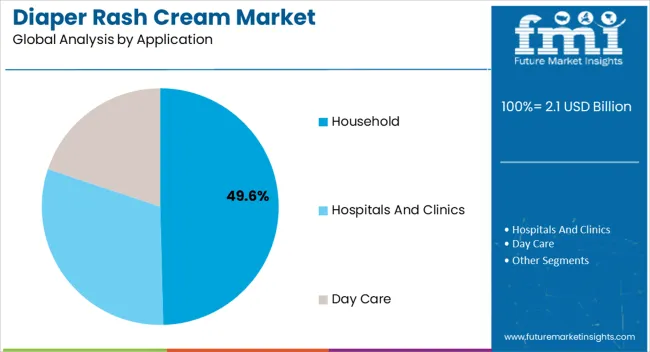
The Household segment is projected to contribute 49.60% of the diaper rash cream market revenue in 2025, retaining its leading position within applications. Growth of this segment has been supported by the increasing reliance on at-home care for managing and preventing diaper rashes, particularly among new parents. Households have favored rash creams for their convenience, affordability, and effectiveness in providing quick relief without requiring medical intervention.
Retail insights have indicated that households represent the largest consumer base due to repeat purchases driven by daily infant care routines. The segment has also been supported by e-commerce platforms that have made household purchase of baby care essentials more accessible, with subscription models ensuring consistent supply.
The growing influence of online reviews, parental communities, and digital parenting forums has further enhanced household adoption. With the continued emphasis on proactive infant skincare and the rising popularity of organic household products, this segment is expected to remain the core driver of market growth.
The global diaper rash cream market witnessed a dynamic transformation from 2020 to 2025, reaching USD 1,811 million. From 2020 to 2025, the market experienced substantial growth fueled by heightened consumer awareness about infant skincare, evolving parenting trends, and a surge in innovative product formulations.
| Attribute | Details |
|---|---|
| Market Value in 2020 | USD 1,400 million |
| Market Value in 2025 | USD 1,811 million |
| Historical CAGR from 2020 to 2025 | 6.6% |
From 2025 to 2035, the market is poised to soar to new heights, guided by innovative advancements and changing consumer preferences. A paradigm shift is anticipated, characterized by cutting-edge developments such as biome-friendly formulations, integration of smart technologies for real-time monitoring, and a profound emphasis on sustainability and eco-consciousness in packaging.
While the 2020 to 2025 phases laid the foundation for heightened demand and product diversification, the 2025 to 2035 period is set to witness an accelerated expansion. This will be driven by a fusion of technology, science, and a deep-seated commitment to infant well-being.
The market is projected to be shaped by a synergy of traditional wisdom and futuristic solutions, creating a harmonious blend that resonates with modern parents seeking effective, sustainable, and personalized diaper rash care for their little ones. As the market journey unfolds, the crescendo of innovation promises to redefine the diaper rash cream landscape, offering a glimpse into a future where every formulation is a testament to optimal infant comfort and care.
The global diaper rash cream market is experiencing an upsurge owing to distinct advantages these products offer in comparison to conventional alternatives. An exceptional attribute of diaper rash creams is their ability to swiftly alleviate discomfort, a feat often elusive even with numerous home remedies.
Organic diaper rash creams and related items are progressively gaining traction due to their perceived safety, fueling their increasing popularity on a global scale. The surging demand for organic and natural personal care items is poised to be advantageous for diaper rash cream manufacturers, potentially leading to substantial revenue growth in the near future.
Diaper rash creams and associated skincare products are classified as non-prescription items, making them readily accessible over the counter (OTC) in a majority of drugstores, pharmacies, hypermarkets, and supermarkets. Diaper rash cream manufacturers are intensifying their research and development endeavors to introduce innovative arrays of products.
This trend is expected to significantly expand the available choices for consumers in the market. Additionally, the enhancement of consumer awareness regarding product ingredients will serve as a pivotal catalyst in propelling the sales of innovative, cleanly labeled diaper rash creams across the global market.
The section on country-wise insights highlights key growth trends shaping sales of diaper rash creams in key geographical locations. It is seen that both the United States and Germany will register identical expansion rates. Other lucrative markets in this section are those of Canada, China and India respectively.
| Country | Forecast CAGR from 2025 to 2035 |
|---|---|
| The United States | 7.5% |
| Canada | 5.9% |
| Germany | 7.5% |
| India | 6.5% |
| China | 6.3% |
In the United States, the diaper rash cream market is undergoing a transformative shift driven by novel factors. Emerging as a pivotal force is the integration of probiotics and microbiome-friendly formulations into these creams, underscoring a cutting-edge approach to infant skincare. This emphasis on nurturing the skin's delicate ecosystem resonates with health-conscious parents seeking natural and effective solutions.
The advent of AI-powered dermatological consultations is revolutionizing the market. Parents can now access personalized advice and recommendations, bolstering confidence in their product choices. This digital innovation bridges the gap between technology and caregiving, shaping a new era of parental guidance.
Sustainability is also casting its influence, with eco-friendly packaging gaining traction. Manufacturers are aligning with environmentally conscious consumers, reshaping the market's ecological footprint. The United States market is poised to incline at a 7.5% CAGR through 2035.
As these prominent drivers unfurl their impact, the United States diaper rash cream market is poised to redefine the realm of infant skincare, embracing science, sustainability, and personalized care in harmonious synergy.
Demand for diaper rash creams in Germany is expected to rise significantly. A CAGR of 7.5% is expected from 2025 to 2035. Emphasis on infant care and availability of various baby care products is expected to fuel market expansion in the coming years.
Nappy rash is a common problem for all infants. To cater to this demographic, key players are offering various rash creams. Bayer AG, a prominent German manufacturer, offers the BepanthenTM formulation cream. They provide gentle care for the nappy or diaper area in babies.
Diaper rash creams in Germany are also gaining traction in the adult segment. Given the longevity and low fertility rates, the elderly population aged 75 and older in Germany has increased dramatically. It increased from 7% of the total population in the last century to over 10% by 2024. Naturally, dermatological problems are also on the incline, providing fertile ground for diaper rash creams for adults.
The China diaper rash cream market is a fertile ground brimming with untapped and novel opportunities. From 2025 to 2035, the market for diaper rash cream in China is likely to rise at a 6.3% CAGR. As the nation's economy continues to flourish, the rising disposable income and heightened awareness of infant skincare have ignited a demand surge. The uncharted territories hold the most promise.
The convergence of e-commerce and digital platforms opens doors for innovative marketing and personalized solutions, tailored to the tech-savvy parents of today. Harnessing traditional Chinese medicine principles to create culturally relevant formulations presents an avenue for differentiation and resonating with local preferences.
The burgeoning trend of eco-consciousness and sustainability provides an opening for brands to establish themselves as pioneers in eco-friendly packaging and ingredients. Capitalizing on these obscure yet burgeoning prospects can propel diaper rash cream brands towards unprecedented success in this vibrant and evolving market.
Within the burgeoning landscape of the Indian diaper rash cream market, a tapestry of obscure and contemporary opportunities is weaving a promising narrative. With a dynamic surge in parental awareness towards infant skincare, the scope for introducing innovative formulations and holistic solutions stands vividly unexplored.
Embracing the vast potential of e-commerce and digital platforms, brands can engage directly with consumers, fostering personalized interactions and garnering invaluable insights. The untapped potential of tier 2 and tier 3 cities unveils a realm of untamed demand, beckoning for tailored marketing strategies that resonate with diverse cultural preferences.
As environmental consciousness gains momentum, the evolution towards sustainable, eco-friendly packaging presents an uncharted avenue for differentiation. By fusing ancient herbal wisdom with modern scientific advancements, a treasure trove of indigenous ingredients awaits exploration.
In this intricate tapestry, the India diaper rash cream market is a canvas where innovation, cultural sensitivity, and ecological mindfulness converge, offering a vista of uncharted opportunities for those poised to pioneer. Future Market Insights expects the market to rise at a 6.5% CAGR through 2035.
The market for diaper rash creams in Canada is slated to rise at a 5.9% CAGR through 2035. Growth is attributed to the expanding immigration wave over the past two decades. This increasing immigration wave has led to an increase in the dependent population pool.
The consequence of this increase is a rise in the number of health issues. Among all health problems, skin conditions are acquiring a significant space. Prominent disorders include atopic dermatitis, contact dermatitis, impetigo, and psoriasis.
Skin rashes caused by allergies and infections are also not uncommon in the Canadian landscape. This rising incidence of skin problems is driving demand for diaper rash creams to a large extent. This is because these creams have anti-inflammatory properties which provide significant relief to patients.
This section highlights key market developments with respect to prominent segments. The segments profiled in this study include ingredient, end-user, application and sales channel respectively.
The organic segment leads the way with respect to ingredients, as people prefer more clean-label and animal-free products. Meanwhile, infants are the target customers with regard to end-users.
| Category | Forecast CAGR from 2025 to 2035 |
|---|---|
| Organic Diaper Rash Creams | 6.4% |
| Diaper Rash Creams for Infants | 6.5% |
Amid the diaper rash cream market, organic ingredients have established dominance. With a surge in eco-conscious preferences, parents gravitate toward nature-inspired formulations. While conventional options persist, the allure of chemical-free, skin-friendly organic ingredients propels them to the forefront.
A harmonious blend of tradition and modernity, organic constituents redefine the diaper rash cream landscape, nurturing infants with a gentle touch and aligning with evolving consumer aspirations. A CAGR of 6.4% is projected for the organic diaper rash cream segment until 2035.
Diaper rash cream sales for infants are likely to rise at a 6.5% CAGR through 2035. The increasing awareness regarding the health and hygiene of babies is propelling demand. Manufacturers are launching new products in line with the government policy guidelines.
In February 2020, Sebapharma GmbH & Co. KG introduced pH 5.5 based baby care products. These include diaper rash creams, marketed by USV Pvt. Ltd. in India. The product is 100% free from all harmful irritants and chemicals and free of animal cruelty.
The diaper rash cream market displays a dynamic competitive landscape marked by interplay of established giants and nimble innovators. Leading brands, armed with decades of trust, wield a substantial market share, leveraging extensive distribution networks and robust R&D capabilities. Agile newcomers disrupt with novel formulations, tapping into the rising demand for natural and sustainable solutions.
Digital platforms empower direct consumer engagement, challenging traditional retail paradigms. As health-conscious parenting trends flourish, pediatrician endorsements and eco-friendly packaging differentiate brands. This intricate rivalry fosters innovation, offering caregivers a diverse spectrum of choices, while continual scientific advancements reshape the contours of skin care for the tiniest of users.
| Report Attribute | Details |
|---|---|
| Market Value in 2025 | USD 2.1 billion |
| Market Value in 2035 | USD 3.6 billion |
| Growth Rate | CAGR of 5.3% from 2025 to 2035 |
| Base Year for Estimation | 2025 |
| Historical Data | 2020 to 2025 |
| Forecast Period | 2025 to 2035 |
| Quantitative Units | Revenue in USD million and CAGR from 2025 to 2035 |
| Report Coverage | Revenue Forecast, Company Ranking, Competitive Landscape, Growth Factors, Trends and Pricing Analysis |
| Segments Covered | Ingredient, End-User, Application, Sales Channel, Region |
| Regions Covered | North America; Latin America; Western Europe; Eastern Europe; South Asia and Pacific; East Asia; Middle East & Africa |
| Key Countries Profiled | United States, Canada, Brazil, Mexico, Germany, United Kingdom, France, Spain, Italy, Poland, Russia, Czech Republic, Romania, India, Bangladesh, Australia, New Zealand, China, Japan, South Korea, GCC Countries, South Africa, Israel |
| Key Companies Profiled | Bayer AG; Unilever; Tubby Todd Inc.; The Himalaya Drug Company; Beiersdorf Inc.; Sebapharma; Babo Botanicals LLC; Johnson & Johnson; The Honest Company Inc.; Summer Laboratories; The Natural Baby Company; Prestige Consumer Healthcare Inc.; Dani Kenny Co.; Earth Mama Organic Company; Weleda Company |
| Customization & Pricing | Available upon Request |
The global diaper rash cream market is estimated to be valued at USD 2.1 billion in 2025.
The market size for the diaper rash cream market is projected to reach USD 3.6 billion by 2035.
The diaper rash cream market is expected to grow at a 5.3% CAGR between 2025 and 2035.
The key product types in diaper rash cream market are organic and conventional.
In terms of end-user, infants segment to command 72.9% share in the diaper rash cream market in 2025.


Full Research Suite comprises of:
Market outlook & trends analysis
Interviews & case studies
Strategic recommendations
Vendor profiles & capabilities analysis
5-year forecasts
8 regions and 60+ country-level data splits
Market segment data splits
12 months of continuous data updates
DELIVERED AS:
PDF EXCEL ONLINE
Diapers Market Analysis - Size, Share & Forecast 2025 to 2035
Diaper Packaging Machines Market Size, Share & Forecast 2025 to 2035
Market Share Breakdown of Diaper Packaging Machines Manufacturers
Diaper Packaging Market Trends & Industry Growth Forecast 2024-2034
Baby Diaper Market Growth, Forecast, and Trend Analysis 2025 to 2035
Leading Providers & Market Share in Baby Diaper Industry
Adult Diapers Market Size and Share Forecast Outlook 2025 to 2035
Smart Diapers Market Size and Share Forecast Outlook 2025 to 2035
Cloth Diaper Market Analysis by Type, Application,Distribution Channel and Region Through 2025 to 2035
France Adult Diaper Market Analysis by Growth, Trends and Forecast from 2025 to 2035
Nonwoven Baby Diaper Market Size and Share Forecast Outlook 2025 to 2035
United States Baby Diaper Market Growth, Trends and Forecast from 2025 to 2035
Biodegradable Baby Diapers Market Analysis – Trends, Growth & Forecast 2025-2035
Trash Rack Cleaning Machine Market Size and Share Forecast Outlook 2025 to 2035
Trash Bag Market Size and Share Forecast Outlook 2025 to 2035
Trash Bag Market Leaders & Competitive Insights
Europe Trash Bag Market Trends & Growth Forecast 2024-2034
Türkiye Trash Bag Market Trends & Growth Forecast 2024-2034
Trash Can Liner Market Growth – Trends & Forecast through 2034
Trash Can Market

Thank you!
You will receive an email from our Business Development Manager. Please be sure to check your SPAM/JUNK folder too.
Chat With
MaRIA