Diesel Power Engine Market Outlook from 2024 to 2034

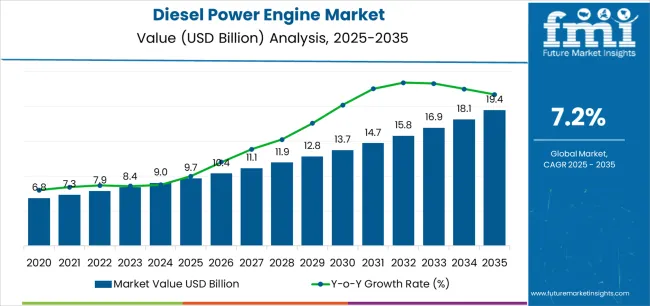
The global diesel power engine market size is estimated to reach a valuation of US$ 9 billion by 2024. It is expected to attain a valuation of around US$ 18.8 billion by 2034. The market is likely to expand at a CAGR of 7.6% in the forecast period 2024 to 2034.

Key Diesel Power Engine Market Trends

  • The ability of diesel engines to offer high fuel efficiency compared to petrol-based engines, especially in construction equipment, buses, and trucks, is set to drive growth.
  • The implementation of stringent norms by governments of several countries is expected to push the demand for diesel propulsion systems as these offer clean technology.
  • Renowned automakers are integrating diesel engines into electric and hybrid powertrains to lower emissions and enhance efficiency in off-road machinery & commercial vehicles.
  • Companies are focusing on research & development activities to discover new alternative fuels such as renewable diesel, synthetic diesel, and biodiesel to reduce the reliance on fossil fuels and lower greenhouse gas emissions.
  • Diesel engine manufacturers are integrating connectivity solutions and digital technologies into these engines to allow for engine optimization, predictive maintenance, and real-time monitoring.
Attributes Key Insights
Diesel Power Engine Market Anticipated Value (2023A) US$ 8.3 billion
Diesel Power Engine Market Estimated Valuation (2024E) US$ 9 billion
Projected Diesel Power Engine Market Size (2034F) US$ 18.8 billion
Value-based Diesel Power Engine Market CAGR (2024 to 2034) 7.6%

Don't pay for what you don't need

Customize your report by selecting specific countries or regions and save 30%!

Significant Drivers of the Diesel Power Engine Market

  • The ongoing expansion of several industries, such as agriculture, construction, and mining, is expected to bolster the demand for diesel-powered machinery owing to their high reliability and torque.
  • The need for diesel engine technology is projected to surge with the growing demand for backup systems and powering generators in remote construction sites, telecommunications towers, and power plants.
  • The marine propulsion industry is set to be one of the key end-users of diesel engines as these can provide robust performance, long range, and high efficiency in maritime transport and commercial shipping applications.
  • The military and defense sector is projected to utilize small diesel engines in aircraft, ships, and vehicles to obtain high durability and fuel efficiency.
  • The use of several diesel engine types is expected to increase in off-grid and remote locations to offer reliable power for rural electrification projects, oil & gas exploration, mining activities, and telecommunications.

2019 to 2023 Diesel Power Engine Market Insights Vs. 2024 to 2034 Forecast

The global diesel power engine market expanded at a CAGR of about 9.2% in the historical period 2019 to 2023. It will likely rise at a CAGR of 7.6% in the assessment period. The market stood at a valuation of US$ 8.3 billion in 2023.

Historical CAGR (2019 to 2023) 9.2%
Forecast CAGR (2024 to 2034) 7.6%

Diesel Engine Market Growth Outlook from 2019 to 2023

  • The ability of diesel engines to provide higher efficiency compared to gasoline engines, especially in industrial machinery, buses, and trucks, expanded their demand to reduce operating costs and fuel consumption.
  • Favorable taxation norms, long driving range, and relatively low cost of ownership pushed the adoption of diesel engine power across Europe and North America.
  • Constant infrastructure development, rapid urbanization, and transportation of consumer goods propelled the compression-ignition engine industry in the past.
  • The demand for diesel engines rose due to the availability of diesel fuel in several regions of the world in abundance. As the availability increased across gas stations, diesel-powered vehicles started gaining traction.
  • Diesel engine consumption across several commercial and industrial applications, including off-road machinery, railway locomotives, maritime propulsion, and power generation, increased from 2019 to 2023.

Diesel Engine Market Size Analysis from 2024 to 2034

  • The demand for diesel engines capable of operating on hydrogen fuel cells or hydrogen-diesel blends is set to expand as the world moves toward a hydrogen economy. These engines are likely to help smoothly operate in the initial stage of hydrogen transition projects.
  • The rapid development of unique biofuels and renewable diesel is expected to create new opportunities for diesel engine suppliers as these can help reduce carbon emissions. The innovative fuels are set to be used in diesel engines with zero to minimal transformations, providing a way to decarbonize the industrial and transportation sectors.
  • Diesel engine-powered generators are likely to play a significant role in rural or remote areas where the availability of electricity grids is limited. These engines are estimated to offer reliable power for microgrid systems and electrification initiatives.
  • Communities, private firms, and government agencies are expected to support diesel power generation projects to provide reliability and resilience during natural disasters like earthquakes or grid outages. Government bodies are projected to invest in diesel-powered emergency response vehicles and backup generators to help with the continuity of essential services.
Nikhil Kaitwade
Nikhil Kaitwade

Principal Consultant

Talk to Analyst

Find your sweet spots for generating winning opportunities in this market.

Semi-annual Diesel Power Engine Market Overview

The table provides information about significant variations in growth rates and dynamic trends in the diesel power engine market. Readers can gain insights into changing consumer tastes and evolving market dynamics throughout an array of different periods.

The table offers an explanation of growth potential, scrutinizing the role that actual numbers and predictions have in determining the future path of the market.

Details CAGR
H1 (2023 to 2033) 8.1%
H2 (2023 to 2033) 7.0%
H1 (2024 to 2034) 8.2%
H2 (2024 to 2034) 6.9%

Comparative View of Adjacent Diesel Power Engine Markets

The global diesel power engine market is set to be impacted by the peer or tangential markets in the automotive division. These include other types of markets, such as the engine flush market and the automotive engine valve market.

Analysis of these related industries can provide deeper insights that would be helpful for developing unique differentiating strategies to pursue growth and opportunity in the market.

The global diesel power engine market is anticipated to witness a CAGR of 7.6% in the evaluation period. This is attributed to the adoption of clean diesel engine features with the implementation of stringent emission norms, including Tier 4 Final standards and Euro VI standards.

The engine flush market is anticipated to showcase a CAGR of 4.4% in the estimated period. This is mainly because of the high demand for vehicle maintenance items, including engine flush, to prevent issues such as performance degradation, engine deposits, and wear & tear.

The automotive engine valve market will likely expand at a CAGR of 2.3% from 2024 to 2034. The market is projected to witness rapid growth amid the rising need to enhance engine response, expand horsepower, and optimize the airflow of vehicles.

Diesel Power Engine Market:

Attributes Diesel Power Engine Industry
CAGR (2024 to 2034) 7.6%
Growth Factor The ongoing expansion of agriculture, mining, and construction industries globally is projected to push the small diesel engine market as these are used in machinery & equipment.
Key Trend Diesel engines are expected to be integrated into electric and hybrid powertrains to lower powertrains and enhance the efficiency of off-road machinery & commercial vehicles.

Engine Flush Market:

Attributes Engine Flush Industry
CAGR (2024 to 2034) 4.4%
Growth Factor The rising focus of fleet operators and vehicle owners on extending the lifespan of engines is expected to propel the demand for engine flush systems to eliminate contaminants, sludge, and deposits.
Key Trend Companies are launching innovative engine flush products that comply with sustainability norms. They are focusing on introducing new formulations that are non-toxic and biodegradable.

Automotive Engine Valve Market:

Attributes Automotive Engine Valve Industry
CAGR (2024 to 2034) 2.3%
Growth Factor Increasing vehicle production, especially in emerging countries owing to surging consumer demand, is projected to drive the demand for automotive engine valves.
Key Trend Key players are set to utilize lightweight materials, including titanium, for the production of innovative engine valves, which are estimated to create new opportunities.

Get the data you need at a Fraction of the cost

Personalize your report by choosing insights you need
and save 40%!

Country-wise Insights

The section below highlights the CAGRs of the leading countries in the diesel power engine market. The three main countries pushing diesel power engine demand include Japan, the United Kingdom, and the United States.

According to the analysis, Japan is set to lead the diesel power engine market by showcasing a CAGR of 9.0% in the forecast period. The country is anticipated to be followed by the United Kingdom and the United States, with CAGRs of 8.5% and 7.9%, respectively.

Countries CAGR (2024 to 2034)
United States 7.9%
United Kingdom 8.5%
China 6.8%
Japan 9.0%
South Korea 5.1%

The table below showcases the size of the top 5 countries present in the global diesel power engine market. Out of all the countries, the United States is expected to reach a valuation of US$ 3.3 billion by 2034. Followed by the United States, China and Japan are anticipated to attain valuations of US$ 2.6 billion and US$ 2.1 billion, respectively.

Countries Market Size (2034)
United States US$ 3.3 billion
United Kingdom US$ 781.7 million
China US$ 2.6 billion
Japan US$ 2.1 billion
South Korea US$ 692.8 million

Constant Diesel Engine Innovations in the United States to Spur Demand

The United States diesel power engine market is projected to attain a valuation of US$ 3.3 billion by 2034. It will likely rise at a CAGR of 7.9% from 2024 to 2034. Factors pushing the diesel engine industry in the country are:

  • The high demand for light-duty diesel vehicles such as pickup trucks and SUVs is estimated to propel the need for diesel power engines that would help provide high fuel efficiency.
  • The ongoing expansion of diesel refueling infrastructures, such as fueling stations and truck stops in the United States, is estimated to push the adoption of diesel-powered equipment and vehicles.
  • Increasing awareness among the general public about innovations in diesel engines, such as improved performance, low noise levels, and clean emissions, is projected to support their demand.
  • The presence of a well-established freight and logistics industry in the United States is expected to bolster demand for diesel engines in delivery and long-haul trucking applications.

Infrastructure Development in China Spurs Demand for Heavy-duty Diesel Engines

It is estimated that China will generate a steady diesel power engine market share in the forecast period. The country is anticipated to expand at a CAGR of 6.8% from 2024 to 2034. Key factors augmenting the market include:
  • China is witnessing several infrastructure development projects, such as the construction of ports, railways, and highways, which is expected to bolster the demand for industrial diesel engines.
  • The mechanization and modernization of the agriculture sector in China is projected to push the requirement for diesel-powered machinery, including irrigation pumps, harvesters, and tractors.
  • The demand for diesel power engines is anticipated to rise in China on the back of the constant export of diesel-based machinery and engines.

Japan Sees Diesel Engine Applications in Marine and Forestry Industries

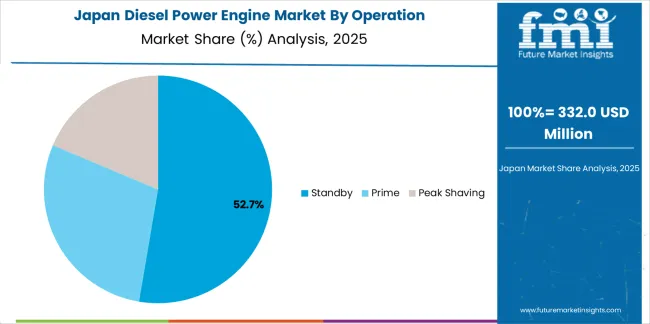
Japan’s diesel power engine market is anticipated to witness a CAGR of 9.0% through 2034. The country is likely to expand considerably due to the following factors:

  • Japan-based diesel engine manufacturers are set to invest huge sums in the development of hybrid diesel technology to obtain environmental benefits and fuel efficiency. They are aiming to attract companies looking for clean fuels for transportation applications.
  • The marine diesel engine market in Japan is constantly flourishing as the marine industry relies on diesel engines for marine generators, auxiliary power, and ship propulsion.
  • The forestry, agriculture, and construction industries in Japan are looking for diesel-powered equipment for applications like harvesters, tractors, and excavators.

Category-wise Insights

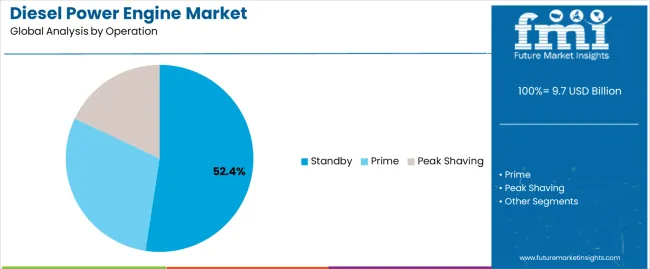
The below section shows the global trends in the diesel power engine industry in terms of operation and rated power. The standby segment is expected to lead the diesel power engine market based on operation.

It is set to showcase a CAGR of around 7.4% from 2024 to 2034. Based on the rated power, the up to 0.5 MW segment is anticipated to exhibit a dominant CAGR of 7.1% through 2034.

Segment Value CAGR (2024 to 2034)
Standby (Operation) 7.4%
Up to 0.5 MW (Rated Power) 7.1%

Diesel Engine Power for Standby Operations to Witness High Growth

In terms of operation, the standby segment is projected to witness a CAGR of 7.4% from 2024 to 2034. The segment is likely to surge rapidly owing to the following factors:

  • The demand for diesel engines for standby operations is increasing, especially in crucial applications such as emergency power backup systems. The unavailability or unreliability of grid power is set to create a high need for diesel generators to offer backup power.
  • The ongoing expansion of IT infrastructure and data centers is projected to create a surging demand for diesel-powered generators to prevent data loss and downtime.

Diesel Engine Technology Rated Up to 0.5 MW Gains Impetus Worldwide

Based on rated power, the up to 0.5 MW category is estimated to exhibit a CAGR of around 7.1% through 2034. This growth is attributed to the following factors:
  • The rising demand for distributed power generation solutions in remote areas is projected to drive the need for engines rated up to 0.5 MW. These are set to help provide a versatile and compact solution for telecommunications towers, small communities, off-grid installations, and industrial hubs.
  • The high demand for certain power requirements is set to make diesel engines rated up to 0.5 MW ideal for a wide range of applications, such as continuous and standby operations.

Competitive Landscape

The global diesel power engine market is highly fragmented, with the presence of several key companies. They are mainly focusing on joining hands with renowned automakers to provide their in-house heavy-duty diesel engines.

Several automotive manufacturers worldwide are striving to increase sales of their diesel-powered vehicles to gain a competitive edge. They are constantly updating their old car models to include diesel engines and new features.

For instance:

  • In January 2024, Tata Motors introduced its new Turbotronn 2.0 engine. The novel engine promises to offer high reliability and efficiency in the truck industry. It was manufactured for trucks between 19 and 42 tons. The engine is ideal for several trucking applications, including long-haul and inter-city transport.
  • In January 2024, Tata Motors announced that it is planning to launch the diesel variant of Tata Curvv along with petrol-powered and all-electric versions. The company is aiming to push the adoption of diesel powertrains as the demand for diesel-powered SUVs is declining in India.
  • In January 2024, Jaguar Land Rover introduced its new model of Range Rover Evoque in both diesel and petrol engine options. The updated model has several features, such as fog lights, air purifiers, wireless charging, and more. The vehicle also has a 48V mild-hybrid system that helps save energy amid braking.

Key Companies Profiled in the Diesel Power Engine Market Report

  • Caterpillar Inc.
  • Cummins, Inc.
  • MAN SE
  • Rolls-Royce Holdings plc.
  • Wärtsilä Corp.
  • Mitsubishi Heavy Industries, Ltd.
  • Volvo Penta
  • Hyundai Heavy Industries Co., Ltd.
  • Doosan

Diesel Power Engine Market Outlook by Category

By Operation:

  • Standby
  • Prime
  • Peak Shaving

By Rated Power:

  • Up to 0.5 MW
  • 0.5 to 1 MW
  • 1 to 2 MW
  • 2 to 5 MW
  • Above 5 MW

By End-user:

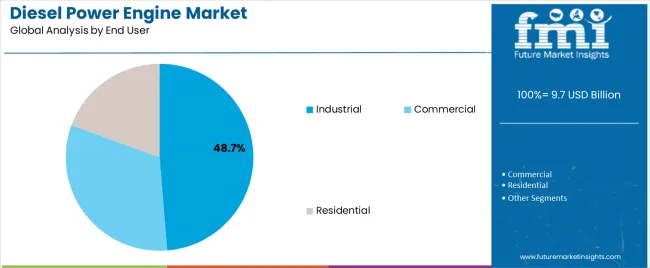
  • Industrial
  • Commercial
  • Residential

By Region:

  • North America
  • Latin America
  • Europe
  • East Asia
  • South Asia
  • Oceania
  • Middle East and Africa

Frequently Asked Questions

How big is the diesel engine market?

The diesel power engine market is set to reach US$ 18.8 billion by 2034.

Who is the leading manufacturer of diesel engines?

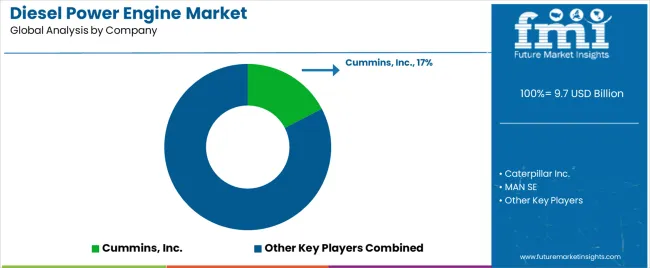
Caterpillar Inc. and Cummins, Inc. are the leading manufacturers.

Is there a future for diesel engines?

The popularity of diesel engines is rising owing to their ability to offer high fuel economy.

How big is the diesel fuel engine market?

The diesel power engine market is expected to reach US$ 9 billion in 2024.

At what CAGR would the diesel power engine market expand?

The diesel power engine market is set to expand at a CAGR of 7.6% through 2034.

Which is the leading operation segment in the diesel power engine market?

The standby segment is expected to lead the diesel power engine market.

Table of Content
1. Executive Summary

    1.1. Global Market Outlook

    1.2. Demand-side Trends

    1.3. Supply-side Trends

    1.4. Technology Roadmap Analysis

    1.5. Analysis and Recommendations

2. Market Overview

    2.1. Market Coverage / Taxonomy

    2.2. Market Definition / Scope / Limitations

3. Market Background

    3.1. Market Dynamics

        3.1.1. Drivers

        3.1.2. Restraints

        3.1.3. Opportunity

        3.1.4. Trends

    3.2. Scenario Forecast

        3.2.1. Demand in Optimistic Scenario

        3.2.2. Demand in Likely Scenario

        3.2.3. Demand in Conservative Scenario

    3.3. Opportunity Map Analysis

    3.4. Product Life Cycle Analysis

    3.5. Supply Chain Analysis

        3.5.1. Supply Side Participants and their Roles

            3.5.1.1. Producers

            3.5.1.2. Mid-Level Participants (Traders/ Agents/ Brokers)

            3.5.1.3. Wholesalers and Distributors

        3.5.2. Value Added and Value Created at Node in the Supply Chain

        3.5.3. List of Raw Material Suppliers

        3.5.4. List of Existing and Potential Buyer’s

    3.6. Investment Feasibility Matrix

    3.7. Value Chain Analysis

        3.7.1. Profit Margin Analysis

        3.7.2. Wholesalers and Distributors

        3.7.3. Retailers

    3.8. PESTLE and Porter’s Analysis

    3.9. Regulatory Landscape

        3.9.1. By Key Regions

        3.9.2. By Key Countries

    3.10. Regional Parent Market Outlook

    3.11. Production and Consumption Statistics

    3.12. Import and Export Statistics

4. Global Market Analysis 2019 to 2023 and Forecast, 2024 to 2034

    4.1. Historical Market Size Value (US$ billion) & Volume (Units) Analysis, 2019 to 2023

    4.2. Current and Future Market Size Value (US$ billion) & Volume (Units) Projections, 2024 to 2034

        4.2.1. Y-o-Y Growth Trend Analysis

        4.2.2. Absolute $ Opportunity Analysis

5. Global Market Analysis 2019 to 2023 and Forecast 2024 to 2034, By Operation

    5.1. Introduction / Key Findings

    5.2. Historical Market Size Value (US$ billion) & Volume (Units) Analysis By Operation, 2019 to 2023

    5.3. Current and Future Market Size Value (US$ billion) & Volume (Units) Analysis and Forecast By Operation, 2024 to 2034

        5.3.1. Standby

        5.3.2. Prime

        5.3.3. Peak Shaving

    5.4. Y-o-Y Growth Trend Analysis By Operation, 2019 to 2023

    5.5. Absolute $ Opportunity Analysis By Operation, 2024 to 2034

6. Global Market Analysis 2019 to 2023 and Forecast 2024 to 2034, By Rated Power

    6.1. Introduction / Key Findings

    6.2. Historical Market Size Value (US$ billion) & Volume (Units) Analysis By Rated Power, 2019 to 2023

    6.3. Current and Future Market Size Value (US$ billion) & Volume (Units) Analysis and Forecast By Rated Power, 2024 to 2034

        6.3.1. Up to 0.5 MW

        6.3.2. 0.5 to 1 MW

        6.3.3. 1 to 2 MW

        6.3.4. 2 to 5 MW

        6.3.5. Above 5 MW

    6.4. Y-o-Y Growth Trend Analysis By Rated Power, 2019 to 2023

    6.5. Absolute $ Opportunity Analysis By Rated Power, 2024 to 2034

7. Global Market Analysis 2019 to 2023 and Forecast 2024 to 2034, By End-user

    7.1. Introduction / Key Findings

    7.2. Historical Market Size Value (US$ billion) & Volume (Units) Analysis By End-user, 2019 to 2023

    7.3. Current and Future Market Size Value (US$ billion) & Volume (Units) Analysis and Forecast By End-user, 2024 to 2034

        7.3.1. Industrial

        7.3.2. Commercial

        7.3.3. Residential

    7.4. Y-o-Y Growth Trend Analysis By End-user, 2019 to 2023

    7.5. Absolute $ Opportunity Analysis By End-user, 2024 to 2034

8. Global Market Analysis 2019 to 2023 and Forecast 2024 to 2034, By Region

    8.1. Introduction

    8.2. Historical Market Size Value (US$ billion) & Volume (Units) Analysis By Region, 2019 to 2023

    8.3. Current Market Size Value (US$ billion) & Volume (Units) Analysis and Forecast By Region, 2024 to 2034

        8.3.1. North America

        8.3.2. Latin America

        8.3.3. Western Europe

        8.3.4. Eastern Europe

        8.3.5. South Asia and Pacific

        8.3.6. East Asia

        8.3.7. Middle East and Africa

    8.4. Market Attractiveness Analysis By Region

9. North America Market Analysis 2019 to 2023 and Forecast 2024 to 2034, By Country

    9.1. Historical Market Size Value (US$ billion) & Volume (Units) Trend Analysis By Market Taxonomy, 2019 to 2023

    9.2. Market Size Value (US$ billion) & Volume (Units) Forecast By Market Taxonomy, 2024 to 2034

        9.2.1. By Country

            9.2.1.1. United States

            9.2.1.2. Canada

        9.2.2. By Operation

        9.2.3. By Rated Power

        9.2.4. By End-user

    9.3. Market Attractiveness Analysis

        9.3.1. By Country

        9.3.2. By Operation

        9.3.3. By Rated Power

        9.3.4. By End-user

    9.4. Key Takeaways

10. Latin America Market Analysis 2019 to 2023 and Forecast 2024 to 2034, By Country

    10.1. Historical Market Size Value (US$ billion) & Volume (Units) Trend Analysis By Market Taxonomy, 2019 to 2023

    10.2. Market Size Value (US$ billion) & Volume (Units) Forecast By Market Taxonomy, 2024 to 2034

        10.2.1. By Country

            10.2.1.1. Brazil

            10.2.1.2. Mexico

            10.2.1.3. Rest of Latin America

        10.2.2. By Operation

        10.2.3. By Rated Power

        10.2.4. By End-user

    10.3. Market Attractiveness Analysis

        10.3.1. By Country

        10.3.2. By Operation

        10.3.3. By Rated Power

        10.3.4. By End-user

    10.4. Key Takeaways

11. Western Europe Market Analysis 2019 to 2023 and Forecast 2024 to 2034, By Country

    11.1. Historical Market Size Value (US$ billion) & Volume (Units) Trend Analysis By Market Taxonomy, 2019 to 2023

    11.2. Market Size Value (US$ billion) & Volume (Units) Forecast By Market Taxonomy, 2024 to 2034

        11.2.1. By Country

            11.2.1.1. Germany

            11.2.1.2. United Kingdom

            11.2.1.3. France

            11.2.1.4. Spain

            11.2.1.5. Italy

            11.2.1.6. Rest of Western Europe

        11.2.2. By Operation

        11.2.3. By Rated Power

        11.2.4. By End-user

    11.3. Market Attractiveness Analysis

        11.3.1. By Country

        11.3.2. By Operation

        11.3.3. By Rated Power

        11.3.4. By End-user

    11.4. Key Takeaways

12. Eastern Europe Market Analysis 2019 to 2023 and Forecast 2024 to 2034, By Country

    12.1. Historical Market Size Value (US$ billion) & Volume (Units) Trend Analysis By Market Taxonomy, 2019 to 2023

    12.2. Market Size Value (US$ billion) & Volume (Units) Forecast By Market Taxonomy, 2024 to 2034

        12.2.1. By Country

            12.2.1.1. Poland

            12.2.1.2. Russia

            12.2.1.3. Czech Republic

            12.2.1.4. Romania

            12.2.1.5. Rest of Eastern Europe

        12.2.2. By Operation

        12.2.3. By Rated Power

        12.2.4. By End-user

    12.3. Market Attractiveness Analysis

        12.3.1. By Country

        12.3.2. By Operation

        12.3.3. By Rated Power

        12.3.4. By End-user

    12.4. Key Takeaways

13. South Asia and Pacific Market Analysis 2019 to 2023 and Forecast 2024 to 2034, By Country

    13.1. Historical Market Size Value (US$ billion) & Volume (Units) Trend Analysis By Market Taxonomy, 2019 to 2023

    13.2. Market Size Value (US$ billion) & Volume (Units) Forecast By Market Taxonomy, 2024 to 2034

        13.2.1. By Country

            13.2.1.1. India

            13.2.1.2. Bangladesh

            13.2.1.3. Australia

            13.2.1.4. New Zealand

            13.2.1.5. Rest of South Asia and Pacific

        13.2.2. By Operation

        13.2.3. By Rated Power

        13.2.4. By End-user

    13.3. Market Attractiveness Analysis

        13.3.1. By Country

        13.3.2. By Operation

        13.3.3. By Rated Power

        13.3.4. By End-user

    13.4. Key Takeaways

14. East Asia Market Analysis 2019 to 2023 and Forecast 2024 to 2034, By Country

    14.1. Historical Market Size Value (US$ billion) & Volume (Units) Trend Analysis By Market Taxonomy, 2019 to 2023

    14.2. Market Size Value (US$ billion) & Volume (Units) Forecast By Market Taxonomy, 2024 to 2034

        14.2.1. By Country

            14.2.1.1. China

            14.2.1.2. Japan

            14.2.1.3. South Korea

        14.2.2. By Operation

        14.2.3. By Rated Power

        14.2.4. By End-user

    14.3. Market Attractiveness Analysis

        14.3.1. By Country

        14.3.2. By Operation

        14.3.3. By Rated Power

        14.3.4. By End-user

    14.4. Key Takeaways

15. Middle East and Africa Market Analysis 2019 to 2023 and Forecast 2024 to 2034, By Country

    15.1. Historical Market Size Value (US$ billion) & Volume (Units) Trend Analysis By Market Taxonomy, 2019 to 2023

    15.2. Market Size Value (US$ billion) & Volume (Units) Forecast By Market Taxonomy, 2024 to 2034

        15.2.1. By Country

            15.2.1.1. GCC Countries

            15.2.1.2. South Africa

            15.2.1.3. Israel

            15.2.1.4. Rest of Middle East and Africa

        15.2.2. By Operation

        15.2.3. By Rated Power

        15.2.4. By End-user

    15.3. Market Attractiveness Analysis

        15.3.1. By Country

        15.3.2. By Operation

        15.3.3. By Rated Power

        15.3.4. By End-user

    15.4. Key Takeaways

16. Key Countries Market Analysis

    16.1. United States

        16.1.1. Pricing Analysis

        16.1.2. Market Share Analysis, 2023

            16.1.2.1. By Operation

            16.1.2.2. By Rated Power

            16.1.2.3. By End-user

    16.2. Canada

        16.2.1. Pricing Analysis

        16.2.2. Market Share Analysis, 2023

            16.2.2.1. By Operation

            16.2.2.2. By Rated Power

            16.2.2.3. By End-user

    16.3. Brazil

        16.3.1. Pricing Analysis

        16.3.2. Market Share Analysis, 2023

            16.3.2.1. By Operation

            16.3.2.2. By Rated Power

            16.3.2.3. By End-user

    16.4. Mexico

        16.4.1. Pricing Analysis

        16.4.2. Market Share Analysis, 2023

            16.4.2.1. By Operation

            16.4.2.2. By Rated Power

            16.4.2.3. By End-user

    16.5. Germany

        16.5.1. Pricing Analysis

        16.5.2. Market Share Analysis, 2023

            16.5.2.1. By Operation

            16.5.2.2. By Rated Power

            16.5.2.3. By End-user

    16.6. United Kingdom

        16.6.1. Pricing Analysis

        16.6.2. Market Share Analysis, 2023

            16.6.2.1. By Operation

            16.6.2.2. By Rated Power

            16.6.2.3. By End-user

    16.7. France

        16.7.1. Pricing Analysis

        16.7.2. Market Share Analysis, 2023

            16.7.2.1. By Operation

            16.7.2.2. By Rated Power

            16.7.2.3. By End-user

    16.8. Spain

        16.8.1. Pricing Analysis

        16.8.2. Market Share Analysis, 2023

            16.8.2.1. By Operation

            16.8.2.2. By Rated Power

            16.8.2.3. By End-user

    16.9. Italy

        16.9.1. Pricing Analysis

        16.9.2. Market Share Analysis, 2023

            16.9.2.1. By Operation

            16.9.2.2. By Rated Power

            16.9.2.3. By End-user

    16.10. Poland

        16.10.1. Pricing Analysis

        16.10.2. Market Share Analysis, 2023

            16.10.2.1. By Operation

            16.10.2.2. By Rated Power

            16.10.2.3. By End-user

    16.11. Russia

        16.11.1. Pricing Analysis

        16.11.2. Market Share Analysis, 2023

            16.11.2.1. By Operation

            16.11.2.2. By Rated Power

            16.11.2.3. By End-user

    16.12. Czech Republic

        16.12.1. Pricing Analysis

        16.12.2. Market Share Analysis, 2023

            16.12.2.1. By Operation

            16.12.2.2. By Rated Power

            16.12.2.3. By End-user

    16.13. Romania

        16.13.1. Pricing Analysis

        16.13.2. Market Share Analysis, 2023

            16.13.2.1. By Operation

            16.13.2.2. By Rated Power

            16.13.2.3. By End-user

    16.14. India

        16.14.1. Pricing Analysis

        16.14.2. Market Share Analysis, 2023

            16.14.2.1. By Operation

            16.14.2.2. By Rated Power

            16.14.2.3. By End-user

    16.15. Bangladesh

        16.15.1. Pricing Analysis

        16.15.2. Market Share Analysis, 2023

            16.15.2.1. By Operation

            16.15.2.2. By Rated Power

            16.15.2.3. By End-user

    16.16. Australia

        16.16.1. Pricing Analysis

        16.16.2. Market Share Analysis, 2023

            16.16.2.1. By Operation

            16.16.2.2. By Rated Power

            16.16.2.3. By End-user

    16.17. New Zealand

        16.17.1. Pricing Analysis

        16.17.2. Market Share Analysis, 2023

            16.17.2.1. By Operation

            16.17.2.2. By Rated Power

            16.17.2.3. By End-user

    16.18. China

        16.18.1. Pricing Analysis

        16.18.2. Market Share Analysis, 2023

            16.18.2.1. By Operation

            16.18.2.2. By Rated Power

            16.18.2.3. By End-user

    16.19. Japan

        16.19.1. Pricing Analysis

        16.19.2. Market Share Analysis, 2023

            16.19.2.1. By Operation

            16.19.2.2. By Rated Power

            16.19.2.3. By End-user

    16.20. South Korea

        16.20.1. Pricing Analysis

        16.20.2. Market Share Analysis, 2023

            16.20.2.1. By Operation

            16.20.2.2. By Rated Power

            16.20.2.3. By End-user

    16.21. GCC Countries

        16.21.1. Pricing Analysis

        16.21.2. Market Share Analysis, 2023

            16.21.2.1. By Operation

            16.21.2.2. By Rated Power

            16.21.2.3. By End-user

    16.22. South Africa

        16.22.1. Pricing Analysis

        16.22.2. Market Share Analysis, 2023

            16.22.2.1. By Operation

            16.22.2.2. By Rated Power

            16.22.2.3. By End-user

    16.23. Israel

        16.23.1. Pricing Analysis

        16.23.2. Market Share Analysis, 2023

            16.23.2.1. By Operation

            16.23.2.2. By Rated Power

            16.23.2.3. By End-user

17. Market Structure Analysis

    17.1. Competition Dashboard

    17.2. Competition Benchmarking

    17.3. Market Share Analysis of Top Players

        17.3.1. By Regional

        17.3.2. By Operation

        17.3.3. By Rated Power

        17.3.4. By End-user

18. Competition Analysis

    18.1. Competition Deep Dive

        18.1.1. Caterpillar Inc.

            18.1.1.1. Overview

            18.1.1.2. Product Portfolio

            18.1.1.3. Profitability by Market Segments

            18.1.1.4. Sales Footprint

            18.1.1.5. Strategy Overview

                18.1.1.5.1. Marketing Strategy

                18.1.1.5.2. Product Strategy

                18.1.1.5.3. Channel Strategy

        18.1.2. Cummins, Inc.

            18.1.2.1. Overview

            18.1.2.2. Product Portfolio

            18.1.2.3. Profitability by Market Segments

            18.1.2.4. Sales Footprint

            18.1.2.5. Strategy Overview

                18.1.2.5.1. Marketing Strategy

                18.1.2.5.2. Product Strategy

                18.1.2.5.3. Channel Strategy

        18.1.3. MAN SE

            18.1.3.1. Overview

            18.1.3.2. Product Portfolio

            18.1.3.3. Profitability by Market Segments

            18.1.3.4. Sales Footprint

            18.1.3.5. Strategy Overview

                18.1.3.5.1. Marketing Strategy

                18.1.3.5.2. Product Strategy

                18.1.3.5.3. Channel Strategy

        18.1.4. Rolls-Royce Holdings plc.

            18.1.4.1. Overview

            18.1.4.2. Product Portfolio

            18.1.4.3. Profitability by Market Segments

            18.1.4.4. Sales Footprint

            18.1.4.5. Strategy Overview

                18.1.4.5.1. Marketing Strategy

                18.1.4.5.2. Product Strategy

                18.1.4.5.3. Channel Strategy

        18.1.5. Wärtsilä Corp

            18.1.5.1. Overview

            18.1.5.2. Product Portfolio

            18.1.5.3. Profitability by Market Segments

            18.1.5.4. Sales Footprint

            18.1.5.5. Strategy Overview

                18.1.5.5.1. Marketing Strategy

                18.1.5.5.2. Product Strategy

                18.1.5.5.3. Channel Strategy

        18.1.6. Mitsubishi Heavy Industries, Ltd.

            18.1.6.1. Overview

            18.1.6.2. Product Portfolio

            18.1.6.3. Profitability by Market Segments

            18.1.6.4. Sales Footprint

            18.1.6.5. Strategy Overview

                18.1.6.5.1. Marketing Strategy

                18.1.6.5.2. Product Strategy

                18.1.6.5.3. Channel Strategy

        18.1.7. Volvo Penta

            18.1.7.1. Overview

            18.1.7.2. Product Portfolio

            18.1.7.3. Profitability by Market Segments

            18.1.7.4. Sales Footprint

            18.1.7.5. Strategy Overview

                18.1.7.5.1. Marketing Strategy

                18.1.7.5.2. Product Strategy

                18.1.7.5.3. Channel Strategy

        18.1.8. Hyundai Heavy Industries Co., Ltd.

            18.1.8.1. Overview

            18.1.8.2. Product Portfolio

            18.1.8.3. Profitability by Market Segments

            18.1.8.4. Sales Footprint

            18.1.8.5. Strategy Overview

                18.1.8.5.1. Marketing Strategy

                18.1.8.5.2. Product Strategy

                18.1.8.5.3. Channel Strategy

        18.1.9. Doosan

            18.1.9.1. Overview

            18.1.9.2. Product Portfolio

            18.1.9.3. Profitability by Market Segments

            18.1.9.4. Sales Footprint

            18.1.9.5. Strategy Overview

                18.1.9.5.1. Marketing Strategy

                18.1.9.5.2. Product Strategy

                18.1.9.5.3. Channel Strategy

        18.1.10. Yanmar Co., Ltd.

            18.1.10.1. Overview

            18.1.10.2. Product Portfolio

            18.1.10.3. Profitability by Market Segments

            18.1.10.4. Sales Footprint

            18.1.10.5. Strategy Overview

                18.1.10.5.1. Marketing Strategy

                18.1.10.5.2. Product Strategy

                18.1.10.5.3. Channel Strategy

        18.1.11. Kubota Corporation

            18.1.11.1. Overview

            18.1.11.2. Product Portfolio

            18.1.11.3. Profitability by Market Segments

            18.1.11.4. Sales Footprint

            18.1.11.5. Strategy Overview

                18.1.11.5.1. Marketing Strategy

                18.1.11.5.2. Product Strategy

                18.1.11.5.3. Channel Strategy

        18.1.12. Kohler Co among others

            18.1.12.1. Overview

            18.1.12.2. Product Portfolio

            18.1.12.3. Profitability by Market Segments

            18.1.12.4. Sales Footprint

            18.1.12.5. Strategy Overview

                18.1.12.5.1. Marketing Strategy

                18.1.12.5.2. Product Strategy

                18.1.12.5.3. Channel Strategy

19. Assumptions & Acronyms Used

20. Research Methodology
Recommendations

Automotive

Engine Flush Market

February 2018

REP-GB-6153

June 2023

306 pages

Automotive

Engine Tuner Market

September 2024

REP-GB-14124

Upcoming

Explore Automotive Insights

View Reports
Future Market Insights

Diesel Power Engine Market