Electrochemistry Meters Market Snapshot (2022-2032)

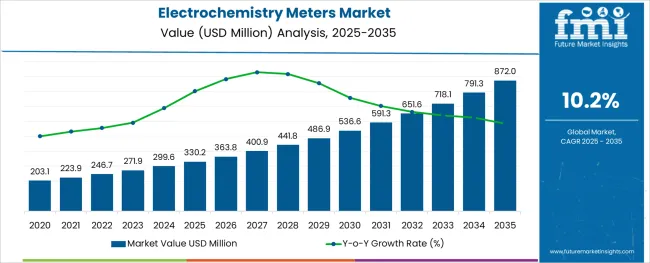
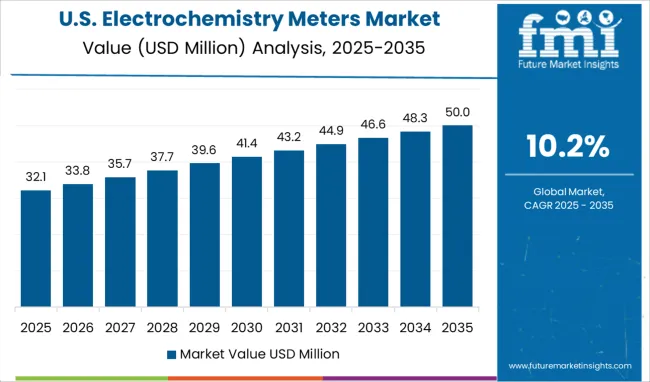
[250+ Pages Report] The global electrochemistry meters market size is expected to reach US$ 246.7 Million in 2022 and exhibit growth at a CAGR of 10.2% in the forecast period (2022-2032). Increasing investments by key players in research and development activities to come up with novel pharmaceutical and biotechnological solutions are likely to augment sales of electrochemistry meters in future.

As per FMI, the global electrochemistry meters’ market is set to be valued at US$ 691.3 Million in 2032. Surging demand for multiparameter test instruments and urgent need for high productivity in laboratories are estimated to spur growth in the global market.

Report Attribute Details
Electrochemistry Meters Market Estimated Base Year Value (2021) US$ 237.1 Million
Electrochemistry Meters Market Expected Market Value (2022) US$ 246.7 Million
Electrochemistry Meters Market Anticipated Forecast Value (2032) US$ 691.3 Million
Electrochemistry Meters Market Projected Growth Rate (2022 to 2032) 10.2% CAGR

Electrochemistry meters include portable or benchtop instruments, as well as electrodes that are used to measure various parameters in solutions and water. These are mainly utilized to measure ion-specific testing, temperature, ORP, pH, dissolved oxygen/BOD, resistivity, and conductivity.

Ongoing developments in the field of electrochemistry owing to surging government investments in research activities worldwide are expected to bolster the demand for electrochemistry meters in the upcoming years.

Increasing number of academic institutions in both developed and developing countries is another vital factor that is likely to propel growth. Surging awareness among people regarding safe water consumption, especially in emerging economies is also projected to aid growth.

Besides, global alliances among reputed research institutes to accelerate novel drug discovery are anticipated to open new growth opportunities for key players in the market. Increasing usage of electrochemistry meters to monitor numerous crucial processes in environmental testing, academic institutions, and agricultural sectors is another factor that would push sales.

Don't pay for what you don't need

Customize your report by selecting specific countries or regions and save 30%!

Increasing Concerns for Chemical Contamination of Water to Boost Electrochemistry Meters Market

The emergence of portable electrochemistry meters that are capable of lowering the equipment amount by showcasing multiple parameters in an individual display unit is set to boost growth. Portable meters can save the time required to transfer electrodes from one meter to another. Industrial fields, such as scientific research, water quality checking, biological agriculture, environmental protection, and disease control are expected to witness high demand for the measurement of numerous parameters.

Increasing occurrence of chemical contamination of water with the inclusion of nitrogen, salts, pesticides, and metals is anticipated to foster the electrochemistry meters market growth in the evaluation period. Increasing need for safe water production among several water treatment companies for providing clean drinking water to the populace globally is another crucial factor that is expected to fuel growth.

What are the Factors Hampering the Global Electrochemistry Meters Market Demand?

Declining average selling prices of electrochemistry meters may hamper the market in future years. In addition to that, commoditization of electrochemistry instruments is projected to obstruct their sales in the forecast period.

However, increasing deployment of complex and new projects on the water industry and power plants is expected to necessitate the requirement of continuous monitoring of plants. It is further set to open doors to new growth opportunities for key players and propel sales of electrochemistry meters.
Nikhil Kaitwade
Nikhil Kaitwade

Principal Consultant

Talk to Analyst

Find your sweet spots for generating winning opportunities in this market.

How is Demand for pH Meters Pushing Electrochemistry Meters Demand in North America?

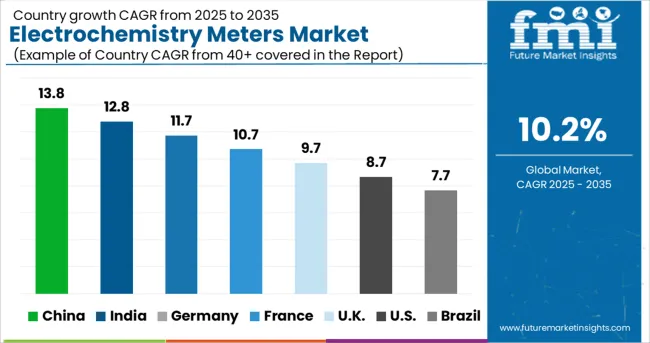
In terms of region, North America is anticipated to generate the largest electrochemistry meters market share in the forthcoming decade. Development in pharmaceutical and biotechnology industries, especially in the U.S. and Canada is expected to bolster the growth.

Increasing government support in terms of funding to trigger research work is another significant factor that would contribute to the market growth. Further, surging adoption of pH meters owing to increasing water pollution is likely to fuel growth.

Rapid industrialization and urbanization are leading to the excessive release of wastewater into water bodies by various factories, which would push growth. Increasing prevalence of diseases associated with the consumption of contaminated water is thus compelling key players to develop new pH meters across North America.
Will Increasing Prevalence of Waterborne Diseases in India Boost Asia Pacific Electrochemistry Meters Market?

Increasing cases of water-borne diseases in developing countries, such as India and China are likely to propel the demand for electrochemistry meters across Asia Pacific. As per the India Water Portal, approximately 37.7 million people living in the country are affected by water-borne diseases every year.

Also, nearly 1.5 million children die because of diarrhea and about 73 million working days are lost due to the disease. These numbers are projected to increase in future years, thereby propelling the Asia Pacific market.

Moreover, contamination of rural piped supplies and groundwater backed by improper sanitation and hygiene is projected to drive the regional market. Fecal contamination is the most prevalent in low- and middle-income countries across Asia Pacific. Thus, key manufacturers are striving to introduce state-of-the-art pH meters to prevent waterborne diseases, which would aid growth.
Get the data you need at a Fraction of the cost

Personalize your report by choosing insights you need
and save 40%!

Market Competition

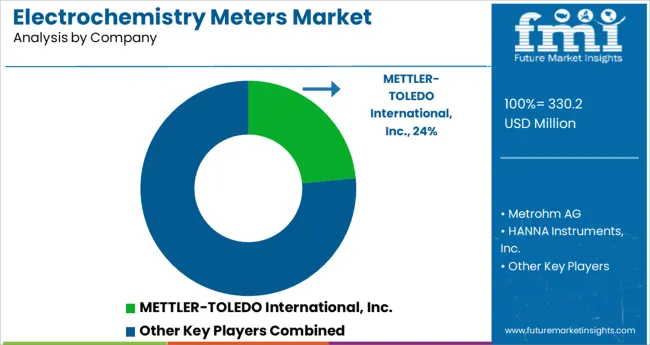
Some of the leading players operating in the global electrochemistry meters market include METTLER-TOLEDO International, Inc., Metrohm AG, Yokogawa Electric Corporation, Xylem Inc., Thermo Fisher Scientific, Inc., HANNA Instruments, Inc., Horiba Ltd., Danaher Corporation, DKK TOA Corporation, and Endress+Hauser AG among others.

Leading companies in the market are increasingly focusing on developing cutting-edge products to attract more customers and gain a competitive edge. They are also engaging in collaborations and partnerships with local firms to co-develop novel products and expand their geographic presence. A few other start-up companies are aiming to improve their portfolios by signing agreements with international players.

Report Scope

Report Attribute Details
Growth Rate CAGR of 10.2% from 2022 to 2032
Base Year for Estimation 2021
Historical Data 2015 to 2020
Forecast Period 2022 to 2032
Quantitative Units Revenue in USD Million and CAGR from 2022 to 2032
Report Coverage Revenue Forecast, Volume Forecast, Company Ranking, Competitive Landscape, Growth Factors, Trends and Pricing Analysis
Segments Covered
  • Product Type
  • Technology Type
  • End-use Industry
  • Region
Regions Covered
  • North America
  • Latin America
  • Western Europe
  • Eastern Europe
  • APEJ
  • Japan
  • Middle East and Africa
Key Countries Profiled
  • USA
  • Canada
  • Brazil
  • Argentina
  • Germany
  • UK
  • France
  • Spain
  • Italy
  • Nordics
  • BENELUX
  • Australia & New Zealand
  • China
  • India
  • ASEAN
  • GCC
  • South Africa
Key Companies Profiled
Customization Available Upon Request

Key Segments Profiled in the Electrochemistry Meters Industry Survey

By Product Type:

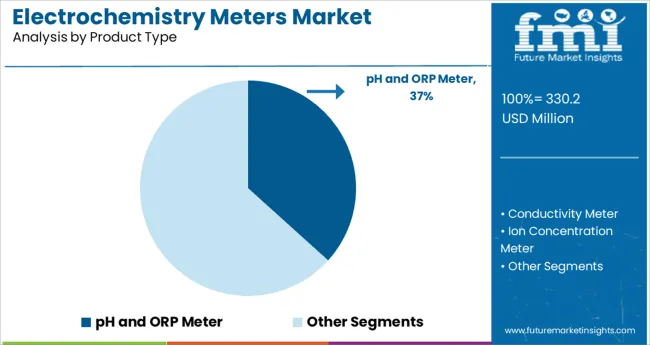
  • pH and ORP Meter
  • Conductivity Meter
  • Ion Concentration Meter
  • Dissolved Oxygen Meter
  • Potentiometric Titrators
  • Pocket Testers

By Technology Type:

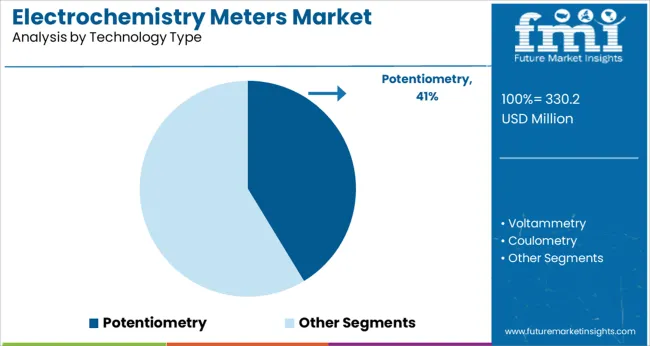
  • Voltammetry
  • Potentiometry
  • Coulometry
  • Others

By End-use Industry:

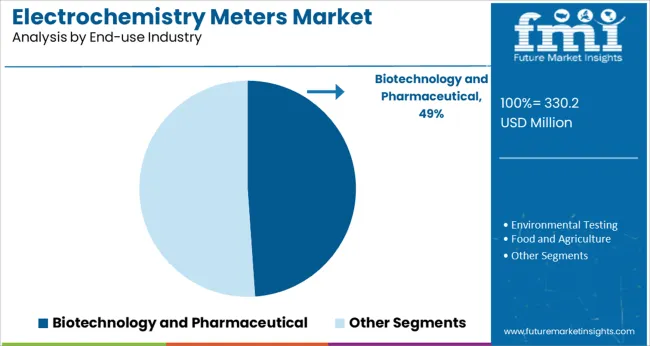
  • Environmental Testing
  • Food and Agriculture
  • Biotechnology and Pharmaceutical
  • Academic Research Institutes
  • Others

By Region:

  • North America
  • Latin America
  • Western Europe
  • Eastern Europe
  • APEJ
  • Japan
  • Middle East and Africa

Frequently Asked Questions

At what rate will the electrochemistry meters market grow?

The global electrochemistry meters market is set to surpass US$ 691.3 Million in 2032.

Which region is set to lead the electrochemistry meters market?

North America is set to lead the electrochemistry meters market in the forecast period.

Which are some of the renowned companies in the electrochemistry meters market?

METTLER-TOLEDO International, Inc., Metrohm AG, Yokogawa Electric Corporation, Xylem Inc., and Thermo Fisher Scientific, Inc. are some of the renowned companies in the electrochemistry meters market.

Table of Content
1. Executive Summary

    1.1. Global Market Outlook

    1.2. Demand-side Trends

    1.3. Supply-side Trends

    1.4. Technology Roadmap Analysis

    1.5. Analysis and Recommendations

2. Market Overview

    2.1. Market Coverage / Taxonomy

    2.2. Market Definition / Scope / Limitations

3. Market Background

    3.1. Market Dynamics

        3.1.1. Drivers

        3.1.2. Restraints

        3.1.3. Opportunity

        3.1.4. Trends

    3.2. Scenario Forecast

        3.2.1. Demand in Optimistic Scenario

        3.2.2. Demand in Likely Scenario

        3.2.3. Demand in Conservative Scenario

    3.3. Opportunity Map Analysis

    3.4. Product Life Cycle Analysis

    3.5. Supply Chain Analysis

        3.5.1. Supply Side Participants and their Roles

            3.5.1.1. Producers

            3.5.1.2. Mid-Level Participants (Traders/ Agents/ Brokers)

            3.5.1.3. Wholesalers and Distributors

        3.5.2. Value Added and Value Created at Node in the Supply Chain

        3.5.3. List of Raw Material Suppliers

        3.5.4. List of Existing and Potential Buyer’s

    3.6. Investment Feasibility Matrix

    3.7. Value Chain Analysis

        3.7.1. Profit Margin Analysis

        3.7.2. Wholesalers and Distributors

        3.7.3. Retailers

    3.8. PESTLE and Porter’s Analysis

    3.9. Regulatory Landscape

        3.9.1. By Key Regions

        3.9.2. By Key Countries

    3.10. Regional Parent Market Outlook

    3.11. Production and Consumption Statistics

    3.12. Import and Export Statistics

4. Global Electrochemistry Meters Market Analysis 2017-2021 and Forecast, 2022-2032

    4.1. Historical Market Size Value (US$ Mn) & Volume (Units) Analysis, 2017-2021

    4.2. Current and Future Market Size Value (US$ Mn) & Volume (Units) Projections, 2022-2032

        4.2.1. Y-o-Y Growth Trend Analysis

        4.2.2. Absolute $ Opportunity Analysis

5. Global Electrochemistry Meters Market Analysis 2017-2021 and Forecast 2022-2032, By Product Type

    5.1. Introduction / Key Findings

    5.2. Historical Market Size Value (US$ Mn) & Volume (Units) Analysis By Product Type, 2017-2021

    5.3. Current and Future Market Size Value (US$ Mn) & Volume (Units) Analysis and Forecast By Product Type, 2022-2032

        5.3.1. pH and ORP Meter

        5.3.2. Conductivity Meter

        5.3.3. Ion Concentration Meter

        5.3.4. Dissolved Oxygen Meter

        5.3.5. Potentiometric Titrators

        5.3.6. Pocket Testers

    5.4. Y-o-Y Growth Trend Analysis By Product Type, 2017-2021

    5.5. Absolute $ Opportunity Analysis By Product Type, 2022-2032

6. Global Electrochemistry Meters Market Analysis 2017-2021 and Forecast 2022-2032, By Technology Type

    6.1. Introduction / Key Findings

    6.2. Historical Market Size Value (US$ Mn) & Volume (Units) Analysis By Technology Type, 2017-2021

    6.3. Current and Future Market Size Value (US$ Mn) & Volume (Units) Analysis and Forecast By Technology Type, 2022-2032

        6.3.1. Voltammetry

        6.3.2. Potentiometry

        6.3.3. Coulometry

        6.3.4. Other Technology Types

    6.4. Y-o-Y Growth Trend Analysis By Technology Type, 2017-2021

    6.5. Absolute $ Opportunity Analysis By Technology Type, 2022-2032

7. Global Electrochemistry Meters Market Analysis 2017-2021 and Forecast 2022-2032, By End Use Industry

    7.1. Introduction / Key Findings

    7.2. Historical Market Size Value (US$ Mn) & Volume (Units) Analysis By End Use Industry, 2017-2021

    7.3. Current and Future Market Size Value (US$ Mn) & Volume (Units) Analysis and Forecast By End Use Industry, 2022-2032

        7.3.1. Environmental Testing

        7.3.2. Food and Agriculture

        7.3.3. Biotechnology and Pharmaceutical

        7.3.4. Academic Research Institutes

        7.3.5. Others

    7.4. Y-o-Y Growth Trend Analysis By End Use Industry, 2017-2021

    7.5. Absolute $ Opportunity Analysis By End Use Industry, 2022-2032

8. Global Electrochemistry Meters Market Analysis 2017-2021 and Forecast 2022-2032, By Region

    8.1. Introduction

    8.2. Historical Market Size Value (US$ Mn) & Volume (Units) Analysis By Region, 2017-2021

    8.3. Current Market Size Value (US$ Mn) & Volume (Units) Analysis and Forecast By Region, 2022-2032

        8.3.1. North America

        8.3.2. Latin America

        8.3.3. Europe

        8.3.4. East Asia

        8.3.5. South Asia & Pacific

        8.3.6. MEA

    8.4. Market Attractiveness Analysis By Region

9. North America Electrochemistry Meters Market Analysis 2017-2021 and Forecast 2022-2032, By Country

    9.1. Historical Market Size Value (US$ Mn) & Volume (Units) Trend Analysis By Market Taxonomy, 2017-2021

    9.2. Market Size Value (US$ Mn) & Volume (Units) Forecast By Market Taxonomy, 2022-2032

        9.2.1. By Country

            9.2.1.1. U.S.

            9.2.1.2. Canada

        9.2.2. By Product Type

        9.2.3. By Technology Type

        9.2.4. By End Use Industry

    9.3. Market Attractiveness Analysis

        9.3.1. By Country

        9.3.2. By Product Type

        9.3.3. By Technology Type

        9.3.4. By End Use Industry

    9.4. Key Takeaways

10. Latin America Electrochemistry Meters Market Analysis 2017-2021 and Forecast 2022-2032, By Country

    10.1. Historical Market Size Value (US$ Mn) & Volume (Units) Trend Analysis By Market Taxonomy, 2017-2021

    10.2. Market Size Value (US$ Mn) & Volume (Units) Forecast By Market Taxonomy, 2022-2032

        10.2.1. By Country

            10.2.1.1. Brazil

            10.2.1.2. Mexico

            10.2.1.3. Rest of Latin America

        10.2.2. By Product Type

        10.2.3. By Technology Type

        10.2.4. By End Use Industry

    10.3. Market Attractiveness Analysis

        10.3.1. By Country

        10.3.2. By Product Type

        10.3.3. By Technology Type

        10.3.4. By End Use Industry

    10.4. Key Takeaways

11. Europe Electrochemistry Meters Market Analysis 2017-2021 and Forecast 2022-2032, By Country

    11.1. Historical Market Size Value (US$ Mn) & Volume (Units) Trend Analysis By Market Taxonomy, 2017-2021

    11.2. Market Size Value (US$ Mn) & Volume (Units) Forecast By Market Taxonomy, 2022-2032

        11.2.1. By Country

            11.2.1.1. Germany

            11.2.1.2. U.K.

            11.2.1.3. France

            11.2.1.4. Spain

            11.2.1.5. Italy

            11.2.1.6. Rest of Europe

        11.2.2. By Product Type

        11.2.3. By Technology Type

        11.2.4. By End Use Industry

    11.3. Market Attractiveness Analysis

        11.3.1. By Country

        11.3.2. By Product Type

        11.3.3. By Technology Type

        11.3.4. By End Use Industry

    11.4. Key Takeaways

12. East Asia Electrochemistry Meters Market Analysis 2017-2021 and Forecast 2022-2032, By Country

    12.1. Historical Market Size Value (US$ Mn) & Volume (Units) Trend Analysis By Market Taxonomy, 2017-2021

    12.2. Market Size Value (US$ Mn) & Volume (Units) Forecast By Market Taxonomy, 2022-2032

        12.2.1. By Country

            12.2.1.1. China

            12.2.1.2. Japan

            12.2.1.3. South Korea

        12.2.2. By Product Type

        12.2.3. By Technology Type

        12.2.4. By End Use Industry

    12.3. Market Attractiveness Analysis

        12.3.1. By Country

        12.3.2. By Product Type

        12.3.3. By Technology Type

        12.3.4. By End Use Industry

    12.4. Key Takeaways

13. South Asia & Pacific Electrochemistry Meters Market Analysis 2017-2021 and Forecast 2022-2032, By Country

    13.1. Historical Market Size Value (US$ Mn) & Volume (Units) Trend Analysis By Market Taxonomy, 2017-2021

    13.2. Market Size Value (US$ Mn) & Volume (Units) Forecast By Market Taxonomy, 2022-2032

        13.2.1. By Country

            13.2.1.1. India

            13.2.1.2. Thailand

            13.2.1.3. Indonesia

            13.2.1.4. Malaysia

            13.2.1.5. Singapore

            13.2.1.6. Australia

            13.2.1.7. New Zealand

            13.2.1.8. Rest of South Asia & Pacific

        13.2.2. By Product Type

        13.2.3. By Technology Type

        13.2.4. By End Use Industry

    13.3. Market Attractiveness Analysis

        13.3.1. By Country

        13.3.2. By Product Type

        13.3.3. By Technology Type

        13.3.4. By End Use Industry

    13.4. Key Takeaways

14. MEA Electrochemistry Meters Market Analysis 2017-2021 and Forecast 2022-2032, By Country

    14.1. Historical Market Size Value (US$ Mn) & Volume (Units) Trend Analysis By Market Taxonomy, 2017-2021

    14.2. Market Size Value (US$ Mn) & Volume (Units) Forecast By Market Taxonomy, 2022-2032

        14.2.1. By Country

            14.2.1.1. GCC Countries

            14.2.1.2. South Africa

            14.2.1.3. Israel

            14.2.1.4. Rest of MEA

        14.2.2. By Product Type

        14.2.3. By Technology Type

        14.2.4. By End Use Industry

    14.3. Market Attractiveness Analysis

        14.3.1. By Country

        14.3.2. By Product Type

        14.3.3. By Technology Type

        14.3.4. By End Use Industry

    14.4. Key Takeaways

15. Key Countries Electrochemistry Meters Market Analysis

    15.1. U.S.

        15.1.1. Pricing Analysis

        15.1.2. Market Share Analysis, 2021

            15.1.2.1. By Product Type

            15.1.2.2. By Technology Type

            15.1.2.3. By End Use Industry

    15.2. Canada

        15.2.1. Pricing Analysis

        15.2.2. Market Share Analysis, 2021

            15.2.2.1. By Product Type

            15.2.2.2. By Technology Type

            15.2.2.3. By End Use Industry

    15.3. Brazil

        15.3.1. Pricing Analysis

        15.3.2. Market Share Analysis, 2021

            15.3.2.1. By Product Type

            15.3.2.2. By Technology Type

            15.3.2.3. By End Use Industry

    15.4. Mexico

        15.4.1. Pricing Analysis

        15.4.2. Market Share Analysis, 2021

            15.4.2.1. By Product Type

            15.4.2.2. By Technology Type

            15.4.2.3. By End Use Industry

    15.5. Germany

        15.5.1. Pricing Analysis

        15.5.2. Market Share Analysis, 2021

            15.5.2.1. By Product Type

            15.5.2.2. By Technology Type

            15.5.2.3. By End Use Industry

    15.6. U.K.

        15.6.1. Pricing Analysis

        15.6.2. Market Share Analysis, 2021

            15.6.2.1. By Product Type

            15.6.2.2. By Technology Type

            15.6.2.3. By End Use Industry

    15.7. France

        15.7.1. Pricing Analysis

        15.7.2. Market Share Analysis, 2021

            15.7.2.1. By Product Type

            15.7.2.2. By Technology Type

            15.7.2.3. By End Use Industry

    15.8. Spain

        15.8.1. Pricing Analysis

        15.8.2. Market Share Analysis, 2021

            15.8.2.1. By Product Type

            15.8.2.2. By Technology Type

            15.8.2.3. By End Use Industry

    15.9. Italy

        15.9.1. Pricing Analysis

        15.9.2. Market Share Analysis, 2021

            15.9.2.1. By Product Type

            15.9.2.2. By Technology Type

            15.9.2.3. By End Use Industry

    15.10. China

        15.10.1. Pricing Analysis

        15.10.2. Market Share Analysis, 2021

            15.10.2.1. By Product Type

            15.10.2.2. By Technology Type

            15.10.2.3. By End Use Industry

    15.11. Japan

        15.11.1. Pricing Analysis

        15.11.2. Market Share Analysis, 2021

            15.11.2.1. By Product Type

            15.11.2.2. By Technology Type

            15.11.2.3. By End Use Industry

    15.12. South Korea

        15.12.1. Pricing Analysis

        15.12.2. Market Share Analysis, 2021

            15.12.2.1. By Product Type

            15.12.2.2. By Technology Type

            15.12.2.3. By End Use Industry

    15.13. India

        15.13.1. Pricing Analysis

        15.13.2. Market Share Analysis, 2021

            15.13.2.1. By Product Type

            15.13.2.2. By Technology Type

            15.13.2.3. By End Use Industry

    15.14. Thailand

        15.14.1. Pricing Analysis

        15.14.2. Market Share Analysis, 2021

            15.14.2.1. By Product Type

            15.14.2.2. By Technology Type

            15.14.2.3. By End Use Industry

    15.15. Indonesia

        15.15.1. Pricing Analysis

        15.15.2. Market Share Analysis, 2021

            15.15.2.1. By Product Type

            15.15.2.2. By Technology Type

            15.15.2.3. By End Use Industry

    15.16. Malaysia

        15.16.1. Pricing Analysis

        15.16.2. Market Share Analysis, 2021

            15.16.2.1. By Product Type

            15.16.2.2. By Technology Type

            15.16.2.3. By End Use Industry

    15.17. Singapore

        15.17.1. Pricing Analysis

        15.17.2. Market Share Analysis, 2021

            15.17.2.1. By Product Type

            15.17.2.2. By Technology Type

            15.17.2.3. By End Use Industry

    15.18. Australia

        15.18.1. Pricing Analysis

        15.18.2. Market Share Analysis, 2021

            15.18.2.1. By Product Type

            15.18.2.2. By Technology Type

            15.18.2.3. By End Use Industry

    15.19. New Zealand

        15.19.1. Pricing Analysis

        15.19.2. Market Share Analysis, 2021

            15.19.2.1. By Product Type

            15.19.2.2. By Technology Type

            15.19.2.3. By End Use Industry

    15.20. GCC Countries

        15.20.1. Pricing Analysis

        15.20.2. Market Share Analysis, 2021

            15.20.2.1. By Product Type

            15.20.2.2. By Technology Type

            15.20.2.3. By End Use Industry

    15.21. South Africa

        15.21.1. Pricing Analysis

        15.21.2. Market Share Analysis, 2021

            15.21.2.1. By Product Type

            15.21.2.2. By Technology Type

            15.21.2.3. By End Use Industry

    15.22. Israel

        15.22.1. Pricing Analysis

        15.22.2. Market Share Analysis, 2021

            15.22.2.1. By Product Type

            15.22.2.2. By Technology Type

            15.22.2.3. By End Use Industry

16. Market Structure Analysis

    16.1. Competition Dashboard

    16.2. Competition Benchmarking

    16.3. Market Share Analysis of Top Players

        16.3.1. By Regional

        16.3.2. By Product Type

        16.3.3. By Technology Type

        16.3.4. By End Use Industry

17. Competition Analysis

    17.1. Competition Deep Dive

        17.1.1. Metrohm AG

            17.1.1.1. Overview

            17.1.1.2. Product Portfolio

            17.1.1.3. Profitability by Market Segments

            17.1.1.4. Sales Footprint

            17.1.1.5. Strategy Overview

                17.1.1.5.1. Marketing Strategy

                17.1.1.5.2. Product Strategy

                17.1.1.5.3. Channel Strategy

        17.1.2. HANNA Instruments, Inc.

            17.1.2.1. Overview

            17.1.2.2. Product Portfolio

            17.1.2.3. Profitability by Market Segments

            17.1.2.4. Sales Footprint

            17.1.2.5. Strategy Overview

                17.1.2.5.1. Marketing Strategy

                17.1.2.5.2. Product Strategy

                17.1.2.5.3. Channel Strategy

        17.1.3. Xylem Inc.

            17.1.3.1. Overview

            17.1.3.2. Product Portfolio

            17.1.3.3. Profitability by Market Segments

            17.1.3.4. Sales Footprint

            17.1.3.5. Strategy Overview

                17.1.3.5.1. Marketing Strategy

                17.1.3.5.2. Product Strategy

                17.1.3.5.3. Channel Strategy

        17.1.4. DKK TOA Corporation

            17.1.4.1. Overview

            17.1.4.2. Product Portfolio

            17.1.4.3. Profitability by Market Segments

            17.1.4.4. Sales Footprint

            17.1.4.5. Strategy Overview

                17.1.4.5.1. Marketing Strategy

                17.1.4.5.2. Product Strategy

                17.1.4.5.3. Channel Strategy

        17.1.5. METTLER-TOLEDO International, Inc.

            17.1.5.1. Overview

            17.1.5.2. Product Portfolio

            17.1.5.3. Profitability by Market Segments

            17.1.5.4. Sales Footprint

            17.1.5.5. Strategy Overview

                17.1.5.5.1. Marketing Strategy

                17.1.5.5.2. Product Strategy

                17.1.5.5.3. Channel Strategy

        17.1.6. Danaher Corporation

            17.1.6.1. Overview

            17.1.6.2. Product Portfolio

            17.1.6.3. Profitability by Market Segments

            17.1.6.4. Sales Footprint

            17.1.6.5. Strategy Overview

                17.1.6.5.1. Marketing Strategy

                17.1.6.5.2. Product Strategy

                17.1.6.5.3. Channel Strategy

        17.1.7. Thermo Fisher Scientific, Inc.

            17.1.7.1. Overview

            17.1.7.2. Product Portfolio

            17.1.7.3. Profitability by Market Segments

            17.1.7.4. Sales Footprint

            17.1.7.5. Strategy Overview

                17.1.7.5.1. Marketing Strategy

                17.1.7.5.2. Product Strategy

                17.1.7.5.3. Channel Strategy

        17.1.8. Endress+Hauser AG

            17.1.8.1. Overview

            17.1.8.2. Product Portfolio

            17.1.8.3. Profitability by Market Segments

            17.1.8.4. Sales Footprint

            17.1.8.5. Strategy Overview

                17.1.8.5.1. Marketing Strategy

                17.1.8.5.2. Product Strategy

                17.1.8.5.3. Channel Strategy

        17.1.9. Yokogawa Electric Corporation

            17.1.9.1. Overview

            17.1.9.2. Product Portfolio

            17.1.9.3. Profitability by Market Segments

            17.1.9.4. Sales Footprint

            17.1.9.5. Strategy Overview

                17.1.9.5.1. Marketing Strategy

                17.1.9.5.2. Product Strategy

                17.1.9.5.3. Channel Strategy

        17.1.10. Horiba Ltd.

            17.1.10.1. Overview

            17.1.10.2. Product Portfolio

            17.1.10.3. Profitability by Market Segments

            17.1.10.4. Sales Footprint

            17.1.10.5. Strategy Overview

                17.1.10.5.1. Marketing Strategy

                17.1.10.5.2. Product Strategy

                17.1.10.5.3. Channel Strategy

18. Assumptions & Acronyms Used

19. Research Methodology

Explore Testing Equipment Insights

View Reports
Future Market Insights

Electrochemistry Meters Market