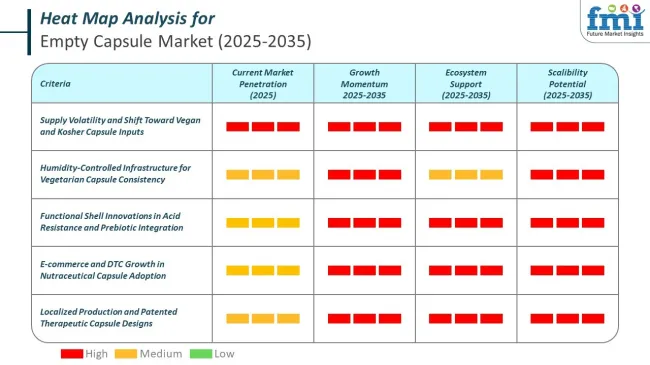
The global empty capsule market is worth USD 3.19 billion in 2025 and is poised to reach USD 6.89 billion by 2035, which depicts a CAGR of 8.0% over the forecast period. This growth is being driven by the rising demand for capsule-based drug delivery systems in pharmaceuticals, nutraceuticals, and dietary supplements.
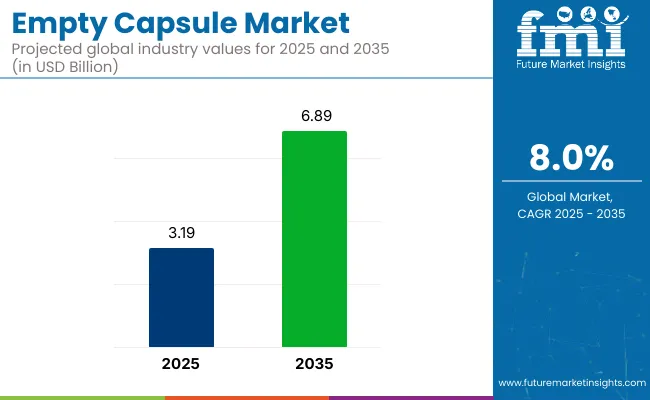
Empty capsules, including gelatin and hydroxypropyl methylcellulose (HPMC) varieties, are widely used for encapsulating powders, granules, liquids, and semi-solids. Their ease of swallowing, better bioavailability, and capacity to mask unpleasant tastes make them preferable over traditional tablets. Increasing geriatric populations, expanding self-medication trends, and consumer preference for clean-label supplements are further accelerating market demand.
Technological advancements and material innovation are shaping the future of capsule manufacturing. Companies are focusing on developing vegetarian, organic, and allergen-free capsules that align with evolving consumer preferences and regulatory standards. In this regard, they are investing ample amounts in research and development.
Plant-based capsules are gaining traction among vegan and halal-conscious populations, particularly in North America, Europe, and Southeast Asia. Moreover, functional capsules with enteric coatings, controlled release profiles, and enhanced dissolution properties are being adopted in specialized drug delivery. Contract manufacturers and pharmaceutical companies are also leveraging high-speed encapsulation technologies and automated lines to scale production efficiently while maintaining quality and compliance.
Regulatory support and growing investments in healthcare infrastructure are enhancing market potential across both developed and emerging regions. Authorities such as the U.S. FDA, EMA, and WHO are streamlining guidelines around capsule safety, raw material sourcing, and labeling standards.
Emerging economies are witnessing increased demand for over-the-counter medications and personalized supplements, creating opportunities for capsule manufacturers to expand their presence. With growing emphasis on preventive healthcare, improved patient compliance, and innovative dosage forms, the empty capsule market is expected to experience robust growth across the pharmaceutical, nutraceutical, and functional food industries from 2025 to 2035.
Metric | Value |
---|---|
Industry Size (2025E) | USD 3.19 billion |
Industry Value (2035F) | USD 6.89 billion |
CAGR (2025 to 2035) | 8.0% |
The market is segmented based on product type, raw material, capsule size, route of administration, end user, and region. By product type, the market is divided into gelatin-based capsules and vegetarian-based capsules. In terms of raw material, it is segmented into Type-A, Type-B gelatin, fish bone gelatin, hydroxy propyl methyl cellulose (HPMC), starch materials, and pullulan.
Based on capsule size, the market includes size “000”, size “00”, size “0”, size “1”, size “2”, size “3”, size “4”, and size “5”. By route of administration, the market is categorized into oral administration and inhalation administration. In terms of end user, the market includes pharmaceutical companies, cosmetic & nutraceutical companies, and clinical research organizations. Regionally, the market is classified into North America, Latin America, Western Europe, Eastern Europe, South Asia and Pacific, East Asia, and the Middle East and Africa.
Gelatin-based capsules are projected to lead the empty capsule market with a 2025 share of 60.2%. These capsules remain the industry standard due to their excellent machinability, compatibility with a broad range of active pharmaceutical ingredients (APIs), and cost-efficiency.
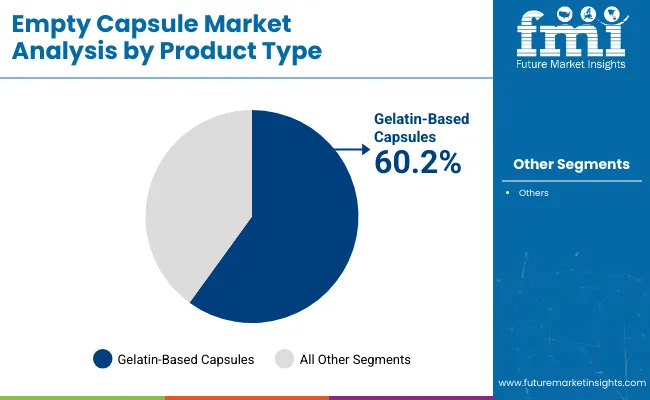
Their long-standing regulatory acceptance and consumer familiarity make them highly suitable for prescription, OTC, and nutraceutical applications. Type-A and Type-B bovine-sourced gelatin are commonly used in these capsules, offering reliable disintegration profiles and predictable bioavailability. Leading suppliers such as Capsugel (Lonza), ACG Group, and Qualicaps are expanding gelatin capsule lines for oral delivery formats across both developed and emerging markets.
In contrast, vegetarian-based capsules are gaining notable traction, with an estimated 2025 share of 39.8%. This growth is being driven by rising veganism, dietary restrictions (e.g., halal, kosher), and clean-label trends. HPMC and pullulan-based vegetarian capsules are increasingly preferred in dietary supplements and herbal formulations.
Despite being costlier, they provide an edge in plant-based positioning and stability for moisture-sensitive formulations. Companies like Suheung and CapsCanada are actively innovating vegetarian capsule technologies. While vegetarian formats continue to grow, gelatin-based capsules retain their market leadership due to processing ease, formulation flexibility, and cost advantages, especially in the pharmaceutical sector.
Product Type Segment | Market Share (2025) |
---|---|
Gelatin-Based Capsules | 60.2% |
The raw material segment of the empty capsule market is led by Type-B gelatin, projected to capture a 30.2% share in 2025. Known for its cost-efficiency and versatility, Type-B gelatin is widely used in pharmaceutical and nutraceutical applications due to its strong gelling ability, high elasticity, and ease of processing.
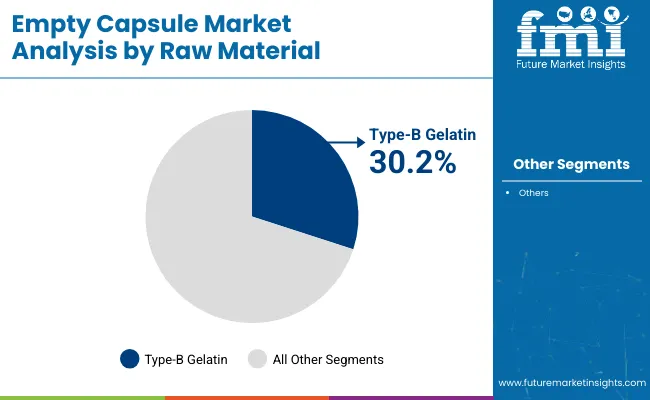
Manufacturers prefer it for encapsulating a range of active pharmaceutical ingredients (APIs), vitamins, and herbal supplements. Its prevalence is particularly high in Asia Pacific and Latin American markets, where cost sensitivity and volume production are key priorities.
Hydroxy Propyl Methyl Cellulose (HPMC), a plant-based alternative, is also gaining momentum, accounting for an estimated 24.5 percent market share in 2025. The rising demand for vegetarian and vegan capsules, especially in North America and Europe, is driving adoption of HPMC, which offers chemical stability, moisture resistance, and suitability for hygroscopic formulations. Major players like Lonza and Capsugel continue to expand their HPMC capsule offerings to meet evolving consumer preferences.
Other materials such as Type-A gelatin, pullulan, starch, and fish bone gelatin are being adopted in specialized use cases requiring specific physical and chemical properties. As capsule manufacturers expand their portfolios, raw material versatility remains central to product innovation and regional market expansion.
Raw Material Segment | Market Share (2025) |
---|---|
Type-B Gelatin | 30.2% |
The size "0" capsule segment is projected to dominate the empty capsule market in 2025, accounting 38.2% market share. This size strikes a practical balance between payload capacity and swallowability, making it highly favored in both pharmaceutical and nutraceutical applications. Typically used for encapsulating herbal powders, vitamins, minerals, and prescription drugs, size "0" capsules are compatible with both gelatin and HPMC (vegetarian) materials.
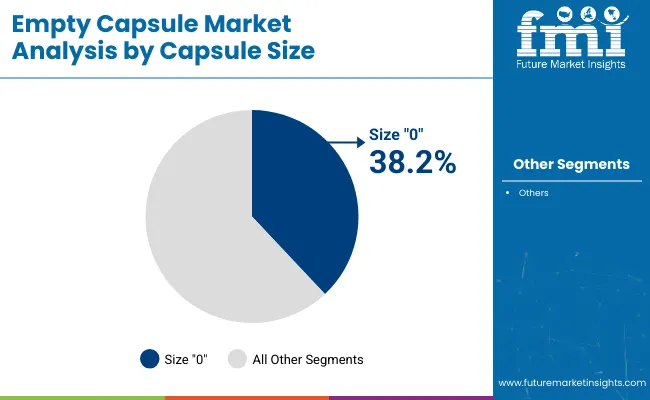
Manufacturers such as ACG and CapsCanada are focusing on high-speed filling equipment and improved shell integrity to meet growing demand across adult formulations. The segment continues to benefit from its ability to deliver moderate active ingredient dosages without compromising consumer comfort or safety.
The size “1” capsule segment is expected to hold 26.7% market share in 2025, with increasing usage in pediatric and geriatric formulations. This size is preferred for lower-dose medications, often used in personalized medicine, probiotics, and condition-specific nutritional products. Its compact profile supports improved compliance among sensitive populations.
Size “1” capsules are also gaining ground in clinical trials where dose variation and blinding are crucial. While larger sizes like “00” and smaller ones like “2” remain in use, size “0” and size “1” capsules will continue to represent the bulk of industry demand due to their optimal sizing and application versatility.
Capsule Size Segment | Market Share (2025) |
---|---|
Size "0" | 38.2% |
The oral administration segment is anticipated to hold 87.4% share of the empty capsule market by 2025, making it the most dominant route of administration. Its prevalence is underpinned by advantages such as patient comfort, broad formulation flexibility, and the ability to deliver drugs, vitamins, and herbal ingredients with taste-masking and easy ingestion.
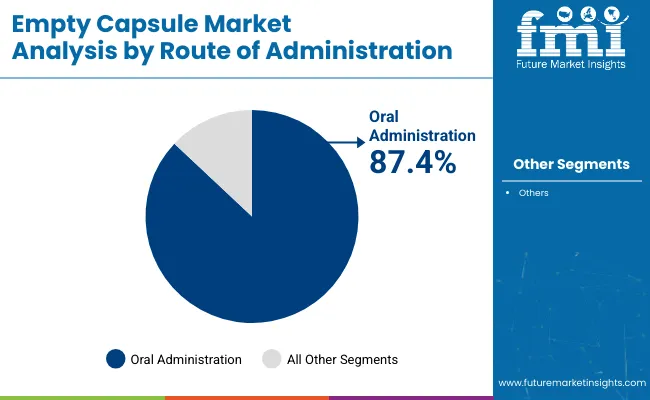
Oral capsules are widely adopted for extended, delayed, and sustained-release dosage forms, enabling companies to address chronic conditions efficiently. Pharmaceutical players favor oral capsules for their superior scalability, shelf stability, and compatibility with both gelatin and HPMC variants, supporting large-scale and diverse production runs.
The inhalation segment is projected to grow at 7.6% CAGR during the study period, driven primarily by its application in respiratory therapies. Capsules used for dry powder inhalers (DPIs) are gaining traction in treating asthma, COPD, and pulmonary infections.
Despite its niche share, this route is growing due to increasing R&D in pulmonary delivery systems and innovation in capsule shell materials that ensure optimal puncture and dispersion performance. However, the need for device compatibility and strict manufacturing standards limits its broader use. Oral capsules remain the primary delivery route, particularly in emerging markets where accessibility and user familiarity sustain consistent market preference.
Route of Administration | Market Share (2025) |
---|---|
Oral Administration | 87.4% |
Pharmaceutical companies are expected to lead the empty capsule market by end user in 2025, capturing a 61.3% market share. This dominance is driven by high-volume drug manufacturing across therapeutic areas including pain management, antibiotics, and mental health.
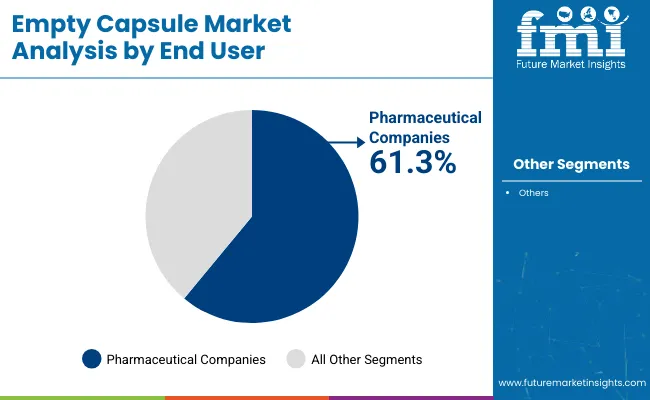
Capsules are preferred for their ease of formulation, cost-effectiveness, and adaptability to various release profiles. They are especially favored for generic drugs, over-the-counter (OTC) offerings, and combination therapies. Companies such as Lonza and Qualicaps are expanding global production capacities and developing pharma-compliant, plant-based capsule alternatives to cater to both conventional and specialty drug pipelines.
The clinical research organizations (CROs) segment is estimated to account for 18.5% of the market share in 2025. CROs rely on empty capsules for blinded trials, pharmacokinetic studies, and dosage flexibility during early-stage development.
Their ability to create custom-dosed, placebo-controlled capsules makes them ideal for clinical investigations across oncology, neurology, and infectious diseases. The rise of contract research outsourcing, particularly in Asia and Eastern Europe, is amplifying demand. While nutraceutical brands and cosmetic formulators contribute to overall market volume, pharmaceutical companies and CROs will remain central to innovation and adoption in capsule-based drug delivery systems through 2035.
End User Segment | Market Share (2025) |
---|---|
Pharmaceutical Companies | 61.3% |
Consumer preferences for capsule dose forms are increasing due to convenience, ease of ingesting, and enhanced taste masking. Capsules are a convenient and edible alternative to standard dose forms such as tablets or powders. The gelatin or vegetarian shells used in empty capsules conceal the taste of substances, making them more appealing to customers.
Consumer preferences are shifting toward capsules as the preferred dose form in various industries, driving the sales of empty capsules. This trend emphasizes the value of empty capsules as a versatile and adaptable solution that meets changing consumer expectations for smooth and enjoyable healthcare experiences.
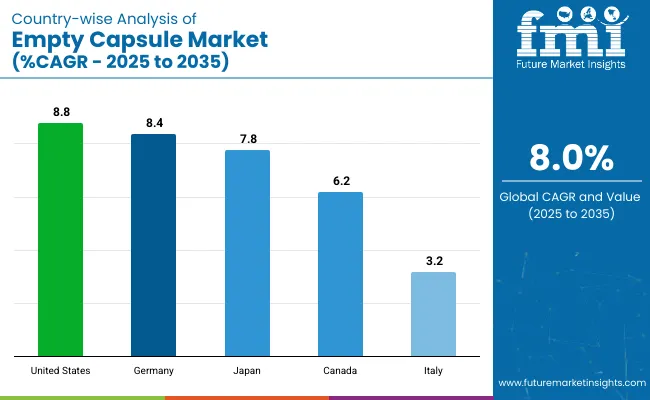
This section explores markets in many key economies, including the United States, Canada, Japan, Germany, and Italy. It also examines the various factors influencing empty capsule demand, adoption, and sales in these nations. A detailed investigation shows North America offers significant growth opportunities due to its robust empty capsule manufacturers.
The United States empty capsule market is anticipated to display a strong CAGR of 8.8% from 2025 to 2035. The increased preference for vegetarian and plant-based capsules helps stimulate the United States empty capsule market. The demand for empty capsules in the country is also driven by the growing acceptance of personalized medicine and nutraceutical products.
Furthermore, rising investments in drug research and development continue to benefit the expansion of the United States’ empty capsule industry, reinforcing the country’s position as a key global player.
Nation | United States |
---|---|
CAGR | 8.8% |
The empty capsule market in Germany is expected to evolve at a CAGR of 8.4% from 2025 to 2035. Germany's strict quality standards and adherence to Good Manufacturing Practices (GMP) enhance the reputation of its empty capsule industry both domestically and across Europe.
Ongoing technological advancements and the introduction of automation in pharmaceutical production have improved the industry’s operational efficiency. Additionally, Germany’s strategic geographic position and well-developed logistics infrastructure make it easier for manufacturers to distribute and export empty capsules throughout the European continent.
Nation | Germany |
---|---|
CAGR | 8.4% |
Japan's empty capsule market is projected to grow at a CAGR of 7.8% from 2025 to 2035, primarily due to the increasing demand for nutraceuticals. The country’s aging population and the rising need for geriatric-friendly medicine formats are key contributors to this growth.
Investment in pharmaceutical research and development is also intensifying, helping Japan’s empty capsule sector remain competitive on a global scale. Moreover, cultural preferences for easy-to-swallow dosage forms and precise medication administration continue to support the consistent expansion of the Japanese market.
Country | Japan |
---|---|
CAGR | 7.8% |
The Canadian empty capsule market is expected to grow at a CAGR of 6.2% from 2025 to 2035. The country’s aging demographic is leading to increased demand for various drug forms, which has a direct positive impact on the empty capsule industry. Government initiatives and legislative frameworks that support pharmaceutical manufacturing are further strengthening the market. Additionally, Canada's focus on sustainable and eco-conscious healthcare practices is shaping trends, with a growing emphasis on environmentally friendly capsule materials that align with the country’s values and consumer preferences.
Nation | Canada |
---|---|
CAGR | 6.2% |
Italy’s empty capsule market is forecast to expand at a relatively slower CAGR of 3.2% from 2025 to 2035. The country’s market dynamics are influenced by a strong cultural inclination toward natural wellness and the use of organic capsule materials.
Italy’s emphasis on traditional medicine and herbal supplement consumption is supporting demand in the nutraceutical segment. At the same time, a growing interest in customizable dosage formats and patient-centric medication options is gradually expanding the scope of the empty capsule industry within the Italian pharmaceutical and nutraceutical landscape.
Nation | Italy |
---|---|
CAGR | 3.2% |
In the competitive landscape of the empty capsule market, numerous important competitors have established themselves as significant contributors to the industry's growth and evolution. The empty capsule producers have shown dedication to innovation, dependability, and a wide range of competencies, altering market dynamics.
Empty capsule manufacturers, such as ABC Capsules, Capsugel, and ACG Worldwide, are at the forefront of innovation and have established themselves as dependable suppliers of empty capsules. Prominent vendors such as Qualicaps and Suheung Co. Ltd. share their capabilities and demonstrate various offerings. CapsCanada Corporation, Shanxi Guangsheng Medicinal Capsule Co. Ltd., and Bright Pharma Caps Inc. are notable participants, each making a unique contribution to the empty pill market.
HealthCaps India Limited and Sunil Healthcare Limited enhance the competitive landscape by providing innovative solutions and insights. As these key competitors negotiate the shifting empty capsule demand, the path is set for ongoing advancements and competition, undoubtedly encouraging innovation and success in the sector.
Notable Innovations and Developments
Company | Details |
---|---|
CapsCanada Corporation | CapsCanada Corporation received a substantial boost in November 2023 with a USD 5 million investment from FedDev Ontario. This investment is likely to expand operations and fulfill increased demand for its made-in-Canada hard empty capsules. |
Bright Pharma Caps Inc. | Bright Pharma Caps Inc. launched the world's first certified organic capsules, Bright-Poly, in August 2023. The capsules are manufactured of USDA-certified organic pullulan, which is NOP-approved and can be utilized in vegetarian, kosher, and halal products. |
Vivion | Vivion, a leading ingredient solutions company, has introduced a new line of empty gelatin, HPMC, and pullulan capsules. |
CapsCanada | CapsCanada, a Lyfe Group firm, announced in March 2021 the launch of a capsule manufacturing service for new liquid-filled hard capsules. |
Lonza Group Ltd. | Lonza Group Ltd. announced in October 2020 that it would invest USD 93.0 million in its Capsules and Health Ingredients (CHI) Division, enabling the company to produce 30 billion pills annually. |
Attribute | Details |
---|---|
Current Total Market Size (2025) | USD 3.19 billion |
Projected Market Size (2035) | USD 6.89 billion |
CAGR (2025 to 2035) | 8.0% |
Base Year for Estimation | 2024 |
Historical Period | 2020 to 2024 |
Projections Period | 2025 to 2035 |
Report Parameter | USD billion for value |
By Product Type | Gelatin-Based Capsules, Vegetarian-Based Capsules |
By Raw Material | Type-A, Type-B Gelatin, Fish Bone Gelatin, Hydroxy Propyl Methyl Cellulose (HPMC), Starch Materials, Pullulan |
By Capsule Size | Size “000”, Size “00”, Size “0”, Size “1”, Size “2”, Size “3”, Size “4”, Size “5” |
By Route of Administration | Oral Administration, Inhalation Administration |
By End User | Pharmaceutical Companies, Cosmetic & Nutraceutical Companies, Clinical Research Organizations |
Regions Covered | North America, Latin America, Western Europe, Eastern Europe, South Asia and Pacific, East Asia, Middle East and Africa |
Countries Covered | United States, Germany, Japan, Canada, Italy |
Key Players | ACG Worldwide, Capsugel, Qualicaps Inc., Bright Pharma Caps Inc., Medi-Caps Ltd., CapsCanada Corporation, Roxlor LLC, Snail Pharma Industry Co. Ltd., Suheung Co. Ltd., Sunil Healthcare Ltd |
Additional Attributes | Dollar sales by value, market share analysis by region, and country-wise analysis |
Table 1: Global Market Value (US$ Million) Forecast by Region, 2019 to 2034
Table 2: Global Market Volume (Unit Pack) Forecast by Region, 2019 to 2034
Table 3: Global Market Value (US$ Million) Forecast by Product Type, 2019 to 2034
Table 4: Global Market Volume (Unit Pack) Forecast by Product Type, 2019 to 2034
Table 5: Global Market Value (US$ Million) Forecast by Raw Material, 2019 to 2034
Table 6: Global Market Volume (Unit Pack) Forecast by Raw Material, 2019 to 2034
Table 7: Global Market Value (US$ Million) Forecast by Capsule Size, 2019 to 2034
Table 8: Global Market Volume (Unit Pack) Forecast by Capsule Size, 2019 to 2034
Table 9: Global Market Value (US$ Million) Forecast by Route of Administration, 2019 to 2034
Table 10: Global Market Volume (Unit Pack) Forecast by Route of Administration, 2019 to 2034
Table 11: Global Market Value (US$ Million) Forecast by End User, 2019 to 2034
Table 12: Global Market Volume (Unit Pack) Forecast by End User, 2019 to 2034
Table 13: North America Market Value (US$ Million) Forecast by Country, 2019 to 2034
Table 14: North America Market Volume (Unit Pack) Forecast by Country, 2019 to 2034
Table 15: North America Market Value (US$ Million) Forecast by Product Type, 2019 to 2034
Table 16: North America Market Volume (Unit Pack) Forecast by Product Type, 2019 to 2034
Table 17: North America Market Value (US$ Million) Forecast by Raw Material, 2019 to 2034
Table 18: North America Market Volume (Unit Pack) Forecast by Raw Material, 2019 to 2034
Table 19: North America Market Value (US$ Million) Forecast by Capsule Size, 2019 to 2034
Table 20: North America Market Volume (Unit Pack) Forecast by Capsule Size, 2019 to 2034
Table 21: North America Market Value (US$ Million) Forecast by Route of Administration, 2019 to 2034
Table 22: North America Market Volume (Unit Pack) Forecast by Route of Administration, 2019 to 2034
Table 23: North America Market Value (US$ Million) Forecast by End User, 2019 to 2034
Table 24: North America Market Volume (Unit Pack) Forecast by End User, 2019 to 2034
Table 25: Latin America Market Value (US$ Million) Forecast by Country, 2019 to 2034
Table 26: Latin America Market Volume (Unit Pack) Forecast by Country, 2019 to 2034
Table 27: Latin America Market Value (US$ Million) Forecast by Product Type, 2019 to 2034
Table 28: Latin America Market Volume (Unit Pack) Forecast by Product Type, 2019 to 2034
Table 29: Latin America Market Value (US$ Million) Forecast by Raw Material, 2019 to 2034
Table 30: Latin America Market Volume (Unit Pack) Forecast by Raw Material, 2019 to 2034
Table 31: Latin America Market Value (US$ Million) Forecast by Capsule Size, 2019 to 2034
Table 32: Latin America Market Volume (Unit Pack) Forecast by Capsule Size, 2019 to 2034
Table 33: Latin America Market Value (US$ Million) Forecast by Route of Administration, 2019 to 2034
Table 34: Latin America Market Volume (Unit Pack) Forecast by Route of Administration, 2019 to 2034
Table 35: Latin America Market Value (US$ Million) Forecast by End User, 2019 to 2034
Table 36: Latin America Market Volume (Unit Pack) Forecast by End User, 2019 to 2034
Table 37: Western Europe Market Value (US$ Million) Forecast by Country, 2019 to 2034
Table 38: Western Europe Market Volume (Unit Pack) Forecast by Country, 2019 to 2034
Table 39: Western Europe Market Value (US$ Million) Forecast by Product Type, 2019 to 2034
Table 40: Western Europe Market Volume (Unit Pack) Forecast by Product Type, 2019 to 2034
Table 41: Western Europe Market Value (US$ Million) Forecast by Raw Material, 2019 to 2034
Table 42: Western Europe Market Volume (Unit Pack) Forecast by Raw Material, 2019 to 2034
Table 43: Western Europe Market Value (US$ Million) Forecast by Capsule Size, 2019 to 2034
Table 44: Western Europe Market Volume (Unit Pack) Forecast by Capsule Size, 2019 to 2034
Table 45: Western Europe Market Value (US$ Million) Forecast by Route of Administration, 2019 to 2034
Table 46: Western Europe Market Volume (Unit Pack) Forecast by Route of Administration, 2019 to 2034
Table 47: Western Europe Market Value (US$ Million) Forecast by End User, 2019 to 2034
Table 48: Western Europe Market Volume (Unit Pack) Forecast by End User, 2019 to 2034
Table 49: Eastern Europe Market Value (US$ Million) Forecast by Country, 2019 to 2034
Table 50: Eastern Europe Market Volume (Unit Pack) Forecast by Country, 2019 to 2034
Table 51: Eastern Europe Market Value (US$ Million) Forecast by Product Type, 2019 to 2034
Table 52: Eastern Europe Market Volume (Unit Pack) Forecast by Product Type, 2019 to 2034
Table 53: Eastern Europe Market Value (US$ Million) Forecast by Raw Material, 2019 to 2034
Table 54: Eastern Europe Market Volume (Unit Pack) Forecast by Raw Material, 2019 to 2034
Table 55: Eastern Europe Market Value (US$ Million) Forecast by Capsule Size, 2019 to 2034
Table 56: Eastern Europe Market Volume (Unit Pack) Forecast by Capsule Size, 2019 to 2034
Table 57: Eastern Europe Market Value (US$ Million) Forecast by Route of Administration, 2019 to 2034
Table 58: Eastern Europe Market Volume (Unit Pack) Forecast by Route of Administration, 2019 to 2034
Table 59: Eastern Europe Market Value (US$ Million) Forecast by End User, 2019 to 2034
Table 60: Eastern Europe Market Volume (Unit Pack) Forecast by End User, 2019 to 2034
Table 61: South Asia and Pacific Market Value (US$ Million) Forecast by Country, 2019 to 2034
Table 62: South Asia and Pacific Market Volume (Unit Pack) Forecast by Country, 2019 to 2034
Table 63: South Asia and Pacific Market Value (US$ Million) Forecast by Product Type, 2019 to 2034
Table 64: South Asia and Pacific Market Volume (Unit Pack) Forecast by Product Type, 2019 to 2034
Table 65: South Asia and Pacific Market Value (US$ Million) Forecast by Raw Material, 2019 to 2034
Table 66: South Asia and Pacific Market Volume (Unit Pack) Forecast by Raw Material, 2019 to 2034
Table 67: South Asia and Pacific Market Value (US$ Million) Forecast by Capsule Size, 2019 to 2034
Table 68: South Asia and Pacific Market Volume (Unit Pack) Forecast by Capsule Size, 2019 to 2034
Table 69: South Asia and Pacific Market Value (US$ Million) Forecast by Route of Administration, 2019 to 2034
Table 70: South Asia and Pacific Market Volume (Unit Pack) Forecast by Route of Administration, 2019 to 2034
Table 71: South Asia and Pacific Market Value (US$ Million) Forecast by End User, 2019 to 2034
Table 72: South Asia and Pacific Market Volume (Unit Pack) Forecast by End User, 2019 to 2034
Table 73: East Asia Market Value (US$ Million) Forecast by Country, 2019 to 2034
Table 74: East Asia Market Volume (Unit Pack) Forecast by Country, 2019 to 2034
Table 75: East Asia Market Value (US$ Million) Forecast by Product Type, 2019 to 2034
Table 76: East Asia Market Volume (Unit Pack) Forecast by Product Type, 2019 to 2034
Table 77: East Asia Market Value (US$ Million) Forecast by Raw Material, 2019 to 2034
Table 78: East Asia Market Volume (Unit Pack) Forecast by Raw Material, 2019 to 2034
Table 79: East Asia Market Value (US$ Million) Forecast by Capsule Size, 2019 to 2034
Table 80: East Asia Market Volume (Unit Pack) Forecast by Capsule Size, 2019 to 2034
Table 81: East Asia Market Value (US$ Million) Forecast by Route of Administration, 2019 to 2034
Table 82: East Asia Market Volume (Unit Pack) Forecast by Route of Administration, 2019 to 2034
Table 83: East Asia Market Value (US$ Million) Forecast by End User, 2019 to 2034
Table 84: East Asia Market Volume (Unit Pack) Forecast by End User, 2019 to 2034
Table 85: Middle East and Africa Market Value (US$ Million) Forecast by Country, 2019 to 2034
Table 86: Middle East and Africa Market Volume (Unit Pack) Forecast by Country, 2019 to 2034
Table 87: Middle East and Africa Market Value (US$ Million) Forecast by Product Type, 2019 to 2034
Table 88: Middle East and Africa Market Volume (Unit Pack) Forecast by Product Type, 2019 to 2034
Table 89: Middle East and Africa Market Value (US$ Million) Forecast by Raw Material, 2019 to 2034
Table 90: Middle East and Africa Market Volume (Unit Pack) Forecast by Raw Material, 2019 to 2034
Table 91: Middle East and Africa Market Value (US$ Million) Forecast by Capsule Size, 2019 to 2034
Table 92: Middle East and Africa Market Volume (Unit Pack) Forecast by Capsule Size, 2019 to 2034
Table 93: Middle East and Africa Market Value (US$ Million) Forecast by Route of Administration, 2019 to 2034
Table 94: Middle East and Africa Market Volume (Unit Pack) Forecast by Route of Administration, 2019 to 2034
Table 95: Middle East and Africa Market Value (US$ Million) Forecast by End User, 2019 to 2034
Table 96: Middle East and Africa Market Volume (Unit Pack) Forecast by End User, 2019 to 2034
Figure 1: Global Market Value (US$ Million) by Product Type, 2024 to 2034
Figure 2: Global Market Value (US$ Million) by Raw Material, 2024 to 2034
Figure 3: Global Market Value (US$ Million) by Capsule Size, 2024 to 2034
Figure 4: Global Market Value (US$ Million) by Route of Administration, 2024 to 2034
Figure 5: Global Market Value (US$ Million) by End User, 2024 to 2034
Figure 6: Global Market Value (US$ Million) by Region, 2024 to 2034
Figure 7: Global Market Value (US$ Million) Analysis by Region, 2019 to 2034
Figure 8: Global Market Volume (Unit Pack) Analysis by Region, 2019 to 2034
Figure 9: Global Market Value Share (%) and BPS Analysis by Region, 2024 to 2034
Figure 10: Global Market Y-o-Y Growth (%) Projections by Region, 2024 to 2034
Figure 11: Global Market Value (US$ Million) Analysis by Product Type, 2019 to 2034
Figure 12: Global Market Volume (Unit Pack) Analysis by Product Type, 2019 to 2034
Figure 13: Global Market Value Share (%) and BPS Analysis by Product Type, 2024 to 2034
Figure 14: Global Market Y-o-Y Growth (%) Projections by Product Type, 2024 to 2034
Figure 15: Global Market Value (US$ Million) Analysis by Raw Material, 2019 to 2034
Figure 16: Global Market Volume (Unit Pack) Analysis by Raw Material, 2019 to 2034
Figure 17: Global Market Value Share (%) and BPS Analysis by Raw Material, 2024 to 2034
Figure 18: Global Market Y-o-Y Growth (%) Projections by Raw Material, 2024 to 2034
Figure 19: Global Market Value (US$ Million) Analysis by Capsule Size, 2019 to 2034
Figure 20: Global Market Volume (Unit Pack) Analysis by Capsule Size, 2019 to 2034
Figure 21: Global Market Value Share (%) and BPS Analysis by Capsule Size, 2024 to 2034
Figure 22: Global Market Y-o-Y Growth (%) Projections by Capsule Size, 2024 to 2034
Figure 23: Global Market Value (US$ Million) Analysis by Route of Administration, 2019 to 2034
Figure 24: Global Market Volume (Unit Pack) Analysis by Route of Administration, 2019 to 2034
Figure 25: Global Market Value Share (%) and BPS Analysis by Route of Administration, 2024 to 2034
Figure 26: Global Market Y-o-Y Growth (%) Projections by Route of Administration, 2024 to 2034
Figure 27: Global Market Value (US$ Million) Analysis by End User, 2019 to 2034
Figure 28: Global Market Volume (Unit Pack) Analysis by End User, 2019 to 2034
Figure 29: Global Market Value Share (%) and BPS Analysis by End User, 2024 to 2034
Figure 30: Global Market Y-o-Y Growth (%) Projections by End User, 2024 to 2034
Figure 31: Global Market Attractiveness by Product Type, 2024 to 2034
Figure 32: Global Market Attractiveness by Raw Material, 2024 to 2034
Figure 33: Global Market Attractiveness by Capsule Size, 2024 to 2034
Figure 34: Global Market Attractiveness by Route of Administration, 2024 to 2034
Figure 35: Global Market Attractiveness by End User, 2024 to 2034
Figure 36: Global Market Attractiveness by Region, 2024 to 2034
Figure 37: North America Market Value (US$ Million) by Product Type, 2024 to 2034
Figure 38: North America Market Value (US$ Million) by Raw Material, 2024 to 2034
Figure 39: North America Market Value (US$ Million) by Capsule Size, 2024 to 2034
Figure 40: North America Market Value (US$ Million) by Route of Administration, 2024 to 2034
Figure 41: North America Market Value (US$ Million) by End User, 2024 to 2034
Figure 42: North America Market Value (US$ Million) by Country, 2024 to 2034
Figure 43: North America Market Value (US$ Million) Analysis by Country, 2019 to 2034
Figure 44: North America Market Volume (Unit Pack) Analysis by Country, 2019 to 2034
Figure 45: North America Market Value Share (%) and BPS Analysis by Country, 2024 to 2034
Figure 46: North America Market Y-o-Y Growth (%) Projections by Country, 2024 to 2034
Figure 47: North America Market Value (US$ Million) Analysis by Product Type, 2019 to 2034
Figure 48: North America Market Volume (Unit Pack) Analysis by Product Type, 2019 to 2034
Figure 49: North America Market Value Share (%) and BPS Analysis by Product Type, 2024 to 2034
Figure 50: North America Market Y-o-Y Growth (%) Projections by Product Type, 2024 to 2034
Figure 51: North America Market Value (US$ Million) Analysis by Raw Material, 2019 to 2034
Figure 52: North America Market Volume (Unit Pack) Analysis by Raw Material, 2019 to 2034
Figure 53: North America Market Value Share (%) and BPS Analysis by Raw Material, 2024 to 2034
Figure 54: North America Market Y-o-Y Growth (%) Projections by Raw Material, 2024 to 2034
Figure 55: North America Market Value (US$ Million) Analysis by Capsule Size, 2019 to 2034
Figure 56: North America Market Volume (Unit Pack) Analysis by Capsule Size, 2019 to 2034
Figure 57: North America Market Value Share (%) and BPS Analysis by Capsule Size, 2024 to 2034
Figure 58: North America Market Y-o-Y Growth (%) Projections by Capsule Size, 2024 to 2034
Figure 59: North America Market Value (US$ Million) Analysis by Route of Administration, 2019 to 2034
Figure 60: North America Market Volume (Unit Pack) Analysis by Route of Administration, 2019 to 2034
Figure 61: North America Market Value Share (%) and BPS Analysis by Route of Administration, 2024 to 2034
Figure 62: North America Market Y-o-Y Growth (%) Projections by Route of Administration, 2024 to 2034
Figure 63: North America Market Value (US$ Million) Analysis by End User, 2019 to 2034
Figure 64: North America Market Volume (Unit Pack) Analysis by End User, 2019 to 2034
Figure 65: North America Market Value Share (%) and BPS Analysis by End User, 2024 to 2034
Figure 66: North America Market Y-o-Y Growth (%) Projections by End User, 2024 to 2034
Figure 67: North America Market Attractiveness by Product Type, 2024 to 2034
Figure 68: North America Market Attractiveness by Raw Material, 2024 to 2034
Figure 69: North America Market Attractiveness by Capsule Size, 2024 to 2034
Figure 70: North America Market Attractiveness by Route of Administration, 2024 to 2034
Figure 71: North America Market Attractiveness by End User, 2024 to 2034
Figure 72: North America Market Attractiveness by Country, 2024 to 2034
Figure 73: Latin America Market Value (US$ Million) by Product Type, 2024 to 2034
Figure 74: Latin America Market Value (US$ Million) by Raw Material, 2024 to 2034
Figure 75: Latin America Market Value (US$ Million) by Capsule Size, 2024 to 2034
Figure 76: Latin America Market Value (US$ Million) by Route of Administration, 2024 to 2034
Figure 77: Latin America Market Value (US$ Million) by End User, 2024 to 2034
Figure 78: Latin America Market Value (US$ Million) by Country, 2024 to 2034
Figure 79: Latin America Market Value (US$ Million) Analysis by Country, 2019 to 2034
Figure 80: Latin America Market Volume (Unit Pack) Analysis by Country, 2019 to 2034
Figure 81: Latin America Market Value Share (%) and BPS Analysis by Country, 2024 to 2034
Figure 82: Latin America Market Y-o-Y Growth (%) Projections by Country, 2024 to 2034
Figure 83: Latin America Market Value (US$ Million) Analysis by Product Type, 2019 to 2034
Figure 84: Latin America Market Volume (Unit Pack) Analysis by Product Type, 2019 to 2034
Figure 85: Latin America Market Value Share (%) and BPS Analysis by Product Type, 2024 to 2034
Figure 86: Latin America Market Y-o-Y Growth (%) Projections by Product Type, 2024 to 2034
Figure 87: Latin America Market Value (US$ Million) Analysis by Raw Material, 2019 to 2034
Figure 88: Latin America Market Volume (Unit Pack) Analysis by Raw Material, 2019 to 2034
Figure 89: Latin America Market Value Share (%) and BPS Analysis by Raw Material, 2024 to 2034
Figure 90: Latin America Market Y-o-Y Growth (%) Projections by Raw Material, 2024 to 2034
Figure 91: Latin America Market Value (US$ Million) Analysis by Capsule Size, 2019 to 2034
Figure 92: Latin America Market Volume (Unit Pack) Analysis by Capsule Size, 2019 to 2034
Figure 93: Latin America Market Value Share (%) and BPS Analysis by Capsule Size, 2024 to 2034
Figure 94: Latin America Market Y-o-Y Growth (%) Projections by Capsule Size, 2024 to 2034
Figure 95: Latin America Market Value (US$ Million) Analysis by Route of Administration, 2019 to 2034
Figure 96: Latin America Market Volume (Unit Pack) Analysis by Route of Administration, 2019 to 2034
Figure 97: Latin America Market Value Share (%) and BPS Analysis by Route of Administration, 2024 to 2034
Figure 98: Latin America Market Y-o-Y Growth (%) Projections by Route of Administration, 2024 to 2034
Figure 99: Latin America Market Value (US$ Million) Analysis by End User, 2019 to 2034
Figure 100: Latin America Market Volume (Unit Pack) Analysis by End User, 2019 to 2034
Figure 101: Latin America Market Value Share (%) and BPS Analysis by End User, 2024 to 2034
Figure 102: Latin America Market Y-o-Y Growth (%) Projections by End User, 2024 to 2034
Figure 103: Latin America Market Attractiveness by Product Type, 2024 to 2034
Figure 104: Latin America Market Attractiveness by Raw Material, 2024 to 2034
Figure 105: Latin America Market Attractiveness by Capsule Size, 2024 to 2034
Figure 106: Latin America Market Attractiveness by Route of Administration, 2024 to 2034
Figure 107: Latin America Market Attractiveness by End User, 2024 to 2034
Figure 108: Latin America Market Attractiveness by Country, 2024 to 2034
Figure 109: Western Europe Market Value (US$ Million) by Product Type, 2024 to 2034
Figure 110: Western Europe Market Value (US$ Million) by Raw Material, 2024 to 2034
Figure 111: Western Europe Market Value (US$ Million) by Capsule Size, 2024 to 2034
Figure 112: Western Europe Market Value (US$ Million) by Route of Administration, 2024 to 2034
Figure 113: Western Europe Market Value (US$ Million) by End User, 2024 to 2034
Figure 114: Western Europe Market Value (US$ Million) by Country, 2024 to 2034
Figure 115: Western Europe Market Value (US$ Million) Analysis by Country, 2019 to 2034
Figure 116: Western Europe Market Volume (Unit Pack) Analysis by Country, 2019 to 2034
Figure 117: Western Europe Market Value Share (%) and BPS Analysis by Country, 2024 to 2034
Figure 118: Western Europe Market Y-o-Y Growth (%) Projections by Country, 2024 to 2034
Figure 119: Western Europe Market Value (US$ Million) Analysis by Product Type, 2019 to 2034
Figure 120: Western Europe Market Volume (Unit Pack) Analysis by Product Type, 2019 to 2034
Figure 121: Western Europe Market Value Share (%) and BPS Analysis by Product Type, 2024 to 2034
Figure 122: Western Europe Market Y-o-Y Growth (%) Projections by Product Type, 2024 to 2034
Figure 123: Western Europe Market Value (US$ Million) Analysis by Raw Material, 2019 to 2034
Figure 124: Western Europe Market Volume (Unit Pack) Analysis by Raw Material, 2019 to 2034
Figure 125: Western Europe Market Value Share (%) and BPS Analysis by Raw Material, 2024 to 2034
Figure 126: Western Europe Market Y-o-Y Growth (%) Projections by Raw Material, 2024 to 2034
Figure 127: Western Europe Market Value (US$ Million) Analysis by Capsule Size, 2019 to 2034
Figure 128: Western Europe Market Volume (Unit Pack) Analysis by Capsule Size, 2019 to 2034
Figure 129: Western Europe Market Value Share (%) and BPS Analysis by Capsule Size, 2024 to 2034
Figure 130: Western Europe Market Y-o-Y Growth (%) Projections by Capsule Size, 2024 to 2034
Figure 131: Western Europe Market Value (US$ Million) Analysis by Route of Administration, 2019 to 2034
Figure 132: Western Europe Market Volume (Unit Pack) Analysis by Route of Administration, 2019 to 2034
Figure 133: Western Europe Market Value Share (%) and BPS Analysis by Route of Administration, 2024 to 2034
Figure 134: Western Europe Market Y-o-Y Growth (%) Projections by Route of Administration, 2024 to 2034
Figure 135: Western Europe Market Value (US$ Million) Analysis by End User, 2019 to 2034
Figure 136: Western Europe Market Volume (Unit Pack) Analysis by End User, 2019 to 2034
Figure 137: Western Europe Market Value Share (%) and BPS Analysis by End User, 2024 to 2034
Figure 138: Western Europe Market Y-o-Y Growth (%) Projections by End User, 2024 to 2034
Figure 139: Western Europe Market Attractiveness by Product Type, 2024 to 2034
Figure 140: Western Europe Market Attractiveness by Raw Material, 2024 to 2034
Figure 141: Western Europe Market Attractiveness by Capsule Size, 2024 to 2034
Figure 142: Western Europe Market Attractiveness by Route of Administration, 2024 to 2034
Figure 143: Western Europe Market Attractiveness by End User, 2024 to 2034
Figure 144: Western Europe Market Attractiveness by Country, 2024 to 2034
Figure 145: Eastern Europe Market Value (US$ Million) by Product Type, 2024 to 2034
Figure 146: Eastern Europe Market Value (US$ Million) by Raw Material, 2024 to 2034
Figure 147: Eastern Europe Market Value (US$ Million) by Capsule Size, 2024 to 2034
Figure 148: Eastern Europe Market Value (US$ Million) by Route of Administration, 2024 to 2034
Figure 149: Eastern Europe Market Value (US$ Million) by End User, 2024 to 2034
Figure 150: Eastern Europe Market Value (US$ Million) by Country, 2024 to 2034
Figure 151: Eastern Europe Market Value (US$ Million) Analysis by Country, 2019 to 2034
Figure 152: Eastern Europe Market Volume (Unit Pack) Analysis by Country, 2019 to 2034
Figure 153: Eastern Europe Market Value Share (%) and BPS Analysis by Country, 2024 to 2034
Figure 154: Eastern Europe Market Y-o-Y Growth (%) Projections by Country, 2024 to 2034
Figure 155: Eastern Europe Market Value (US$ Million) Analysis by Product Type, 2019 to 2034
Figure 156: Eastern Europe Market Volume (Unit Pack) Analysis by Product Type, 2019 to 2034
Figure 157: Eastern Europe Market Value Share (%) and BPS Analysis by Product Type, 2024 to 2034
Figure 158: Eastern Europe Market Y-o-Y Growth (%) Projections by Product Type, 2024 to 2034
Figure 159: Eastern Europe Market Value (US$ Million) Analysis by Raw Material, 2019 to 2034
Figure 160: Eastern Europe Market Volume (Unit Pack) Analysis by Raw Material, 2019 to 2034
Figure 161: Eastern Europe Market Value Share (%) and BPS Analysis by Raw Material, 2024 to 2034
Figure 162: Eastern Europe Market Y-o-Y Growth (%) Projections by Raw Material, 2024 to 2034
Figure 163: Eastern Europe Market Value (US$ Million) Analysis by Capsule Size, 2019 to 2034
Figure 164: Eastern Europe Market Volume (Unit Pack) Analysis by Capsule Size, 2019 to 2034
Figure 165: Eastern Europe Market Value Share (%) and BPS Analysis by Capsule Size, 2024 to 2034
Figure 166: Eastern Europe Market Y-o-Y Growth (%) Projections by Capsule Size, 2024 to 2034
Figure 167: Eastern Europe Market Value (US$ Million) Analysis by Route of Administration, 2019 to 2034
Figure 168: Eastern Europe Market Volume (Unit Pack) Analysis by Route of Administration, 2019 to 2034
Figure 169: Eastern Europe Market Value Share (%) and BPS Analysis by Route of Administration, 2024 to 2034
Figure 170: Eastern Europe Market Y-o-Y Growth (%) Projections by Route of Administration, 2024 to 2034
Figure 171: Eastern Europe Market Value (US$ Million) Analysis by End User, 2019 to 2034
Figure 172: Eastern Europe Market Volume (Unit Pack) Analysis by End User, 2019 to 2034
Figure 173: Eastern Europe Market Value Share (%) and BPS Analysis by End User, 2024 to 2034
Figure 174: Eastern Europe Market Y-o-Y Growth (%) Projections by End User, 2024 to 2034
Figure 175: Eastern Europe Market Attractiveness by Product Type, 2024 to 2034
Figure 176: Eastern Europe Market Attractiveness by Raw Material, 2024 to 2034
Figure 177: Eastern Europe Market Attractiveness by Capsule Size, 2024 to 2034
Figure 178: Eastern Europe Market Attractiveness by Route of Administration, 2024 to 2034
Figure 179: Eastern Europe Market Attractiveness by End User, 2024 to 2034
Figure 180: Eastern Europe Market Attractiveness by Country, 2024 to 2034
Figure 181: South Asia and Pacific Market Value (US$ Million) by Product Type, 2024 to 2034
Figure 182: South Asia and Pacific Market Value (US$ Million) by Raw Material, 2024 to 2034
Figure 183: South Asia and Pacific Market Value (US$ Million) by Capsule Size, 2024 to 2034
Figure 184: South Asia and Pacific Market Value (US$ Million) by Route of Administration, 2024 to 2034
Figure 185: South Asia and Pacific Market Value (US$ Million) by End User, 2024 to 2034
Figure 186: South Asia and Pacific Market Value (US$ Million) by Country, 2024 to 2034
Figure 187: South Asia and Pacific Market Value (US$ Million) Analysis by Country, 2019 to 2034
Figure 188: South Asia and Pacific Market Volume (Unit Pack) Analysis by Country, 2019 to 2034
Figure 189: South Asia and Pacific Market Value Share (%) and BPS Analysis by Country, 2024 to 2034
Figure 190: South Asia and Pacific Market Y-o-Y Growth (%) Projections by Country, 2024 to 2034
Figure 191: South Asia and Pacific Market Value (US$ Million) Analysis by Product Type, 2019 to 2034
Figure 192: South Asia and Pacific Market Volume (Unit Pack) Analysis by Product Type, 2019 to 2034
Figure 193: South Asia and Pacific Market Value Share (%) and BPS Analysis by Product Type, 2024 to 2034
Figure 194: South Asia and Pacific Market Y-o-Y Growth (%) Projections by Product Type, 2024 to 2034
Figure 195: South Asia and Pacific Market Value (US$ Million) Analysis by Raw Material, 2019 to 2034
Figure 196: South Asia and Pacific Market Volume (Unit Pack) Analysis by Raw Material, 2019 to 2034
Figure 197: South Asia and Pacific Market Value Share (%) and BPS Analysis by Raw Material, 2024 to 2034
Figure 198: South Asia and Pacific Market Y-o-Y Growth (%) Projections by Raw Material, 2024 to 2034
Figure 199: South Asia and Pacific Market Value (US$ Million) Analysis by Capsule Size, 2019 to 2034
Figure 200: South Asia and Pacific Market Volume (Unit Pack) Analysis by Capsule Size, 2019 to 2034
Figure 201: South Asia and Pacific Market Value Share (%) and BPS Analysis by Capsule Size, 2024 to 2034
Figure 202: South Asia and Pacific Market Y-o-Y Growth (%) Projections by Capsule Size, 2024 to 2034
Figure 203: South Asia and Pacific Market Value (US$ Million) Analysis by Route of Administration, 2019 to 2034
Figure 204: South Asia and Pacific Market Volume (Unit Pack) Analysis by Route of Administration, 2019 to 2034
Figure 205: South Asia and Pacific Market Value Share (%) and BPS Analysis by Route of Administration, 2024 to 2034
Figure 206: South Asia and Pacific Market Y-o-Y Growth (%) Projections by Route of Administration, 2024 to 2034
Figure 207: South Asia and Pacific Market Value (US$ Million) Analysis by End User, 2019 to 2034
Figure 208: South Asia and Pacific Market Volume (Unit Pack) Analysis by End User, 2019 to 2034
Figure 209: South Asia and Pacific Market Value Share (%) and BPS Analysis by End User, 2024 to 2034
Figure 210: South Asia and Pacific Market Y-o-Y Growth (%) Projections by End User, 2024 to 2034
Figure 211: South Asia and Pacific Market Attractiveness by Product Type, 2024 to 2034
Figure 212: South Asia and Pacific Market Attractiveness by Raw Material, 2024 to 2034
Figure 213: South Asia and Pacific Market Attractiveness by Capsule Size, 2024 to 2034
Figure 214: South Asia and Pacific Market Attractiveness by Route of Administration, 2024 to 2034
Figure 215: South Asia and Pacific Market Attractiveness by End User, 2024 to 2034
Figure 216: South Asia and Pacific Market Attractiveness by Country, 2024 to 2034
Figure 217: East Asia Market Value (US$ Million) by Product Type, 2024 to 2034
Figure 218: East Asia Market Value (US$ Million) by Raw Material, 2024 to 2034
Figure 219: East Asia Market Value (US$ Million) by Capsule Size, 2024 to 2034
Figure 220: East Asia Market Value (US$ Million) by Route of Administration, 2024 to 2034
Figure 221: East Asia Market Value (US$ Million) by End User, 2024 to 2034
Figure 222: East Asia Market Value (US$ Million) by Country, 2024 to 2034
Figure 223: East Asia Market Value (US$ Million) Analysis by Country, 2019 to 2034
Figure 224: East Asia Market Volume (Unit Pack) Analysis by Country, 2019 to 2034
Figure 225: East Asia Market Value Share (%) and BPS Analysis by Country, 2024 to 2034
Figure 226: East Asia Market Y-o-Y Growth (%) Projections by Country, 2024 to 2034
Figure 227: East Asia Market Value (US$ Million) Analysis by Product Type, 2019 to 2034
Figure 228: East Asia Market Volume (Unit Pack) Analysis by Product Type, 2019 to 2034
Figure 229: East Asia Market Value Share (%) and BPS Analysis by Product Type, 2024 to 2034
Figure 230: East Asia Market Y-o-Y Growth (%) Projections by Product Type, 2024 to 2034
Figure 231: East Asia Market Value (US$ Million) Analysis by Raw Material, 2019 to 2034
Figure 232: East Asia Market Volume (Unit Pack) Analysis by Raw Material, 2019 to 2034
Figure 233: East Asia Market Value Share (%) and BPS Analysis by Raw Material, 2024 to 2034
Figure 234: East Asia Market Y-o-Y Growth (%) Projections by Raw Material, 2024 to 2034
Figure 235: East Asia Market Value (US$ Million) Analysis by Capsule Size, 2019 to 2034
Figure 236: East Asia Market Volume (Unit Pack) Analysis by Capsule Size, 2019 to 2034
Figure 237: East Asia Market Value Share (%) and BPS Analysis by Capsule Size, 2024 to 2034
Figure 238: East Asia Market Y-o-Y Growth (%) Projections by Capsule Size, 2024 to 2034
Figure 239: East Asia Market Value (US$ Million) Analysis by Route of Administration, 2019 to 2034
Figure 240: East Asia Market Volume (Unit Pack) Analysis by Route of Administration, 2019 to 2034
Figure 241: East Asia Market Value Share (%) and BPS Analysis by Route of Administration, 2024 to 2034
Figure 242: East Asia Market Y-o-Y Growth (%) Projections by Route of Administration, 2024 to 2034
Figure 243: East Asia Market Value (US$ Million) Analysis by End User, 2019 to 2034
Figure 244: East Asia Market Volume (Unit Pack) Analysis by End User, 2019 to 2034
Figure 245: East Asia Market Value Share (%) and BPS Analysis by End User, 2024 to 2034
Figure 246: East Asia Market Y-o-Y Growth (%) Projections by End User, 2024 to 2034
Figure 247: East Asia Market Attractiveness by Product Type, 2024 to 2034
Figure 248: East Asia Market Attractiveness by Raw Material, 2024 to 2034
Figure 249: East Asia Market Attractiveness by Capsule Size, 2024 to 2034
Figure 250: East Asia Market Attractiveness by Route of Administration, 2024 to 2034
Figure 251: East Asia Market Attractiveness by End User, 2024 to 2034
Figure 252: East Asia Market Attractiveness by Country, 2024 to 2034
Figure 253: Middle East and Africa Market Value (US$ Million) by Product Type, 2024 to 2034
Figure 254: Middle East and Africa Market Value (US$ Million) by Raw Material, 2024 to 2034
Figure 255: Middle East and Africa Market Value (US$ Million) by Capsule Size, 2024 to 2034
Figure 256: Middle East and Africa Market Value (US$ Million) by Route of Administration, 2024 to 2034
Figure 257: Middle East and Africa Market Value (US$ Million) by End User, 2024 to 2034
Figure 258: Middle East and Africa Market Value (US$ Million) by Country, 2024 to 2034
Figure 259: Middle East and Africa Market Value (US$ Million) Analysis by Country, 2019 to 2034
Figure 260: Middle East and Africa Market Volume (Unit Pack) Analysis by Country, 2019 to 2034
Figure 261: Middle East and Africa Market Value Share (%) and BPS Analysis by Country, 2024 to 2034
Figure 262: Middle East and Africa Market Y-o-Y Growth (%) Projections by Country, 2024 to 2034
Figure 263: Middle East and Africa Market Value (US$ Million) Analysis by Product Type, 2019 to 2034
Figure 264: Middle East and Africa Market Volume (Unit Pack) Analysis by Product Type, 2019 to 2034
Figure 265: Middle East and Africa Market Value Share (%) and BPS Analysis by Product Type, 2024 to 2034
Figure 266: Middle East and Africa Market Y-o-Y Growth (%) Projections by Product Type, 2024 to 2034
Figure 267: Middle East and Africa Market Value (US$ Million) Analysis by Raw Material, 2019 to 2034
Figure 268: Middle East and Africa Market Volume (Unit Pack) Analysis by Raw Material, 2019 to 2034
Figure 269: Middle East and Africa Market Value Share (%) and BPS Analysis by Raw Material, 2024 to 2034
Figure 270: Middle East and Africa Market Y-o-Y Growth (%) Projections by Raw Material, 2024 to 2034
Figure 271: Middle East and Africa Market Value (US$ Million) Analysis by Capsule Size, 2019 to 2034
Figure 272: Middle East and Africa Market Volume (Unit Pack) Analysis by Capsule Size, 2019 to 2034
Figure 273: Middle East and Africa Market Value Share (%) and BPS Analysis by Capsule Size, 2024 to 2034
Figure 274: Middle East and Africa Market Y-o-Y Growth (%) Projections by Capsule Size, 2024 to 2034
Figure 275: Middle East and Africa Market Value (US$ Million) Analysis by Route of Administration, 2019 to 2034
Figure 276: Middle East and Africa Market Volume (Unit Pack) Analysis by Route of Administration, 2019 to 2034
Figure 277: Middle East and Africa Market Value Share (%) and BPS Analysis by Route of Administration, 2024 to 2034
Figure 278: Middle East and Africa Market Y-o-Y Growth (%) Projections by Route of Administration, 2024 to 2034
Figure 279: Middle East and Africa Market Value (US$ Million) Analysis by End User, 2019 to 2034
Figure 280: Middle East and Africa Market Volume (Unit Pack) Analysis by End User, 2019 to 2034
Figure 281: Middle East and Africa Market Value Share (%) and BPS Analysis by End User, 2024 to 2034
Figure 282: Middle East and Africa Market Y-o-Y Growth (%) Projections by End User, 2024 to 2034
Figure 283: Middle East and Africa Market Attractiveness by Product Type, 2024 to 2034
Figure 284: Middle East and Africa Market Attractiveness by Raw Material, 2024 to 2034
Figure 285: Middle East and Africa Market Attractiveness by Capsule Size, 2024 to 2034
Figure 286: Middle East and Africa Market Attractiveness by Route of Administration, 2024 to 2034
Figure 287: Middle East and Africa Market Attractiveness by End User, 2024 to 2034
Figure 288: Middle East and Africa Market Attractiveness by Country, 2024 to 2034
The global empty capsule market is projected to reach USD 6.89 billion by 2035, growing from USD 3.19 billion in 2025, at a CAGR of 8.0% over the forecast period.
Gelatin-based capsules are expected to dominate the market with a 60.2% share in 2025, favored for their cost-efficiency, machinability, and regulatory familiarity in pharmaceutical applications.
Type-B gelatin leads the raw material segment with a 30.2% market share in 2025, driven by cost-effectiveness, elasticity, and broad adoption in mass-market drug and supplement formulations.
Size “0” capsules are projected to grow at a CAGR of 3.57%, due to their optimal dosage capacity and popularity in adult health supplements and pharmaceutical applications globally.
Oral administration remains the dominant route, forecasted to grow at a CAGR of 4.3% from 2025 to 2035, supported by high patient compliance and broad application in both drug and nutraceutical delivery.
Explore Pharmaceuticals Insights
Thank you!
You will receive an email from our Business Development Manager. Please be sure to check your SPAM/JUNK folder too.