The Endocrine Testing Market is estimated to be valued at USD 3.2 billion in 2025 and is projected to reach USD 7.3 billion by 2035, registering a compound annual growth rate (CAGR) of 8.5% over the forecast period.
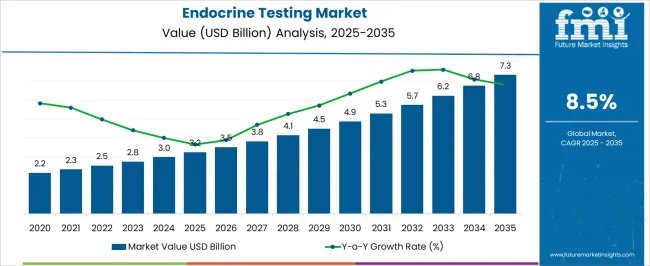
| Metric | Value |
|---|---|
| Endocrine Testing Market Estimated Value in (2025 E) | USD 3.2 billion |
| Endocrine Testing Market Forecast Value in (2035 F) | USD 7.3 billion |
| Forecast CAGR (2025 to 2035) | 8.5% |
The endocrine testing market is experiencing sustained growth due to increasing prevalence of hormonal disorders, expanding awareness around early diagnosis, and advancements in diagnostic precision. Rising incidences of thyroid dysfunction, infertility, adrenal imbalances, and age related hormonal changes have intensified demand for regular hormone profiling across all age groups.
Healthcare systems are placing greater emphasis on preventive health monitoring, while patients are increasingly opting for diagnostic screening as part of wellness routines. Continuous improvements in assay sensitivity, faster turnaround times, and greater accessibility to hormone panels are reinforcing the importance of endocrine diagnostics.
The market outlook remains strong as integration of automated platforms, personalized medicine, and centralized laboratory operations continues to drive adoption across both developed and emerging healthcare settings.
The market is segmented by Test Type, Technology, and End-user and region. By Test Type, the market is divided into Estradiol (E2) Test, Follicle Stimulating Hormone (FSH) Test, Human Chorionic Gonadotropin (hCG) Hormone Test, Luteinizing Hormone (LH) Test, Dehydroepiandrosterone Sulfate (DHEAS) Test, Progesterone Test, Testosterone Test, Thyroid Stimulating Hormone (TSH) Test, Prolactin Test, Cortisol Test, Insulin Test, and Others. In terms of Technology, the market is classified into Mass Spectroscopy, Immunoassay, Chromatography, and Nucleic Acid Based. Based on End-user, the market is segmented into Hospitals, Commercial Laboratories, Ambulatory Care Centers, and Others. Regionally, the market is classified into North America, Latin America, Western Europe, Eastern Europe, Balkan & Baltic Countries, Russia & Belarus, Central Asia, East Asia, South Asia & Pacific, and the Middle East & Africa.
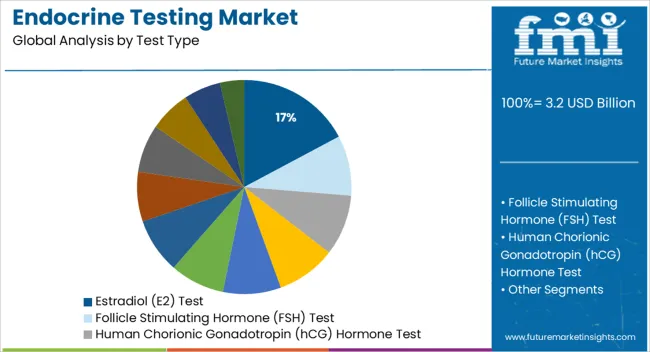
The estradiol test segment is anticipated to account for 17.20% of total market revenue by 2025 under the test type category, establishing itself as a key contributor. This is primarily due to the rising focus on women’s health, reproductive health monitoring, and hormone replacement therapy assessments.
Estradiol testing plays a critical role in evaluating ovarian function, diagnosing menstrual irregularities, and managing fertility treatments. Increased attention to hormonal balance during menopause and in endocrine disorders such as polycystic ovary syndrome has further boosted testing volumes.
The role of estradiol in managing bone health and cardiovascular risk in postmenopausal populations has also broadened the test's clinical utility. The growing emphasis on precision hormone diagnostics in personalized medicine is strengthening demand for estradiol testing across a variety of healthcare scenarios.
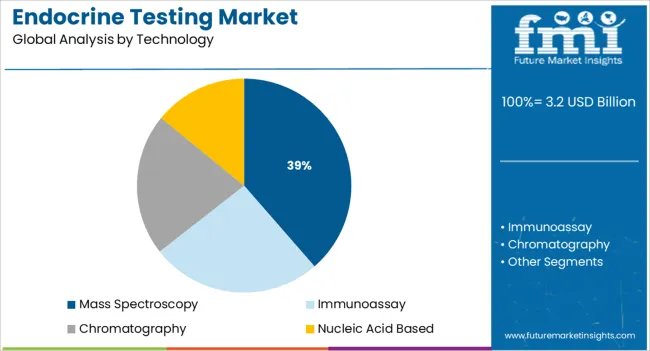
Mass spectroscopy is projected to contribute 38.60% of market revenue by 2025 under the technology category, reflecting its expanding use in complex hormone analysis. This dominance stems from the technology’s ability to deliver high specificity and sensitivity in low concentration hormone detection.
It is particularly valuable for quantifying multiple hormones simultaneously and detecting subtle biochemical variations critical for accurate diagnosis. The reduced likelihood of cross reactivity and superior reproducibility over traditional immunoassay methods has made mass spectroscopy a preferred option in high complexity testing environments.
Laboratories and diagnostic centers are increasingly adopting this technology to meet regulatory standards and ensure reliable hormone quantification. The shift toward comprehensive hormonal profiling in endocrine testing continues to reinforce the leadership of mass spectroscopy in this category.
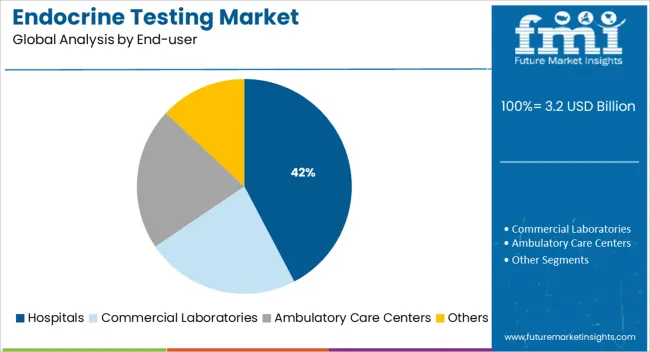
The hospital segment is expected to account for 42.30% of total market revenue by 2025 under the end user category, marking it as the primary contributor. This prominence is driven by the availability of advanced diagnostic infrastructure, skilled personnel, and a wide range of testing capabilities in hospital laboratories.
Hospitals often serve as the first point of care for patients presenting symptoms related to hormonal imbalance, thereby making them central to diagnostic workflows. The increasing rate of inpatient admissions related to endocrine disorders, reproductive treatments, and chronic metabolic conditions has also contributed to consistent testing volumes.
In addition, hospitals offer integrated care pathways, allowing immediate follow up and specialist consultations post testing, which enhances their role in endocrine diagnostics. The comprehensive care model adopted by hospitals continues to support their leading position in this market.
According to market research and competitive intelligence provider FMI, the endocrine testing industry grew at a CAGR of 8.3% from 2020 to 2024. Medical professionals use endocrine testing to diagnose endocrine disorders and treat the condition or disease accordingly. Innovating therapies, technologies, and advancing diagnostic methods will contribute to the market's growth.
New policies are being briefed for testing methods to detect endocrine disruptors. For example, EURION, a cluster of emerging ED research projects, published the research note. As part of EURION, eight research projects are collaborating to develop methods and determine test strategies for understudied disorders caused by EDs, such as metabolic, brain, thyroid, and reproductive problems. More than 70 research groups have partnered with the EC Horizon 2024-funded cluster since its launch in 2020, bringing over €50 million of funding and more than 50 years of experience together.
With the world returning to normalcy after the pandemic, self-test pregnancy kits are only set to become more popular. Moreover, advancements are being made in the development of endocrine testing devices that measure the level of hormones produced by the human body's endocrine glands.
Increased Defense Spending to Bolster Demand for Endocrine Testing
Medical and clinical diagnostic research and development (R&D), along with new technologies that are intended to improve patient outcomes, are among the factors driving the growth of endocrine testing worldwide. As consumers demand point-of-care facilities and home-based testing kits for a wide range of health-related issues, the market has grown substantially in the last few years.
As the prevalence of endocrine disorders continues to rise along with advances in diagnostic methods, the market will grow at a significant rate. In addition, the trend of an aging population worldwide, coupled with increased awareness about the importance of early diagnosis and prevention, will be expected to lead to the growth of this market. Tests to diagnose disorders like obesity, diabetes, and thyroid disease are carried out by measuring the level of hormones secreted by the endocrine glands.
WHO estimates that there are 3.2 million adults, 340 million adolescents, and 39 million children worldwide who are dealing with obesity, and this number is growing at an alarming rate. Overweight or obesity is predicted to affect the health of 167 million adults and children by 2025. Endocrine testing of thyroid function is more likely to be adopted as a result, resulting in further market growth for the product.
Technological advancement to drive the Endocrine Testing market growth during the forecast period.
Increasing the adoption of biosensors and digital test kits in pregnancy test kits and fertility test kits is expected to encourage the growth of the endocrine testing market.
During the testing, imbalances in hormone concentrations can be detected which can lead to chronic diseases. It is highly recommended to conduct periodiC testing, particularly in elderly patients, in order to minimize the risk of developing complications or aggravating the disease.
Investing in advanced endocrine testing techniques and diagnostic tests for the endocrine system will rise due to immunoassays remaining the most commonly used method to evaluate hormonal disorders. Also, investing in the integration of advanced endocrine testing techniques and diagnostic tests for endocrine systems will rise.
Stringent Regulations and the High Cost of Technologies May Impede the Growth of the Market
The high costs of developing and commercializing endocrine tests, including analyses of several hormone-stimulated cellular mechanisms, pose a challenge to manufacturers. Thus, it is inevitable that monitoring and diagnosing the secretion levels of hormones in the human body will result in a high cost to the patient.
However, because of the lack of qualified and skilled professionals in this field, the market growth is restricted due to narrow diagnostic capabilities. Endocrine function testing requires skilled as well as technical expertise due to sample handling and preparation stages. In the absence of a technical force that can perform endocrine testing with precision, the quality of the test will eventually be compromised, resulting in poor patient outcomes.
Endocrine testing solutions and methodologies are developed and introduced successfully because of improved access to sophisticated technological platforms. Government regulations restricting the development of diagnostic tests for endocrine systems and approval before they can be sold would raise costs, limiting the market growth.
Because of this limitation, it deprived patients of being able to access advanced diagnostic procedures in order to receive quality diagnostic measures and decrease their chances of improving their quality of life. Consequently, high costs associated with testing technology could hamper the growth of the endocrine testing market.
Research & Development Investments and Diagnostic Advancements in the Region Provide Growth Opportunities
As the top market for endocrine testing, North America is expected to show a CAGR of 47.2% through the forecast period. A significant increase in Research and Development investments has encouraged the development of new products for endocrinology lab tests, which is expected to augment the growth of the North American endocrinology lab tests market in the coming years.
The adoption of new technologies and the continued reform of endocrine testing projects in numerous countries are expected to boost endocrine testing in the region over the forecast period.
Additionally, major manufacturers' Research and Development programs and technological advances in the USA and Canada resulted in major advancements.
A growing number of thyroid cases are being diagnosed globally throughout the world, and the rising prevalence of obesity is driving the global endocrine testing market. Approximately 43,800 new cases of thyroid cancer are expected to be detected in the United States in 2025 (11,860 in men and 31,940 in women) and there will be 2,230 thyroid cancer deaths (1,070 men and 1,160 women). Since thyroid cancer is common and causes many deaths in the United States, this will drive the market demand for thyroid testing in the United States.
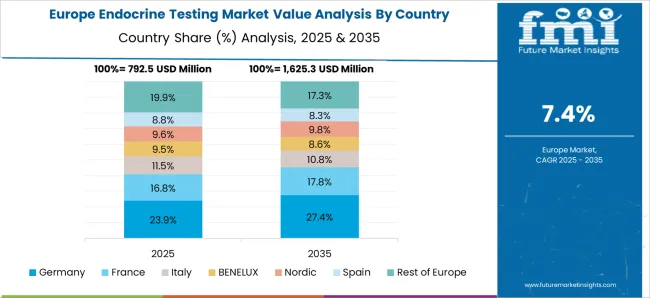
Governing Policies and Reimbursements in Europe to Boost the Market Growth.
In 2025, Europe is predicted to lead the endocrine testing market and will continue to do so throughout the forecast period. At present, the endocrine testing market in Europe represents 33.6% of the global market share of the endocrine testing market.
Several key factors contributing to the dominance of endocrine testing include the high prevalence of chronic endocrine disorders and reproductive health problems. The United Kingdom, Germany, France, and Russia are expected to increase the procurement of advanced technologies, thus boosting the market.
In the United Kingdom, the reimbursement scheme is the most progressive and facilitates the rapid adoption of novel testing technologies. This allows Europe to dominate the market owing to supportive government regulations. Key market players have continued to invest in infrastructure development initiatives that are predicted to fuel global demand for endocrine testing.
Future Growth Scope Will be Broadened by Growing Demand for Pregnancy Test Kits and Infrastructure Growth
Asia Pacific was the largest market for endocrine testing with a revenue share of 35.6% and is expected to be the largest market going forward. There are several countries that are making significant investments in home-based endocrine testing kits, including China, India, Japan, and South Korea. With the growing population base, the increasing prevalence of lifestyle-related diseases, and the development of hormonal stimulation drugs, the market is likely to continue to experience growth in the coming years.
Endocrine testing has grown in popularity with the increasing number of thyroid disorders and diabetes being diagnosed in older as well as younger generations, which has contributed to the market growth. Moreover, the government has also taken measures in the region to improve the health infrastructure and provide access to quality healthcare, which are both driving the market growth in this region.
The growth and upgrading of self-test pregnancy kits and fertility test kits in this region are expected to drive the growth of the endocrine testing market in this region. Furthermore, the growth of the market for digital pregnancy test kits will further contribute to the growth of the market in the future.
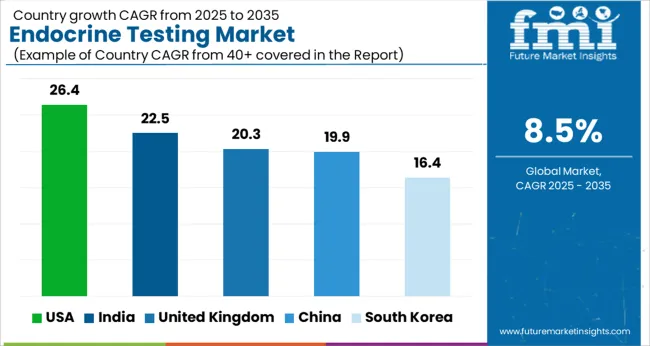
| Country | CAGR |
|---|---|
| USA | 26.4% |
| India | 22.5% |
| UK | 20.3% |
| China | 19.9 % |
| South Korea | 16.4 % |
Immunoassay Technology Segment Generates High Revenue in the Endocrine Testing market
Based on technology immunoassay segment is projected to account for a CAGR of 18.2% in 2035. The market is expected to grow due to the increasing efficacy of antibody tests which are expected to drive market growth in the near future.
Due to the fact that there are multiple instruments and analyzers that are used for testing in order to detect the test result, different types of immunoassay technologies are utilized for the test. Moreover, there are many key players that offer immunoassay-based test panels for endocrine function and reproductive function along with many other products that contribute to the largest revenue generation in this market.
Technological advancements have led to the development of novel hormone testing methods in recent years. Nucleic acid-based detection methods, mass spectroscopy, and chromatography are becoming more widely used for endocrine testing panels and providing accurate results in a shorter time frame. All these factors will further propel market growth for the immunoassay endocrine testing market.
The Hospital segment is expected to grow at a high CAGR during the forecast period
In 2025, the hospital segment accounted for the largest share of 53% and is expected to continue this trend over the forecast period. With increasing investments in healthcare infrastructure, particularly research activities, endocrine testing should see a positive impact globally.
At-home collection services and the availability of a variety of home-based test, panels are boosting the revenue generation of this segment. As a matter of fact, it is expected that hospitals will also experience the fastest growth in the following years.
As health consciousness increases among individuals and endocrine testing are carried out continuously to monitor existing diseases and control hereditary conditions, this is a risk factor that can be attributed to the rise in health consciousness. Moreover, the ability to provide reports to the hospital settings over digital platforms further contributes to the growth trajectory of these hospital settings.
How do New Entrants Contribute to the Endocrine Testing Business?
Startups are now entering the endocrine testing market, providing consumers with new products that meet their needs. Additionally, these innovative testing companies offer different kinds of endocrine testing equipment and methods, including the technologies that are used during the testing process. Several start-up companies are now focusing on the preparation of FDA-approved endocrine tests due to the popularity of FDA-approved products on the market.
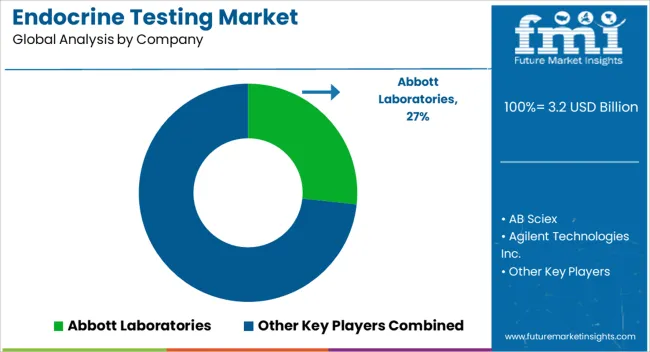
Through strategic partnerships, manufacturers can boost revenues and gain a greater share of the market by increasing production and meeting consumer demand. As a result of endocrine testing, the end user will benefit by taking advantage of new products and technologies. Expanding production capabilities can be achieved through strategic partnerships.
Key players in the global endocrine testing market include Abbott Laboratories, AB Sciex, Agilent Technologies Inc., bioMerieux SA, Bio-Rad Laboratories, DiaSorin S.p.A., F.Hoffmann-La Roche Ltd, Laboratory Corporation of America Holdings, Quest Diagnostics Incorporated, Ortho Clinical Diagnostics.
| Report Attribute | Details |
|---|---|
| Growth Rate (2025 to 2035) | 8.5% |
| Expected Market Value (2025) | USD 3.2 billion |
| Projected Forecast Value (2035) | USD 7.3 billion |
| Base Year for Estimation | 2024 |
| Historical Data | 2020 to 2024 |
| Forecast Period | 2025 to 2035 |
| Quantitative Units | Revenue in USD Million and CAGR from 2025 to 2035 |
| Report Coverage | Revenue Forecast, Volume Forecast, Company Ranking, Competitive Landscape, Growth Factors, Trends, and Pricing Analysis |
| Segments Covered | Test Type, Technology, End User, Regions |
| Regions Covered | North America; Latin America; Europe; Asia Pacific; Middle East and Africa(MEA) |
| Key Countries Profiled | USA, Canada, Brazil, Mexico, Germany, United Kingdom, France, Spain, Italy, Malaysia, Thailand, India, Singapore, GCC Countries, South Africa, Israel |
| Key Companies Profiled | Abbott Laboratories; Agilent Technologies Inc.; Bio-Rad Laboratories Inc.; AB Sciex; bioMerieux SA; DiaSorin S.p.A.; F. Hoffmann-La Roche Ltd.; Laboratory Corporation of America Holdings; Quest Diagnostics Incorporated; Ortho Clinical Diagnostics |
| Customization | Available Upon Request |
The global endocrine testing market is estimated to be valued at USD 3.2 billion in 2025.
The market size for the endocrine testing market is projected to reach USD 7.3 billion by 2035.
The endocrine testing market is expected to grow at a 8.5% CAGR between 2025 and 2035.
The key product types in endocrine testing market are estradiol (e2) test, follicle stimulating hormone (fsh) test, human chorionic gonadotropin (hcg) hormone test, luteinizing hormone (lh) test, dehydroepiandrosterone sulfate (dheas) test, progesterone test, testosterone test, thyroid stimulating hormone (tsh) test, prolactin test, cortisol test, insulin test and others.
In terms of technology, mass spectroscopy segment to command 38.6% share in the endocrine testing market in 2025.


Full Research Suite comprises of:
Market outlook & trends analysis
Interviews & case studies
Strategic recommendations
Vendor profiles & capabilities analysis
5-year forecasts
8 regions and 60+ country-level data splits
Market segment data splits
12 months of continuous data updates
DELIVERED AS:
PDF EXCEL ONLINE
Endocrine Peptides Test Market Size and Share Forecast Outlook 2025 to 2035
Neuroendocrine Carcinoma Treatment Market Size and Share Forecast Outlook 2025 to 2035
Multiple Endocrine Neoplasia Market
Testing, Inspection & Certification Market Growth – Trends & Forecast 2025 to 2035
5G Testing Market Size and Share Forecast Outlook 2025 to 2035
AB Testing Software Market Size and Share Forecast Outlook 2025 to 2035
5G Testing Equipment Market Analysis - Size, Growth, and Forecast 2025 to 2035
Eye Testing Equipment Market Size and Share Forecast Outlook 2025 to 2035
HSV Testing Market Size and Share Forecast Outlook 2025 to 2035
IoT Testing Equipment Market Size and Share Forecast Outlook 2025 to 2035
HPV Testing and Pap Test Market Size and Share Forecast Outlook 2025 to 2035
GMO Testing Services Market Insights – Food Safety & Regulatory Compliance 2024 to 2034
GMP Testing Services Market
LTE Testing Equipment Market Growth – Trends & Forecast 2019-2027
Drug Testing Systems Market Size and Share Forecast Outlook 2025 to 2035
Sand Testing Equipments Market Size and Share Forecast Outlook 2025 to 2035
Tire Testing Machine Market Size and Share Forecast Outlook 2025 to 2035
Self-Testing Market Analysis - Size, Share, and Forecast 2025 to 2035
Food Testing Services Market Size, Growth, and Forecast for 2025–2035
Bend Testing Machine Market Growth - Trends & Forecast 2025 to 2035

Thank you!
You will receive an email from our Business Development Manager. Please be sure to check your SPAM/JUNK folder too.
Chat With
MaRIA