Reports

- Global Locations -

Headquarters

Future Market Insights, Inc.

Christiana Corporate, 200
Continental Drive, Suite 401,
Newark, Delaware - 19713,
United States

T: +1-845-579-5705

Americas

Future Market Insights, Inc.

616 Corporate Way, Suite 2-9018,
Valley Cottage, NY 10989, United States

T: +1-347-918-3531

MEA

Future Market Insights

1602-6 Jumeirah Bay X2 Tower, Plot No: JLT-PH2-X2A,
Jumeirah Lakes Towers, Dubai,
United Arab Emirates

Europe

Future Market Insights

3rd Floor, 207 Regent Street,
W1B 3HH London
United Kingdom

T: + 44 (0) 20 8123 9659
D: +44 (0) 20 3287 4268

Asia Pacific

Future Market Insights

IndiaLand Global Tech Park, Unit UG-1, Behind Grand HighStreet, Phase 1, Hinjawadi, MH, Pune – 411057, India

Endoscope Detergents and Disinfectants Market Outlook (2022 to 2032)

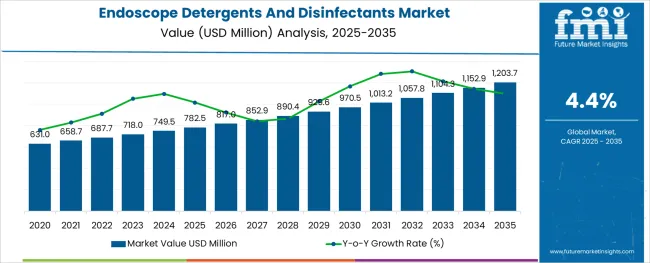
[300 Pages Report] The endoscope detergents and disinfectants market is likely to secure a CAGR of 4.4% during the forecast period. The market is projected to be valued at US$ 687.7 Million in 2022 and is likely to be valued at US$ 1,108.2 Million by 2032.

Report Attribute Details
Endoscope Detergents and Disinfectants Market Value (2022) US$ 687.7 Million
Endoscope Detergents and Disinfectants Market Anticipated Value (2032) US$ 1,108.2 Million
Endoscope Detergents and Disinfectants Projected Growth Rate (2032) 4.4%

The adoption of endoscope detergents and disinfectant chemicals has been widely rising owing to their usage for various medical devices like endoscopes in recent years. They are gaining rapid traction in the global forum, as these solutions are preventing the growth of harmful bacteria and viruses and reducing the chances of acquiring diseases in the medical industry.

The demand for endoscope detergents and disinfectants is expected to increase in the coming years, as they can kill almost all types of vegetative non-spore-forming bacteria, fungi, viruses, and mycobacterium (TB) that appears on surgery tools.

Endoscope detergent and disinfectants also help to clean automation and various mechanical tools. Additionally, detergents and disinfectants are used before every procedure to make the device significantly contamination free. Therefore, it is anticipated that the endoscope detergents and disinfectants market is likely to witness significant growth during the forecast period.

Don't pay for what you don't need

Customize your report by selecting specific countries or regions and save 30%!

Aspects Driving the Demand for Endoscope Detergents and Disinfectants

Several factors are fueling the expansion of the endoscope detergent and disinfectant market; they can be summarized as follows:

  • The key contributor to the global endoscope detergents and disinfectants market growth is the increasing caseload of indications requiring surgical procedures, which further necessitates the use of an endoscope. However, the increased use of flexible endoscopes also boosts the market size.
  • The government is taking initiatives to control and prevent the infections that are expected to propel the growth of the infection control supplies market.
  • The increasing number of specialty surgical centers and ambulatory surgical centers propels the growth of the endoscope cleaning products market.
  • Awareness regarding infectious diseases increases and enhances the demand for endoscope cleaning products globally during the forecast period.

Identification of Restraining Elements in the Endoscope Detergents and Disinfectants Market

Although the expert analysts at FMI have revealed growth-propelling factors in the prevailing endoscope and disinfectants market, some aspects are also identified to inhibit the growth of the market. They are:

  • The post-surgical adverse events and deaths associated with infected endoscopes have drastically impacted the market growth.
  • The endoscopes of Olympus Medical have been recalled on a large scale due to events of death, and the company had to pay for the legal settlements with patients.
  • Adequate cleaning, disinfection, and/or sterilization of endoscopes has been a challenge for hospital/clinical facilities despite the availability of recommended guidelines, which may impede the market growth.

The healthcare policies such as Medicaid and Medicare have kept the costs associated with Healthcare-associated Infections (HAIs), including SSIs, out of coverage. Hence, the patients have to pay it out of their pocket, which is a major factor restricting the growth of the market.

Sabyasachi Ghosh
Sabyasachi Ghosh

Principal Consultant

Talk to Analyst

Find your sweet spots for generating winning opportunities in this market.

Regional Insights

Performance of North America Endoscope Detergents and Disinfectants Market

North America is currently dominating the market and is projected to account for a total of 35.1% market share of endoscopes and disinfectants during the forecast period.

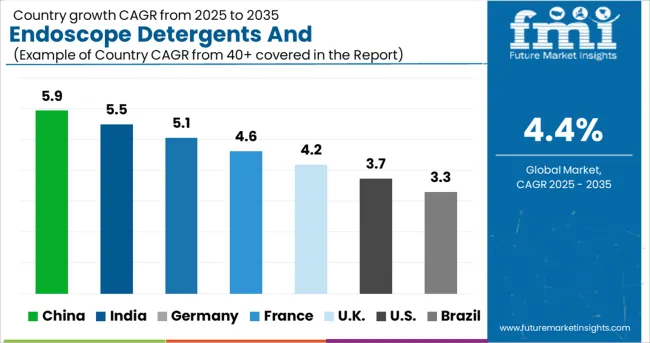
The USA is a leading country in North America, which is surging the market by collecting huge revenue in recent years. In addition to this, the demand for safe and effective surgical procedures has been rising in the US over the last few years, with over 15 million endoscopy procedures performed annually. This is propelling the endoscope detergents and disinfectants market size in the coming years.
Inspect of European Endoscope Detergents and Disinfectants Market

Europe is projected to follow the North American region and hold a significant market share of 29.1% in the forum among all the regions during the forecast period.

Due to the rising numbers of healthcare infrastructure and the presence of rising patients and geriatric populations in the region, it is likely to impact the market in the long run for Europe. With increasing age, gastrointestinal (GI) related diseases increase. The endoscope is used in the diagnosis and treatment of GI-related diseases.

Brief Overview of Dominating Segments

Let’s take a stroll across the dominating segments in the concerned forum:

Segment QuaternaryAmmonium Compounds (By Type)
Market Share in Base Year 31.4%
Attributing Reasons These compounds aid in controlling the spread of healthcare-associated infections in hospitals and clinics
Segment Medical Device Disinfectant (By Product)
Market Share in Base Year 45.7%
Attributing Reasons The increasing number of surgical procedures across the globe may be considered to be one of the major reasons for driving the segment over the forecast period.
Segment Business to Business (By Sales Channel)
Market Share in Base Year 65.1%
Attributing Reasons Medical device disinfectants, enzymatic cleaners, and surface disinfectants are major antiseptics and disinfectants highly marketed under the B2B sales channel.
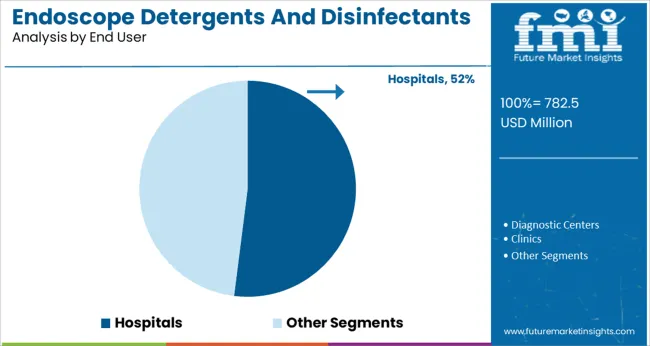
Segment Hospital (By End-Use)
Market Share in Base Year 46.2%
Attributing Reasons The increasing incidence of hospital-acquired infections across the globe is one of the major reasons for segment growth over the forecast period.

Get the data you need at a Fraction of the cost

Personalize your report by choosing insights you need
and save 40%!

Start-up Ecosystem

Start-ups Companies are Innovating in the Endoscope Detergents and Disinfectants Market

The technology in medicine is popped out by the various clinical and Research and Development institutions. Nowadays, start-up companies are interested in making unique devices to help patients throughout their treatment and recovery. This is likely to increase the opportunities in the endoscope detergents market in recent years.

Top Start-ups in the Endoscope Detergents and Disinfectants Market

Start-up Company EnVision Endoscopy
Base Country and Year US-based Start-up, 2018
Developments The start-up provides various clinical surgeries with innovative and effective solutions. They are developing endoscopic surgery devices to help patients to recover their health with minimal expense. However, the company is developing a low-cost IGSS (Image Guided Suturing System) for managing gastrointestinal defects.
Start-up Company MiWendo
Base Country and Year Spain-based Start-up, 2019
Developments The company is using microwave technology with a safe electromagnetic that is used to attach at conventional colonoscopy. Hence, it helps to detect polyps 360 Degrees and benign tissues

Competitive Landscape

Biggies Stirring Up the Soup in the Endoscope Detergents and Disinfectants Market

The key players are focusing on the product, which hits consumers' desires. These players are adopting various methods to acquire a maximum share of the market, some of them are mergers, acquisitions, and product launches.

Recent Developments in the Endoscope Detergents and Disinfectants

  • In November 2020, the Environmental Protection Agency (EPA) of the USA approved 3M's disinfectant TB Quat for SARS-CoV-2, which is a ready-to-use cleaner. Third-party lab testing of 3M's disinfectant TB Quat ready-to-use cleaner on hard, non-porous surfaces with a 60-second contact period proved the disinfectant's effectiveness against the virus.
  • January 2021, 5 SC Johnson home cleaning products have been added to Health Canada's list of effective disinfectants for use against SARS-CoV-2.

The newly adopted robotic systems were introduced in telesurgery in recent years. The first of this surgery is called the Lindbergh operation, which is a more effective and innovative surgery.
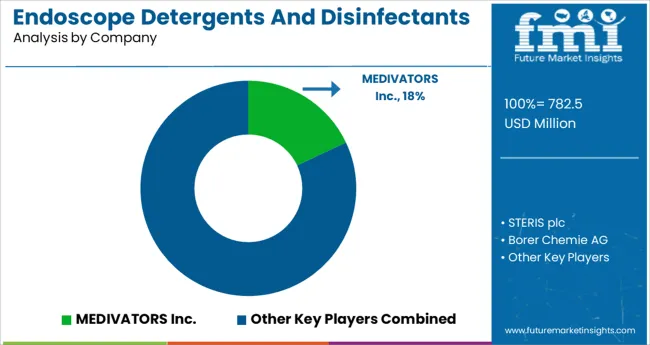
The Key Players in the global Endoscope Detergents and Disinfectants Market include

  • MEDIVATORS Inc.
  • STERIS plc
  • Borer Chemie AG
  • Cantel Medical
  • Getinge AB
  • Olympus Corporation
  • Vesimin Health
  • MDD Company GmbH
  • Georg Pauldrach
  • SIRMAXO CHEMICALS PVT.LTD
  • Serim Research Corporation

Report Scope

Report Attribute Details
Growth Rate CAGR of 4.4% from 2022 to 2032
Base Year for Estimation 2021
Historical Data 2017 to 2021
Forecast Period 2022 to 2032
Quantitative Units Revenue in US$ million and CAGR from 2022 to 2032
Report Coverage Revenue Forecast, Volume Forecast, Company Ranking, Competitive Landscape, Growth Factors, Trends, and Pricing Analysis
Segments Covered
  • Chemical Properties
  • Potency
  • End User
  • Region
Regions Covered
  • North America
  • Latin America
  • Europe
  • East Asia
  • South Asia
  • Oceania
  • Middle East and Africa
Key Countries Profiled
  • USA
  • Canada
  • Brazil
  • Argentina
  • Germany
  • UK
  • France
  • Spain
  • Italy
  • Nordics
  • BENELUX
  • Australia & New Zealand
  • China
  • India
  • ASIAN
  • GCC Countries
  • South Africa
Key Companies Profiled
  • MEDIVATORS Inc.
  • STERIS plc
  • Borer Chemie AG
  • Cantel Medical
  • Getinge AB
  • Olympus Corporation
  • Vesimin Health
  • MDD Company GmbH
  • Georg Pauldrach
  • SIRMAXO CHEMICALS PVT.LTD
  • Serim Research Corporation
Customization Available Upon Request

Key Segments in the Endoscope Detergents and Disinfectants Market

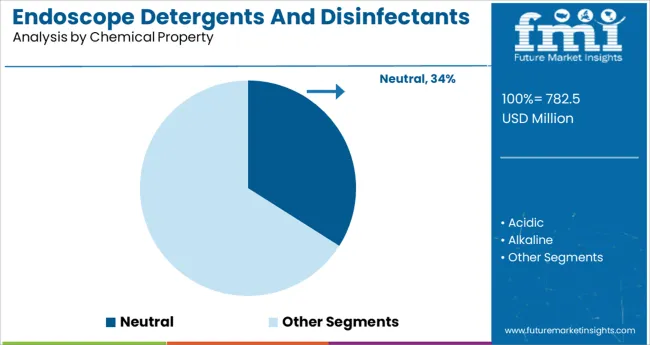
By Chemical Properties:

  • Acidic
  • Neutral
  • Alkaline
  • Enzymatic

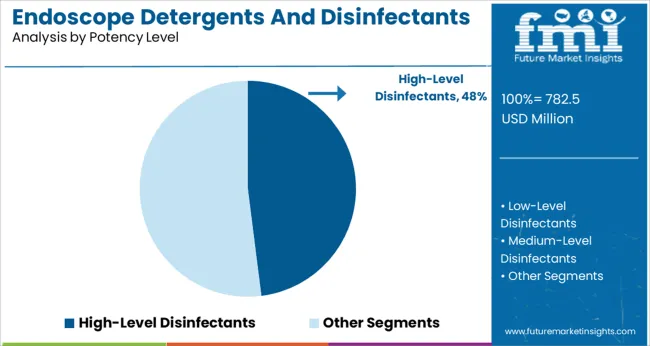
By Potency:

  • Low-Level Disinfectants
  • Medium-Level Disinfectants
  • High-Level Disinfectants

By End User:

  • Hospitals
  • Diagnostic Centers
  • Clinics

By Region:

  • North America
  • Latin America
  • Asia Pacific
  • Middle East and Africa (MEA)
  • Europe

Frequently Asked Questions

What is the Growth Outlook for the Endoscope Detergents and Disinfectants Market?

The endoscope detergents and disinfectants market is predicted to advance at a CAGR of 4.4% through 2032.

Which Region Leads the Endoscope Detergents and Disinfectants Market?

The North America is anticipated to lead the endoscope detergents and disinfectants market during the forecast period.

How much Growth Potential does Endoscope Detergents and Disinfectants Market hold?

The endoscope detergents and disinfectants market is likely to hold a valuation of US$1,108.2 million by 2032.

Which sector drives the Endoscope Detergents and Disinfectants Market?

Healthcare sector is the key driver in the endoscope detergents and disinfectants market.

Table of Content

1. Executive Summary | Endoscope Detergents And Disinfectants Market

    1.1. Global Market Outlook

    1.2. Demand-side Trends

    1.3. Supply-side Trends

    1.4. Technology Roadmap Analysis

    1.5. Analysis and Recommendations

2. Market Overview

    2.1. Market Coverage / Taxonomy

    2.2. Market Definition / Scope / Limitations

3. Market Background

    3.1. Market Dynamics

        3.1.1. Drivers

        3.1.2. Restraints

        3.1.3. Opportunity

        3.1.4. Trends

    3.2. Scenario Forecast

        3.2.1. Demand in Optimistic Scenario

        3.2.2. Demand in Likely Scenario

        3.2.3. Demand in Conservative Scenario

    3.3. Opportunity Map Analysis

    3.4. Investment Feasibility Matrix

    3.5. PESTLE and Porter’s Analysis

    3.6. Regulatory Landscape

        3.6.1. By Key Regions

        3.6.2. By Key Countries

    3.7. Regional Parent Market Outlook

4. Global Market Analysis 2017 to 2021 and Forecast, 2022 to 2032

    4.1. Historical Market Size Value (US$ Million) Analysis, 2017 to 2021

    4.2. Current and Future Market Size Value (US$ Million) Projections, 2022 to 2032

        4.2.1. Y-o-Y Growth Trend Analysis

        4.2.2. Absolute $ Opportunity Analysis

5. Global Market Analysis 2017 to 2021 and Forecast 2022 to 2032, By Chemical Properties

    5.1. Introduction / Key Findings

    5.2. Historical Market Size Value (US$ Million) Analysis By Chemical Properties, 2017 to 2021

    5.3. Current and Future Market Size Value (US$ Million) Analysis and Forecast By Chemical Properties, 2022 to 2032

        5.3.1. Acidic

        5.3.2. Neutral

        5.3.3. Alkaline

        5.3.4. Enzymatic

    5.4. Y-o-Y Growth Trend Analysis By Chemical Properties, 2017 to 2021

    5.5. Absolute $ Opportunity Analysis By Chemical Properties, 2022 to 2032

6. Global Market Analysis 2017 to 2021 and Forecast 2022 to 2032, By Potency

    6.1. Introduction / Key Findings

    6.2. Historical Market Size Value (US$ Million) Analysis By Potency, 2017 to 2021

    6.3. Current and Future Market Size Value (US$ Million) Analysis and Forecast By Potency, 2022 to 2032

        6.3.1. Low-Level Disinfectants

        6.3.2. Medium-Level Disinfectants

        6.3.3. High-Level Disinfectants

    6.4. Y-o-Y Growth Trend Analysis By Potency, 2017 to 2021

    6.5. Absolute $ Opportunity Analysis By Potency, 2022 to 2032

7. Global Market Analysis 2017 to 2021 and Forecast 2022 to 2032, By End User

    7.1. Introduction / Key Findings

    7.2. Historical Market Size Value (US$ Million) Analysis By End User, 2017 to 2021

    7.3. Current and Future Market Size Value (US$ Million) Analysis and Forecast By End User, 2022 to 2032

        7.3.1. Hospitals

        7.3.2. Diagnostic Centers

        7.3.3. Clinics

    7.4. Y-o-Y Growth Trend Analysis By End User, 2017 to 2021

    7.5. Absolute $ Opportunity Analysis By End User, 2022 to 2032

8. Global Market Analysis 2017 to 2021 and Forecast 2022 to 2032, By Region

    8.1. Introduction

    8.2. Historical Market Size Value (US$ Million) Analysis By Region, 2017 to 2021

    8.3. Current Market Size Value (US$ Million) Analysis and Forecast By Region, 2022 to 2032

        8.3.1. North America

        8.3.2. Latin America

        8.3.3. Europe

        8.3.4. Asia Pacific

        8.3.5. Middle East and Africa (MEA)

    8.4. Market Attractiveness Analysis By Region

9. North America Market Analysis 2017 to 2021 and Forecast 2022 to 2032, By Country

    9.1. Historical Market Size Value (US$ Million) Trend Analysis By Market Taxonomy, 2017 to 2021

    9.2. Market Size Value (US$ Million) Forecast By Market Taxonomy, 2022 to 2032

        9.2.1. By Country

            9.2.1.1. United States of America

            9.2.1.2. Canada

        9.2.2. By Chemical Properties

        9.2.3. By Potency

        9.2.4. By End User

    9.3. Market Attractiveness Analysis

        9.3.1. By Country

        9.3.2. By Chemical Properties

        9.3.3. By Potency

        9.3.4. By End User

    9.4. Key Takeaways

10. Latin America Market Analysis 2017 to 2021 and Forecast 2022 to 2032, By Country

    10.1. Historical Market Size Value (US$ Million) Trend Analysis By Market Taxonomy, 2017 to 2021

    10.2. Market Size Value (US$ Million) Forecast By Market Taxonomy, 2022 to 2032

        10.2.1. By Country

            10.2.1.1. Brazil

            10.2.1.2. Mexico

            10.2.1.3. Rest of Latin America

        10.2.2. By Chemical Properties

        10.2.3. By Potency

        10.2.4. By End User

    10.3. Market Attractiveness Analysis

        10.3.1. By Country

        10.3.2. By Chemical Properties

        10.3.3. By Potency

        10.3.4. By End User

    10.4. Key Takeaways

11. Europe Market Analysis 2017 to 2021 and Forecast 2022 to 2032, By Country

    11.1. Historical Market Size Value (US$ Million) Trend Analysis By Market Taxonomy, 2017 to 2021

    11.2. Market Size Value (US$ Million) Forecast By Market Taxonomy, 2022 to 2032

        11.2.1. By Country

            11.2.1.1. Germany

            11.2.1.2. United Kingdom

            11.2.1.3. France

            11.2.1.4. Spain

            11.2.1.5. Italy

            11.2.1.6. Rest of Europe

        11.2.2. By Chemical Properties

        11.2.3. By Potency

        11.2.4. By End User

    11.3. Market Attractiveness Analysis

        11.3.1. By Country

        11.3.2. By Chemical Properties

        11.3.3. By Potency

        11.3.4. By End User

    11.4. Key Takeaways

12. Asia Pacific Market Analysis 2017 to 2021 and Forecast 2022 to 2032, By Country

    12.1. Historical Market Size Value (US$ Million) Trend Analysis By Market Taxonomy, 2017 to 2021

    12.2. Market Size Value (US$ Million) Forecast By Market Taxonomy, 2022 to 2032

        12.2.1. By Country

            12.2.1.1. China

            12.2.1.2. Japan

            12.2.1.3. South Korea

            12.2.1.4. India

            12.2.1.5. Malaysia

            12.2.1.6. Singapore

            12.2.1.7. Australia

            12.2.1.8. New Zealand

            12.2.1.9. Rest of APAC

        12.2.2. By Chemical Properties

        12.2.3. By Potency

        12.2.4. By End User

    12.3. Market Attractiveness Analysis

        12.3.1. By Country

        12.3.2. By Chemical Properties

        12.3.3. By Potency

        12.3.4. By End User

    12.4. Key Takeaways

13. MEA Market Analysis 2017 to 2021 and Forecast 2022 to 2032, By Country

    13.1. Historical Market Size Value (US$ Million) Trend Analysis By Market Taxonomy, 2017 to 2021

    13.2. Market Size Value (US$ Million) Forecast By Market Taxonomy, 2022 to 2032

        13.2.1. By Country

            13.2.1.1. GCC Countries

            13.2.1.2. South Africa

            13.2.1.3. Israel

            13.2.1.4. Rest of MEA

        13.2.2. By Chemical Properties

        13.2.3. By Potency

        13.2.4. By End User

    13.3. Market Attractiveness Analysis

        13.3.1. By Country

        13.3.2. By Chemical Properties

        13.3.3. By Potency

        13.3.4. By End User

    13.4. Key Takeaways

14. Key Countries Market Analysis

    14.1. United States of America

        14.1.1. Pricing Analysis

        14.1.2. Market Share Analysis, 2021

            14.1.2.1. By Chemical Properties

            14.1.2.2. By Potency

            14.1.2.3. By End User

    14.2. Canada

        14.2.1. Pricing Analysis

        14.2.2. Market Share Analysis, 2021

            14.2.2.1. By Chemical Properties

            14.2.2.2. By Potency

            14.2.2.3. By End User

    14.3. Brazil

        14.3.1. Pricing Analysis

        14.3.2. Market Share Analysis, 2021

            14.3.2.1. By Chemical Properties

            14.3.2.2. By Potency

            14.3.2.3. By End User

    14.4. Mexico

        14.4.1. Pricing Analysis

        14.4.2. Market Share Analysis, 2021

            14.4.2.1. By Chemical Properties

            14.4.2.2. By Potency

            14.4.2.3. By End User

    14.5. Germany

        14.5.1. Pricing Analysis

        14.5.2. Market Share Analysis, 2021

            14.5.2.1. By Chemical Properties

            14.5.2.2. By Potency

            14.5.2.3. By End User

    14.6. United Kingdom

        14.6.1. Pricing Analysis

        14.6.2. Market Share Analysis, 2021

            14.6.2.1. By Chemical Properties

            14.6.2.2. By Potency

            14.6.2.3. By End User

    14.7. France

        14.7.1. Pricing Analysis

        14.7.2. Market Share Analysis, 2021

            14.7.2.1. By Chemical Properties

            14.7.2.2. By Potency

            14.7.2.3. By End User

    14.8. Spain

        14.8.1. Pricing Analysis

        14.8.2. Market Share Analysis, 2021

            14.8.2.1. By Chemical Properties

            14.8.2.2. By Potency

            14.8.2.3. By End User

    14.9. Italy

        14.9.1. Pricing Analysis

        14.9.2. Market Share Analysis, 2021

            14.9.2.1. By Chemical Properties

            14.9.2.2. By Potency

            14.9.2.3. By End User

    14.10. China

        14.10.1. Pricing Analysis

        14.10.2. Market Share Analysis, 2021

            14.10.2.1. By Chemical Properties

            14.10.2.2. By Potency

            14.10.2.3. By End User

    14.11. Japan

        14.11.1. Pricing Analysis

        14.11.2. Market Share Analysis, 2021

            14.11.2.1. By Chemical Properties

            14.11.2.2. By Potency

            14.11.2.3. By End User

    14.12. South Korea

        14.12.1. Pricing Analysis

        14.12.2. Market Share Analysis, 2021

            14.12.2.1. By Chemical Properties

            14.12.2.2. By Potency

            14.12.2.3. By End User

    14.13. Malaysia

        14.13.1. Pricing Analysis

        14.13.2. Market Share Analysis, 2021

            14.13.2.1. By Chemical Properties

            14.13.2.2. By Potency

            14.13.2.3. By End User

    14.14. Singapore

        14.14.1. Pricing Analysis

        14.14.2. Market Share Analysis, 2021

            14.14.2.1. By Chemical Properties

            14.14.2.2. By Potency

            14.14.2.3. By End User

    14.15. Australia

        14.15.1. Pricing Analysis

        14.15.2. Market Share Analysis, 2021

            14.15.2.1. By Chemical Properties

            14.15.2.2. By Potency

            14.15.2.3. By End User

    14.16. New Zealand

        14.16.1. Pricing Analysis

        14.16.2. Market Share Analysis, 2021

            14.16.2.1. By Chemical Properties

            14.16.2.2. By Potency

            14.16.2.3. By End User

    14.17. GCC Countries

        14.17.1. Pricing Analysis

        14.17.2. Market Share Analysis, 2021

            14.17.2.1. By Chemical Properties

            14.17.2.2. By Potency

            14.17.2.3. By End User

    14.18. South Africa

        14.18.1. Pricing Analysis

        14.18.2. Market Share Analysis, 2021

            14.18.2.1. By Chemical Properties

            14.18.2.2. By Potency

            14.18.2.3. By End User

    14.19. Israel

        14.19.1. Pricing Analysis

        14.19.2. Market Share Analysis, 2021

            14.19.2.1. By Chemical Properties

            14.19.2.2. By Potency

            14.19.2.3. By End User

15. Market Structure Analysis

    15.1. Competition Dashboard

    15.2. Competition Benchmarking

    15.3. Market Share Analysis of Top Players

        15.3.1. By Regional

        15.3.2. By Chemical Properties

        15.3.3. By Potency

        15.3.4. By End User

16. Competition Analysis

    16.1. Competition Deep Dive

        16.1.1. MEDIVATORS Inc.

            16.1.1.1. Overview

            16.1.1.2. Product Portfolio

            16.1.1.3. Profitability by Market Segments

            16.1.1.4. Sales Footprint

                16.1.1.4.1. Marketing Strategy

        16.1.2. STERIS plc

            16.1.2.1. Overview

            16.1.2.2. Product Portfolio

            16.1.2.3. Profitability by Market Segments

            16.1.2.4. Sales Footprint

                16.1.2.4.1. Marketing Strategy

        16.1.3. Borer Chemie AG

            16.1.3.1. Overview

            16.1.3.2. Product Portfolio

            16.1.3.3. Profitability by Market Segments

            16.1.3.4. Sales Footprint

                16.1.3.4.1. Marketing Strategy

        16.1.4. Cantel Medical

            16.1.4.1. Overview

            16.1.4.2. Product Portfolio

            16.1.4.3. Profitability by Market Segments

            16.1.4.4. Sales Footprint

                16.1.4.4.1. Marketing Strategy

        16.1.5. Getinge AB

            16.1.5.1. Overview

            16.1.5.2. Product Portfolio

            16.1.5.3. Profitability by Market Segments

            16.1.5.4. Sales Footprint

                16.1.5.4.1. Marketing Strategy

        16.1.6. Olympus Corporation

            16.1.6.1. Overview

            16.1.6.2. Product Portfolio

            16.1.6.3. Profitability by Market Segments

            16.1.6.4. Sales Footprint

                16.1.6.4.1. Marketing Strategy

        16.1.7. Vesimin Health

            16.1.7.1. Overview

            16.1.7.2. Product Portfolio

            16.1.7.3. Profitability by Market Segments

            16.1.7.4. Sales Footprint

                16.1.7.4.1. Marketing Strategy

        16.1.8. MDD Company GmbH

            16.1.8.1. Overview

            16.1.8.2. Product Portfolio

            16.1.8.3. Profitability by Market Segments

            16.1.8.4. Sales Footprint

                16.1.8.4.1. Marketing Strategy

        16.1.9. Georg Pauldrach

            16.1.9.1. Overview

            16.1.9.2. Product Portfolio

            16.1.9.3. Profitability by Market Segments

            16.1.9.4. Sales Footprint

                16.1.9.4.1. Marketing Strategy

        16.1.10. SIRMAXO CHEMICALS PVT.LTD

            16.1.10.1. Overview

            16.1.10.2. Product Portfolio

            16.1.10.3. Profitability by Market Segments

            16.1.10.4. Sales Footprint

                16.1.10.4.1. Marketing Strategy

        16.1.11. Serim Research Corporation

            16.1.11.1. Overview

            16.1.11.2. Product Portfolio

            16.1.11.3. Profitability by Market Segments

            16.1.11.4. Sales Footprint

                16.1.11.4.1. Marketing Strategy

17. Assumptions & Acronyms Used

18. Research Methodology

List of Tables

Table 1: Global Market Value (US$ Million) Forecast by Region, 2017 to 2032

Table 2: Global Market Value (US$ Million) Forecast by Chemical Properties, 2017 to 2032

Table 3: Global Market Value (US$ Million) Forecast by Potency, 2017 to 2032

Table 4: Global Market Value (US$ Million) Forecast by End User, 2017 to 2032

Table 5: North America Market Value (US$ Million) Forecast by Country, 2017 to 2032

Table 6: North America Market Value (US$ Million) Forecast by Chemical Properties, 2017 to 2032

Table 7: North America Market Value (US$ Million) Forecast by Potency, 2017 to 2032

Table 8: North America Market Value (US$ Million) Forecast by End User, 2017 to 2032

Table 9: Latin America Market Value (US$ Million) Forecast by Country, 2017 to 2032

Table 10: Latin America Market Value (US$ Million) Forecast by Chemical Properties, 2017 to 2032

Table 11: Latin America Market Value (US$ Million) Forecast by Potency, 2017 to 2032

Table 12: Latin America Market Value (US$ Million) Forecast by End User, 2017 to 2032

Table 13: Europe Market Value (US$ Million) Forecast by Country, 2017 to 2032

Table 14: Europe Market Value (US$ Million) Forecast by Chemical Properties, 2017 to 2032

Table 15: Europe Market Value (US$ Million) Forecast by Potency, 2017 to 2032

Table 16: Europe Market Value (US$ Million) Forecast by End User, 2017 to 2032

Table 17: Asia Pacific Market Value (US$ Million) Forecast by Country, 2017 to 2032

Table 18: Asia Pacific Market Value (US$ Million) Forecast by Chemical Properties, 2017 to 2032

Table 19: Asia Pacific Market Value (US$ Million) Forecast by Potency, 2017 to 2032

Table 20: Asia Pacific Market Value (US$ Million) Forecast by End User, 2017 to 2032

Table 21: MEA Market Value (US$ Million) Forecast by Country, 2017 to 2032

Table 22: MEA Market Value (US$ Million) Forecast by Chemical Properties, 2017 to 2032

Table 23: MEA Market Value (US$ Million) Forecast by Potency, 2017 to 2032

Table 24: MEA Market Value (US$ Million) Forecast by End User, 2017 to 2032

List of Charts

Figure 1: Global Market Value (US$ Million) by Chemical Properties, 2022 to 2032

Figure 2: Global Market Value (US$ Million) by Potency, 2022 to 2032

Figure 3: Global Market Value (US$ Million) by End User, 2022 to 2032

Figure 4: Global Market Value (US$ Million) by Region, 2022 to 2032

Figure 5: Global Market Value (US$ Million) Analysis by Region, 2017 to 2032

Figure 6: Global Market Value Share (%) and BPS Analysis by Region, 2022 to 2032

Figure 7: Global Market Y-o-Y Growth (%) Projections by Region, 2022 to 2032

Figure 8: Global Market Value (US$ Million) Analysis by Chemical Properties, 2017 to 2032

Figure 9: Global Market Value Share (%) and BPS Analysis by Chemical Properties, 2022 to 2032

Figure 10: Global Market Y-o-Y Growth (%) Projections by Chemical Properties, 2022 to 2032

Figure 11: Global Market Value (US$ Million) Analysis by Potency, 2017 to 2032

Figure 12: Global Market Value Share (%) and BPS Analysis by Potency, 2022 to 2032

Figure 13: Global Market Y-o-Y Growth (%) Projections by Potency, 2022 to 2032

Figure 14: Global Market Value (US$ Million) Analysis by End User, 2017 to 2032

Figure 15: Global Market Value Share (%) and BPS Analysis by End User, 2022 to 2032

Figure 16: Global Market Y-o-Y Growth (%) Projections by End User, 2022 to 2032

Figure 17: Global Market Attractiveness by Chemical Properties, 2022 to 2032

Figure 18: Global Market Attractiveness by Potency, 2022 to 2032

Figure 19: Global Market Attractiveness by End User, 2022 to 2032

Figure 20: Global Market Attractiveness by Region, 2022 to 2032

Figure 21: North America Market Value (US$ Million) by Chemical Properties, 2022 to 2032

Figure 22: North America Market Value (US$ Million) by Potency, 2022 to 2032

Figure 23: North America Market Value (US$ Million) by End User, 2022 to 2032

Figure 24: North America Market Value (US$ Million) by Country, 2022 to 2032

Figure 25: North America Market Value (US$ Million) Analysis by Country, 2017 to 2032

Figure 26: North America Market Value Share (%) and BPS Analysis by Country, 2022 to 2032

Figure 27: North America Market Y-o-Y Growth (%) Projections by Country, 2022 to 2032

Figure 28: North America Market Value (US$ Million) Analysis by Chemical Properties, 2017 to 2032

Figure 29: North America Market Value Share (%) and BPS Analysis by Chemical Properties, 2022 to 2032

Figure 30: North America Market Y-o-Y Growth (%) Projections by Chemical Properties, 2022 to 2032

Figure 31: North America Market Value (US$ Million) Analysis by Potency, 2017 to 2032

Figure 32: North America Market Value Share (%) and BPS Analysis by Potency, 2022 to 2032

Figure 33: North America Market Y-o-Y Growth (%) Projections by Potency, 2022 to 2032

Figure 34: North America Market Value (US$ Million) Analysis by End User, 2017 to 2032

Figure 35: North America Market Value Share (%) and BPS Analysis by End User, 2022 to 2032

Figure 36: North America Market Y-o-Y Growth (%) Projections by End User, 2022 to 2032

Figure 37: North America Market Attractiveness by Chemical Properties, 2022 to 2032

Figure 38: North America Market Attractiveness by Potency, 2022 to 2032

Figure 39: North America Market Attractiveness by End User, 2022 to 2032

Figure 40: North America Market Attractiveness by Country, 2022 to 2032

Figure 41: Latin America Market Value (US$ Million) by Chemical Properties, 2022 to 2032

Figure 42: Latin America Market Value (US$ Million) by Potency, 2022 to 2032

Figure 43: Latin America Market Value (US$ Million) by End User, 2022 to 2032

Figure 44: Latin America Market Value (US$ Million) by Country, 2022 to 2032

Figure 45: Latin America Market Value (US$ Million) Analysis by Country, 2017 to 2032

Figure 46: Latin America Market Value Share (%) and BPS Analysis by Country, 2022 to 2032

Figure 47: Latin America Market Y-o-Y Growth (%) Projections by Country, 2022 to 2032

Figure 48: Latin America Market Value (US$ Million) Analysis by Chemical Properties, 2017 to 2032

Figure 49: Latin America Market Value Share (%) and BPS Analysis by Chemical Properties, 2022 to 2032

Figure 50: Latin America Market Y-o-Y Growth (%) Projections by Chemical Properties, 2022 to 2032

Figure 51: Latin America Market Value (US$ Million) Analysis by Potency, 2017 to 2032

Figure 52: Latin America Market Value Share (%) and BPS Analysis by Potency, 2022 to 2032

Figure 53: Latin America Market Y-o-Y Growth (%) Projections by Potency, 2022 to 2032

Figure 54: Latin America Market Value (US$ Million) Analysis by End User, 2017 to 2032

Figure 55: Latin America Market Value Share (%) and BPS Analysis by End User, 2022 to 2032

Figure 56: Latin America Market Y-o-Y Growth (%) Projections by End User, 2022 to 2032

Figure 57: Latin America Market Attractiveness by Chemical Properties, 2022 to 2032

Figure 58: Latin America Market Attractiveness by Potency, 2022 to 2032

Figure 59: Latin America Market Attractiveness by End User, 2022 to 2032

Figure 60: Latin America Market Attractiveness by Country, 2022 to 2032

Figure 61: Europe Market Value (US$ Million) by Chemical Properties, 2022 to 2032

Figure 62: Europe Market Value (US$ Million) by Potency, 2022 to 2032

Figure 63: Europe Market Value (US$ Million) by End User, 2022 to 2032

Figure 64: Europe Market Value (US$ Million) by Country, 2022 to 2032

Figure 65: Europe Market Value (US$ Million) Analysis by Country, 2017 to 2032

Figure 66: Europe Market Value Share (%) and BPS Analysis by Country, 2022 to 2032

Figure 67: Europe Market Y-o-Y Growth (%) Projections by Country, 2022 to 2032

Figure 68: Europe Market Value (US$ Million) Analysis by Chemical Properties, 2017 to 2032

Figure 69: Europe Market Value Share (%) and BPS Analysis by Chemical Properties, 2022 to 2032

Figure 70: Europe Market Y-o-Y Growth (%) Projections by Chemical Properties, 2022 to 2032

Figure 71: Europe Market Value (US$ Million) Analysis by Potency, 2017 to 2032

Figure 72: Europe Market Value Share (%) and BPS Analysis by Potency, 2022 to 2032

Figure 73: Europe Market Y-o-Y Growth (%) Projections by Potency, 2022 to 2032

Figure 74: Europe Market Value (US$ Million) Analysis by End User, 2017 to 2032

Figure 75: Europe Market Value Share (%) and BPS Analysis by End User, 2022 to 2032

Figure 76: Europe Market Y-o-Y Growth (%) Projections by End User, 2022 to 2032

Figure 77: Europe Market Attractiveness by Chemical Properties, 2022 to 2032

Figure 78: Europe Market Attractiveness by Potency, 2022 to 2032

Figure 79: Europe Market Attractiveness by End User, 2022 to 2032

Figure 80: Europe Market Attractiveness by Country, 2022 to 2032

Figure 81: Asia Pacific Market Value (US$ Million) by Chemical Properties, 2022 to 2032

Figure 82: Asia Pacific Market Value (US$ Million) by Potency, 2022 to 2032

Figure 83: Asia Pacific Market Value (US$ Million) by End User, 2022 to 2032

Figure 84: Asia Pacific Market Value (US$ Million) by Country, 2022 to 2032

Figure 85: Asia Pacific Market Value (US$ Million) Analysis by Country, 2017 to 2032

Figure 86: Asia Pacific Market Value Share (%) and BPS Analysis by Country, 2022 to 2032

Figure 87: Asia Pacific Market Y-o-Y Growth (%) Projections by Country, 2022 to 2032

Figure 88: Asia Pacific Market Value (US$ Million) Analysis by Chemical Properties, 2017 to 2032

Figure 89: Asia Pacific Market Value Share (%) and BPS Analysis by Chemical Properties, 2022 to 2032

Figure 90: Asia Pacific Market Y-o-Y Growth (%) Projections by Chemical Properties, 2022 to 2032

Figure 91: Asia Pacific Market Value (US$ Million) Analysis by Potency, 2017 to 2032

Figure 92: Asia Pacific Market Value Share (%) and BPS Analysis by Potency, 2022 to 2032

Figure 93: Asia Pacific Market Y-o-Y Growth (%) Projections by Potency, 2022 to 2032

Figure 94: Asia Pacific Market Value (US$ Million) Analysis by End User, 2017 to 2032

Figure 95: Asia Pacific Market Value Share (%) and BPS Analysis by End User, 2022 to 2032

Figure 96: Asia Pacific Market Y-o-Y Growth (%) Projections by End User, 2022 to 2032

Figure 97: Asia Pacific Market Attractiveness by Chemical Properties, 2022 to 2032

Figure 98: Asia Pacific Market Attractiveness by Potency, 2022 to 2032

Figure 99: Asia Pacific Market Attractiveness by End User, 2022 to 2032

Figure 100: Asia Pacific Market Attractiveness by Country, 2022 to 2032

Figure 101: MEA Market Value (US$ Million) by Chemical Properties, 2022 to 2032

Figure 102: MEA Market Value (US$ Million) by Potency, 2022 to 2032

Figure 103: MEA Market Value (US$ Million) by End User, 2022 to 2032

Figure 104: MEA Market Value (US$ Million) by Country, 2022 to 2032

Figure 105: MEA Market Value (US$ Million) Analysis by Country, 2017 to 2032

Figure 106: MEA Market Value Share (%) and BPS Analysis by Country, 2022 to 2032

Figure 107: MEA Market Y-o-Y Growth (%) Projections by Country, 2022 to 2032

Figure 108: MEA Market Value (US$ Million) Analysis by Chemical Properties, 2017 to 2032

Figure 109: MEA Market Value Share (%) and BPS Analysis by Chemical Properties, 2022 to 2032

Figure 110: MEA Market Y-o-Y Growth (%) Projections by Chemical Properties, 2022 to 2032

Figure 111: MEA Market Value (US$ Million) Analysis by Potency, 2017 to 2032

Figure 112: MEA Market Value Share (%) and BPS Analysis by Potency, 2022 to 2032

Figure 113: MEA Market Y-o-Y Growth (%) Projections by Potency, 2022 to 2032

Figure 114: MEA Market Value (US$ Million) Analysis by End User, 2017 to 2032

Figure 115: MEA Market Value Share (%) and BPS Analysis by End User, 2022 to 2032

Figure 116: MEA Market Y-o-Y Growth (%) Projections by End User, 2022 to 2032

Figure 117: MEA Market Attractiveness by Chemical Properties, 2022 to 2032

Figure 118: MEA Market Attractiveness by Potency, 2022 to 2032

Figure 119: MEA Market Attractiveness by End User, 2022 to 2032

Figure 120: MEA Market Attractiveness by Country, 2022 to 2032

Recommendations

Healthcare

Endoscopic Vessel Harvesting System Market

Published : September 2023

Healthcare

Endoscope Reprocessing Device Market

Published : October 2022

Healthcare

Endoscopy Visualization Components Market

Published : June 2022

Explore Healthcare Insights

View Reports

Endoscope Detergents And Disinfectants Market