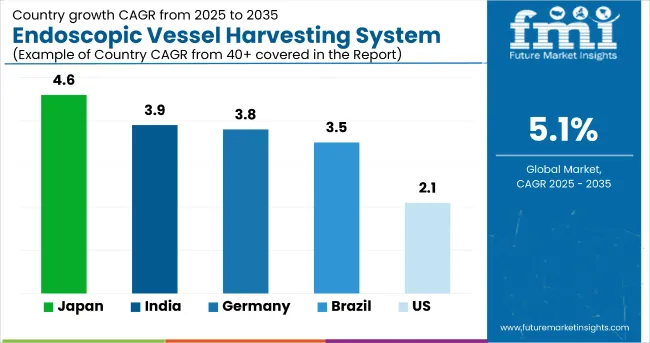
The global endoscopic vessel harvesting (EVH) system market is estimated to be worth USD 577.1 million in 2025 and is projected to reach USD 949 million by 2035, expanding at a steady CAGR of 5.1%.
The United States and Germany remain the dominant markets due to high volumes of coronary artery bypass grafting (CABG) procedures and advanced healthcare infrastructure, while countries like Japan and India are rapidly catching up due to growing cardiac disease prevalence and adoption of minimally invasive techniques. Among vessel types, saphenous vein harvesting continues to dominate procedures, while disposable EVH systems are preferred globally due to sterility and ease of use.
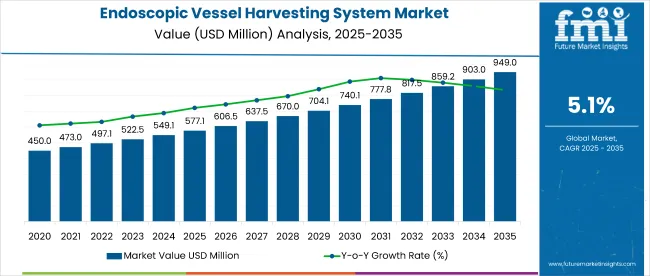
The primary growth drivers include the rising incidence of cardiovascular diseases, especially ischemic heart conditions, and a corresponding increase in surgical interventions like CABG. EVH systems have gained traction for their ability to reduce surgical trauma, lower infection rates, and improve recovery outcomes.
Hospitals are favoring these systems for their efficiency and patient safety advantages over open vessel harvesting techniques. Moreover, the emergence of robot-assisted EVH systems, better endoscopic visualization, and AI-enabled imaging tools are enhancing procedural success and surgeon confidence.
Despite the strong outlook, the market faces certain challenges. High device costs, lengthy surgeon training requirements, and uneven regulatory pathways in emerging markets hinder faster adoption. Additionally, concerns regarding vessel quality and long-term graft patency continue to be evaluated. However, these concerns are increasingly addressed through innovations in endoscopic precision, surgeon training platforms, and bioengineered graft alternatives.
Looking ahead, the market is expected to be shaped by AI-integrated harvesting, telemedicine-based training programs, and biodegradable surgical components that support value-based care. Strategic partnerships between hospitals and device manufacturers, along with regional production hubs, will play a crucial role in making EVH systems more accessible, affordable, and sustainable-especially in Asia-Pacific and Latin America.
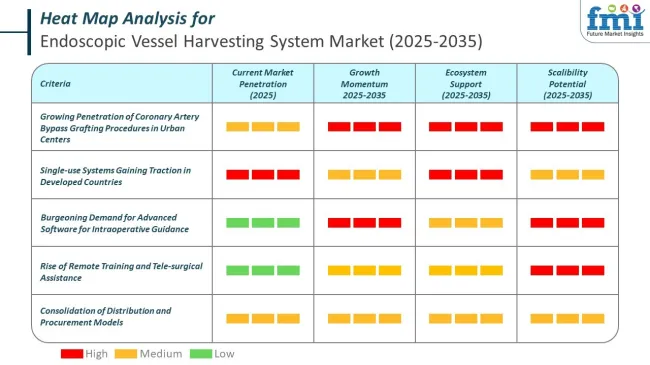
Artificial-intelligence routines are no longer a laboratory curiosity in endoscopic vessel harvesting (EVH). Patents filed in 2024 describe augmented-reality visors that overlay a “heat-map” of branch points on the camera feed, allowing harvesters to cauterise without breaking focus.
Peer-reviewed studies confirm that AI-guided harvesting systems improve operational efficiency and reduce crop injury. Specifically, automation technologies have been shown to reduce crop and branch-related injuries by 10-30% and shorten harvest times by 10-25%,
How Leading Endoscopic Vessel Harvesting System Players are Leveraging AI, Machine Learning and Latest Tech
The EVH industry is rapidly moving toward robotic assistance and smart, image-guided systems, where the convergence of AI, robotics, and minimally invasive technology is significantly improving procedural efficiency and clinical outcomes.
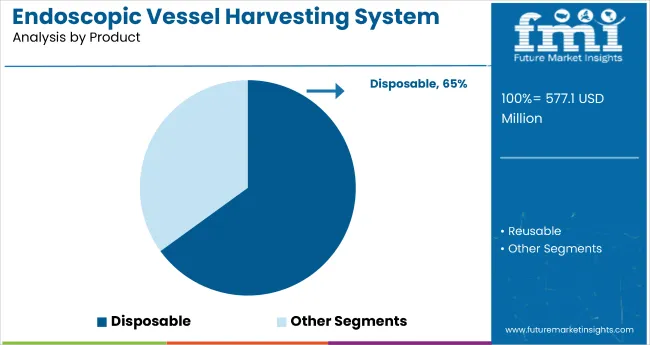
The disposable segment holds a dominant position with 65% of the market share in the product category of the endoscopic vessel harvesting system market. This leadership is driven by the increasing adoption of single-use devices that significantly reduce the risks of infection, cross-contamination, and device reprocessing errors in surgical procedures. Disposable systems offer enhanced safety, efficiency, and ease of compliance with rigorous hospital hygiene standards.
Hospitals and surgical centers are steadily shifting toward disposables to streamline workflow, minimize sterilization costs, and ensure consistent device performance. The segment’s growth is further supported by regulatory recommendations favoring single-use medical technology and the rising volume of cardiovascular surgeries worldwide.
Manufacturers are innovating in ergonomic design and packaging to support convenient use, while optimizing cost-effectiveness for high-throughput environments. With patient safety and operational efficiency as priorities, the disposable segment is expected to maintain its market dominance over the coming decade.
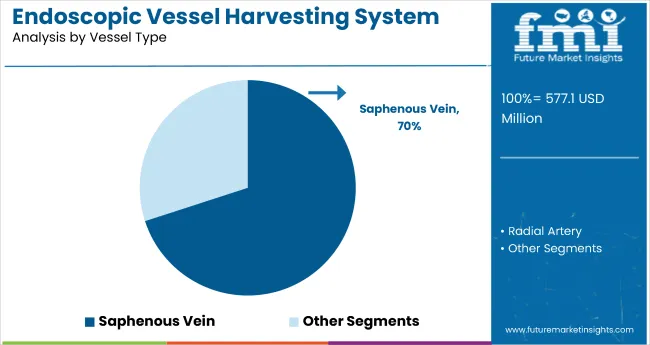
The saphenous vein vessel type dominates with 70% of the market share in vessel harvesting systems, largely due to its widespread clinical preference in coronary artery bypass grafting (CABG) and related cardiovascular procedures. Saphenous veins offer favorable anatomical and physiological characteristics, making them the vessel of choice for surgeons when creating bypass conduits.
The segment’s prominence is reinforced by extensive historical data supporting its successful outcomes, procedural familiarity among clinicians, and suitability for minimally invasive, endoscopic harvesting techniques. Continuous advances in visualization and extraction tools have further improved vein integrity and graft patency rates, solidifying the preference for saphenous veins. As the number of CABG procedures globally rises, the saphenous vein segment is expected to remain the backbone of vessel harvesting system applications in cardiovascular surgery.
Challenges
The not so familiar with electronic vessel harvesters (EVH), the long time required for training and a lack of awareness of the market in some regions may be the main barriers against sales and executive acceleration.
Furthermore, lack of confidence in the very long term survival of vessel collection and the risk of using it incorrectly can be some of the factors affecting the approval of the technology. Regulations that are tough and the slow approval process of some EVH systems in clinical settings can inhibit the wide adoption of the new technology.
Opportunities
Endoscopic imaging technology getting better, strongly present AI-enabled surgical devices, and even hybrids of surgery. These three are the best outcomes for business growth. Telemedicine and virtual CV surgeon training programs are showing improvement in the area of EVH.
Other than that, the linkages between hospitals and medical device manufacturers to develop economically friendly products are projected to be a catalyst feasible for both of them. Bioengineering of grafts and using analytics through AI for real-time intraoperative assistance are also showing signs of changes in the future technology of EVH.
The period from 2020 to 2024 saw the EVH market expanding on a continual basis with all the cardiovascular diseases due to the incessant increase in the number of CABG surgeries and developments in minimally invasive surgery.
The mandate for EVH was largely owed to the fact that it brought along with it way less surgical trauma, decreased wrong infection factors, and people got hospital all the faster right back home. On the contrary, the bright side was rather the advantages of the EVH approach-the EVH system by the fact that it was more minimally invasive than the traditional open vessels surgery, less trauma was inflicted on the patient, the risk of infections was lower and the recovery period was faster.
Nonetheless, the reluctance to its adoption was due to a number of concerns, like the high cost of EVH systems, the necessity of advanced surgical skills, and the variance of procedure outcomes.
In the period before 2025 to 2035, technology will be the main player in influencing the market by bringing to life such technologies as AI-powered harvesting techniques, robot-assisted EVH systems, and upgraded endoscopic equipment. The regulatory bodies will have the responsibility of post-market surveillance and thereby intensify procedural safety and long-term graft patency.
The trend to value-based care will determine savings; for example, the use of disposable and ergonomic EVH systems will be cost-saving while on the part of hospitals, green surgical components will be the best choice among different similar equipment.
Market Outlook
The United States endoscopic vessel harvesting (EVH) systems market is continuously growing due to the increasing lifestyle-related health problems, like cardiovascular diseases, and the growing demand for minimally invasive surgeries.
The use of these systems in the bypass surgery of the coronary arteries by blockage has become even more widespread as a result of the aforementioned factors, the procedure of which reduces the possibility of negative effects on the patient's surgical reaction and contributes its perfection to the patient's new life.
Market Growth Factors
Market Forecast
| Country | CAGR (2025 to 2035) |
|---|---|
| United States | 2.1% |
Market Outlook
There is increasing optimism regarding the EVH systems market in Germany, mainly because of a promising healthcare system and good professional attention to advanced surgeries. The stressed management towards improvement in surgery results and quality patient care are conducive in using EVH systems in cardiovascular surgeries.
Market Growth Factors
Market Forecast
| Country | CAGR (2025 to 2035) |
|---|---|
| Germany | 3.8% |
Market Outlook
India's EVH systems market is an emerging industry which is driven by the rising burden of cardiovascular diseases and the growth of the healthcare infrastructure. The is gained of the adaption of the minimally invasive surgical techniques in urban medical centers to the market extension as well.
Market Growth Factors
Market Forecast
| Country | CAGR (2025 to 2035) |
|---|---|
| India | 3.9% |
Market Outlook
Japan's EVH systems market is extremely sophisticated owing to state-of-the-art medical developments and the healthcare system's emphasis on minimally invasive procedures. The country's aging population and high healthcare standards are the pivot that drives the preference of EVH systems for cardiac surgery in.
Market Growth Factors
Technological Innovation: Technology in the health sphere is developing constantly in Japan and all that is why the most up-to-date EVH machines are available on the market. Aging Demographics: A big AT INCREASE IN THE CARDIAC
Healthcare Quality Standards: Japan's strict compliance to the best medical practices is enabling the implementation of advanced surgical techniques.
Research and Development: The EVO, inevitably closely linked to the ongoing R&D procedures, also contributes to the blending and scoring of the EVH technologies of the future, are thoroughly explained in the rest of this book. Patient Outcomes Focus: The best practice involves introducing new minimally invasive procedures like EVH that, in turn, have the best patient outcomes.
Market Forecast
| Country | CAGR (2025 to 2035) |
|---|---|
| Japan | 4.6% |
Market Outlook
The market for EVH systems in Brazil is increasing, sustained by healthcare improvements and rising awareness of minimally invasive surgical options. The growing incidence of cardiovascular diseases calls for effective surgical management and impels the acceptance of EVH systems.
Market Growth Factors
Market Forecast
| Country | CAGR (2025 to 2035) |
|---|---|
| Brazil | 3.5% |
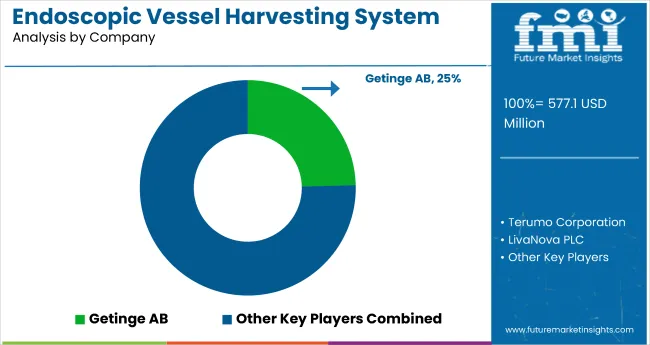
Endoscopic vessel harvesting (EVH) systems haunt the market with the competition raging from top players worldwide and from domestic players. They grow increasingly with the rise in the prevalence of cardiovascular diseases, advances in minimally invasive surgical approaches, increased consumer preference for procedures that minimize rehabilitation time and complications, and increased need for technology adoption in EVH.
Firms find the ground to invest in precision engineering, automation, and the better ergonomics of the users. Established manufacturers and up-rising brands will both contribute to the ever-changing landscape of EVH technology in the continuous dynamic industry.
Getinge AB (24.6%)
A market leader in EVH, Getinge AB is known for its Vasoview Hemopro series, which makes use of simultaneous cut-and-seal technology to enhance conduit quality and minimize thermal injury during vessel harvesting.
Terumo Corporation (18.5%)
Terumo VirtuoSaph Plus EVH system is engineered to be easy to use with an ergonomic design that supports minimally invasive vessel harvesting, thus improving patient outcomes.
LivaNova PLC (13.5%)
LivaNova concentrates on designing EVH solutions that emphasize ergonomics for the surgeon and procedural efficiency, which leads to enhanced recovery for patients undergoing CABG surgery.
KARL STORZ SE & Co. (9.6%)
Renowned for precision engineering, KARL STORZ offers endoscopes and accessories that enable vessel harvesting with proficiency and durability alongside surgical performance.
Saphena Medical Inc. (7.5%)
Saphena Medical provides unitary EVH systems intended to simplify the harvesting procedure with the goal of decreasing operative time and improving patient recovery.
Beyond the leading companies, several other manufacturers contribute significantly to the market, enhancing product diversity and technological advancements. These include:
| Report Attributes | Details |
|---|---|
| Estimated Market Size (2025) | USD 577.1 million |
| Projected Market Size (2035) | USD 949 million |
| CAGR | 5.1% CAGR |
| Base Year for Estimation | 2024 |
| Historical Period | 2020 to 2024 |
| Forecast Period | 2025 to 2035 |
| Report Parameter | Revenue in USD million |
| Product Types Analyzed | Disposable EVH Systems, Reusable EVH Systems |
| Vessel Types Covered | Saphenous Vein, Radial Artery, Others |
| Applications Analyzed | Coronary Artery Bypass Grafting (CABG), Peripheral Artery Disease (PAD) |
| End Use Industries | Hospitals, Ambulatory Surgical Centers, Specialty Clinics |
| Regions Covered | North America, Latin America, Western Europe, Eastern Europe, East Asia, South Asia, Middle East & Africa |
| Countries Covered | United States, Japan, Germany, India, United Kingdom, France, Italy, Brazil, Canada, South Korea, Australia, Spain, Netherlands, Saudi Arabia, Switzerland |
| Top Segments Covered | By Product Type, By Application, By End Use |
| Top Growth Markets | Asia Pacific, Latin America |
| Key Players | Getinge AB, Terumo Corporation, Med Europe S.r.l., Saphena Medical, LivaNova PLC, Cardio Medical GmbH |
| Additional Attributes | Minimally invasive surgery trends, Cost-benefit analysis of reusable vs disposable, Regional regulatory insights |
| Customization & Pricing | Available upon request |
The global endoscopic vessel harvesting system industry is projected to witness CAGR of 5.1% between 2025 and 2035.
The global Endoscopic Vessel Harvesting System industry stood at USD 552.24 million in 2024.
The global rare neurological disease treatment industry is anticipated to reach USD 949 million by 2035 end.
China is expected to show a CAGR of 4.6% in the assessment period.
The key players operating in the global endoscopic vessel harvesting system industry are Getinge AB, Terumo Corporation, LivaNova PLC, KARL STORZ SE & Co., Saphena Medical Inc. and Other market players.
Table 1: Global Market Value (US$ Million) Forecast by Region, 2018 to 2033
Table 2: Global Market Volume (Units) Forecast by Region, 2018 to 2033
Table 3: Global Market Value (US$ Million) Forecast by Product Type, 2018 to 2033
Table 4: Global Market Volume (Units) Forecast by Product Type, 2018 to 2033
Table 5: North America Market Value (US$ Million) Forecast by Country, 2018 to 2033
Table 6: North America Market Volume (Units) Forecast by Country, 2018 to 2033
Table 7: North America Market Value (US$ Million) Forecast by Product Type, 2018 to 2033
Table 8: North America Market Volume (Units) Forecast by Product Type, 2018 to 2033
Table 9: Latin America Market Value (US$ Million) Forecast by Country, 2018 to 2033
Table 10: Latin America Market Volume (Units) Forecast by Country, 2018 to 2033
Table 11: Latin America Market Value (US$ Million) Forecast by Product Type, 2018 to 2033
Table 12: Latin America Market Volume (Units) Forecast by Product Type, 2018 to 2033
Table 13: Western Europe Market Value (US$ Million) Forecast by Country, 2018 to 2033
Table 14: Western Europe Market Volume (Units) Forecast by Country, 2018 to 2033
Table 15: Western Europe Market Value (US$ Million) Forecast by Product Type, 2018 to 2033
Table 16: Western Europe Market Volume (Units) Forecast by Product Type, 2018 to 2033
Table 17: Eastern Europe Market Value (US$ Million) Forecast by Country, 2018 to 2033
Table 18: Eastern Europe Market Volume (Units) Forecast by Country, 2018 to 2033
Table 19: Eastern Europe Market Value (US$ Million) Forecast by Product Type, 2018 to 2033
Table 20: Eastern Europe Market Volume (Units) Forecast by Product Type, 2018 to 2033
Table 21: South Asia and Pacific Market Value (US$ Million) Forecast by Country, 2018 to 2033
Table 22: South Asia and Pacific Market Volume (Units) Forecast by Country, 2018 to 2033
Table 23: South Asia and Pacific Market Value (US$ Million) Forecast by Product Type, 2018 to 2033
Table 24: South Asia and Pacific Market Volume (Units) Forecast by Product Type, 2018 to 2033
Table 25: East Asia Market Value (US$ Million) Forecast by Country, 2018 to 2033
Table 26: East Asia Market Volume (Units) Forecast by Country, 2018 to 2033
Table 27: East Asia Market Value (US$ Million) Forecast by Product Type, 2018 to 2033
Table 28: East Asia Market Volume (Units) Forecast by Product Type, 2018 to 2033
Table 29: Middle East and Africa Market Value (US$ Million) Forecast by Country, 2018 to 2033
Table 30: Middle East and Africa Market Volume (Units) Forecast by Country, 2018 to 2033
Table 31: Middle East and Africa Market Value (US$ Million) Forecast by Product Type, 2018 to 2033
Table 32: Middle East and Africa Market Volume (Units) Forecast by Product Type, 2018 to 2033
Figure 1: Global Market Value (US$ Million) by Product Type, 2023 to 2033
Figure 2: Global Market Value (US$ Million) by Region, 2023 to 2033
Figure 3: Global Market Value (US$ Million) Analysis by Region, 2018 to 2033
Figure 4: Global Market Volume (Units) Analysis by Region, 2018 to 2033
Figure 5: Global Market Value Share (%) and BPS Analysis by Region, 2023 to 2033
Figure 6: Global Market Y-o-Y Growth (%) Projections by Region, 2023 to 2033
Figure 7: Global Market Value (US$ Million) Analysis by Product Type, 2018 to 2033
Figure 8: Global Market Volume (Units) Analysis by Product Type, 2018 to 2033
Figure 9: Global Market Value Share (%) and BPS Analysis by Product Type, 2023 to 2033
Figure 10: Global Market Y-o-Y Growth (%) Projections by Product Type, 2023 to 2033
Figure 11: Global Market Attractiveness by Product Type, 2023 to 2033
Figure 12: Global Market Attractiveness by Region, 2023 to 2033
Figure 13: North America Market Value (US$ Million) by Product Type, 2023 to 2033
Figure 14: North America Market Value (US$ Million) by Country, 2023 to 2033
Figure 15: North America Market Value (US$ Million) Analysis by Country, 2018 to 2033
Figure 16: North America Market Volume (Units) Analysis by Country, 2018 to 2033
Figure 17: North America Market Value Share (%) and BPS Analysis by Country, 2023 to 2033
Figure 18: North America Market Y-o-Y Growth (%) Projections by Country, 2023 to 2033
Figure 19: North America Market Value (US$ Million) Analysis by Product Type, 2018 to 2033
Figure 20: North America Market Volume (Units) Analysis by Product Type, 2018 to 2033
Figure 21: North America Market Value Share (%) and BPS Analysis by Product Type, 2023 to 2033
Figure 22: North America Market Y-o-Y Growth (%) Projections by Product Type, 2023 to 2033
Figure 23: North America Market Attractiveness by Product Type, 2023 to 2033
Figure 24: North America Market Attractiveness by Country, 2023 to 2033
Figure 25: Latin America Market Value (US$ Million) by Product Type, 2023 to 2033
Figure 26: Latin America Market Value (US$ Million) by Country, 2023 to 2033
Figure 27: Latin America Market Value (US$ Million) Analysis by Country, 2018 to 2033
Figure 28: Latin America Market Volume (Units) Analysis by Country, 2018 to 2033
Figure 29: Latin America Market Value Share (%) and BPS Analysis by Country, 2023 to 2033
Figure 30: Latin America Market Y-o-Y Growth (%) Projections by Country, 2023 to 2033
Figure 31: Latin America Market Value (US$ Million) Analysis by Product Type, 2018 to 2033
Figure 32: Latin America Market Volume (Units) Analysis by Product Type, 2018 to 2033
Figure 33: Latin America Market Value Share (%) and BPS Analysis by Product Type, 2023 to 2033
Figure 34: Latin America Market Y-o-Y Growth (%) Projections by Product Type, 2023 to 2033
Figure 35: Latin America Market Attractiveness by Product Type, 2023 to 2033
Figure 36: Latin America Market Attractiveness by Country, 2023 to 2033
Figure 37: Western Europe Market Value (US$ Million) by Product Type, 2023 to 2033
Figure 38: Western Europe Market Value (US$ Million) by Country, 2023 to 2033
Figure 39: Western Europe Market Value (US$ Million) Analysis by Country, 2018 to 2033
Figure 40: Western Europe Market Volume (Units) Analysis by Country, 2018 to 2033
Figure 41: Western Europe Market Value Share (%) and BPS Analysis by Country, 2023 to 2033
Figure 42: Western Europe Market Y-o-Y Growth (%) Projections by Country, 2023 to 2033
Figure 43: Western Europe Market Value (US$ Million) Analysis by Product Type, 2018 to 2033
Figure 44: Western Europe Market Volume (Units) Analysis by Product Type, 2018 to 2033
Figure 45: Western Europe Market Value Share (%) and BPS Analysis by Product Type, 2023 to 2033
Figure 46: Western Europe Market Y-o-Y Growth (%) Projections by Product Type, 2023 to 2033
Figure 47: Western Europe Market Attractiveness by Product Type, 2023 to 2033
Figure 48: Western Europe Market Attractiveness by Country, 2023 to 2033
Figure 49: Eastern Europe Market Value (US$ Million) by Product Type, 2023 to 2033
Figure 50: Eastern Europe Market Value (US$ Million) by Country, 2023 to 2033
Figure 51: Eastern Europe Market Value (US$ Million) Analysis by Country, 2018 to 2033
Figure 52: Eastern Europe Market Volume (Units) Analysis by Country, 2018 to 2033
Figure 53: Eastern Europe Market Value Share (%) and BPS Analysis by Country, 2023 to 2033
Figure 54: Eastern Europe Market Y-o-Y Growth (%) Projections by Country, 2023 to 2033
Figure 55: Eastern Europe Market Value (US$ Million) Analysis by Product Type, 2018 to 2033
Figure 56: Eastern Europe Market Volume (Units) Analysis by Product Type, 2018 to 2033
Figure 57: Eastern Europe Market Value Share (%) and BPS Analysis by Product Type, 2023 to 2033
Figure 58: Eastern Europe Market Y-o-Y Growth (%) Projections by Product Type, 2023 to 2033
Figure 59: Eastern Europe Market Attractiveness by Product Type, 2023 to 2033
Figure 60: Eastern Europe Market Attractiveness by Country, 2023 to 2033
Figure 61: South Asia and Pacific Market Value (US$ Million) by Product Type, 2023 to 2033
Figure 62: South Asia and Pacific Market Value (US$ Million) by Country, 2023 to 2033
Figure 63: South Asia and Pacific Market Value (US$ Million) Analysis by Country, 2018 to 2033
Figure 64: South Asia and Pacific Market Volume (Units) Analysis by Country, 2018 to 2033
Figure 65: South Asia and Pacific Market Value Share (%) and BPS Analysis by Country, 2023 to 2033
Figure 66: South Asia and Pacific Market Y-o-Y Growth (%) Projections by Country, 2023 to 2033
Figure 67: South Asia and Pacific Market Value (US$ Million) Analysis by Product Type, 2018 to 2033
Figure 68: South Asia and Pacific Market Volume (Units) Analysis by Product Type, 2018 to 2033
Figure 69: South Asia and Pacific Market Value Share (%) and BPS Analysis by Product Type, 2023 to 2033
Figure 70: South Asia and Pacific Market Y-o-Y Growth (%) Projections by Product Type, 2023 to 2033
Figure 71: South Asia and Pacific Market Attractiveness by Product Type, 2023 to 2033
Figure 72: South Asia and Pacific Market Attractiveness by Country, 2023 to 2033
Figure 73: East Asia Market Value (US$ Million) by Product Type, 2023 to 2033
Figure 74: East Asia Market Value (US$ Million) by Country, 2023 to 2033
Figure 75: East Asia Market Value (US$ Million) Analysis by Country, 2018 to 2033
Figure 76: East Asia Market Volume (Units) Analysis by Country, 2018 to 2033
Figure 77: East Asia Market Value Share (%) and BPS Analysis by Country, 2023 to 2033
Figure 78: East Asia Market Y-o-Y Growth (%) Projections by Country, 2023 to 2033
Figure 79: East Asia Market Value (US$ Million) Analysis by Product Type, 2018 to 2033
Figure 80: East Asia Market Volume (Units) Analysis by Product Type, 2018 to 2033
Figure 81: East Asia Market Value Share (%) and BPS Analysis by Product Type, 2023 to 2033
Figure 82: East Asia Market Y-o-Y Growth (%) Projections by Product Type, 2023 to 2033
Figure 83: East Asia Market Attractiveness by Product Type, 2023 to 2033
Figure 84: East Asia Market Attractiveness by Country, 2023 to 2033
Figure 85: Middle East and Africa Market Value (US$ Million) by Product Type, 2023 to 2033
Figure 86: Middle East and Africa Market Value (US$ Million) by Country, 2023 to 2033
Figure 87: Middle East and Africa Market Value (US$ Million) Analysis by Country, 2018 to 2033
Figure 88: Middle East and Africa Market Volume (Units) Analysis by Country, 2018 to 2033
Figure 89: Middle East and Africa Market Value Share (%) and BPS Analysis by Country, 2023 to 2033
Figure 90: Middle East and Africa Market Y-o-Y Growth (%) Projections by Country, 2023 to 2033
Figure 91: Middle East and Africa Market Value (US$ Million) Analysis by Product Type, 2018 to 2033
Figure 92: Middle East and Africa Market Volume (Units) Analysis by Product Type, 2018 to 2033
Figure 93: Middle East and Africa Market Value Share (%) and BPS Analysis by Product Type, 2023 to 2033
Figure 94: Middle East and Africa Market Y-o-Y Growth (%) Projections by Product Type, 2023 to 2033
Figure 95: Middle East and Africa Market Attractiveness by Product Type, 2023 to 2033
Figure 96: Middle East and Africa Market Attractiveness by Country, 2023 to 2033


Our Research Products

The "Full Research Suite" delivers actionable market intel, deep dives on markets or technologies, so clients act faster, cut risk, and unlock growth.

The Leaderboard benchmarks and ranks top vendors, classifying them as Established Leaders, Leading Challengers, or Disruptors & Challengers.

Locates where complements amplify value and substitutes erode it, forecasting net impact by horizon

We deliver granular, decision-grade intel: market sizing, 5-year forecasts, pricing, adoption, usage, revenue, and operational KPIs—plus competitor tracking, regulation, and value chains—across 60 countries broadly.

Spot the shifts before they hit your P&L. We track inflection points, adoption curves, pricing moves, and ecosystem plays to show where demand is heading, why it is changing, and what to do next across high-growth markets and disruptive tech

Real-time reads of user behavior. We track shifting priorities, perceptions of today’s and next-gen services, and provider experience, then pace how fast tech moves from trial to adoption, blending buyer, consumer, and channel inputs with social signals (#WhySwitch, #UX).

Partner with our analyst team to build a custom report designed around your business priorities. From analysing market trends to assessing competitors or crafting bespoke datasets, we tailor insights to your needs.
Supplier Intelligence
Discovery & Profiling
Capacity & Footprint
Performance & Risk
Compliance & Governance
Commercial Readiness
Who Supplies Whom
Scorecards & Shortlists
Playbooks & Docs
Category Intelligence
Definition & Scope
Demand & Use Cases
Cost Drivers
Market Structure
Supply Chain Map
Trade & Policy
Operating Norms
Deliverables
Buyer Intelligence
Account Basics
Spend & Scope
Procurement Model
Vendor Requirements
Terms & Policies
Entry Strategy
Pain Points & Triggers
Outputs
Pricing Analysis
Benchmarks
Trends
Should-Cost
Indexation
Landed Cost
Commercial Terms
Deliverables
Brand Analysis
Positioning & Value Prop
Share & Presence
Customer Evidence
Go-to-Market
Digital & Reputation
Compliance & Trust
KPIs & Gaps
Outputs
Full Research Suite comprises of:
Market outlook & trends analysis
Interviews & case studies
Strategic recommendations
Vendor profiles & capabilities analysis
5-year forecasts
8 regions and 60+ country-level data splits
Market segment data splits
12 months of continuous data updates
DELIVERED AS:
PDF EXCEL ONLINE
Endoscopic Closure Systems Market Analysis - Size, Share, and Forecast Outlook 2025 to 2035
Cell Harvesting Systems Market Size and Share Forecast Outlook 2025 to 2035
Micro-energy Harvesting System Market Size and Share Forecast Outlook 2025 to 2035
Functional Endoscopic Sinus Surgery Systems Market Size and Share Forecast Outlook 2025 to 2035
Vessel Tracking Market Size and Share Forecast Outlook 2025 to 2035
Endoscopic Probe Disinfection Market Size and Share Forecast Outlook 2025 to 2035
Vessel Traffic Management Market Size and Share Forecast Outlook 2025 to 2035
System-On-Package Market Size and Share Forecast Outlook 2025 to 2035
Endoscopic Ultrasound Needles Market Size and Share Forecast Outlook 2025 to 2035
Systems Administration Management Tools Market Size and Share Forecast Outlook 2025 to 2035
Vessel-sealing Devices Market Trends - Growth & Forecast 2025 to 2035
Systemic Sclerosis Treatment Market - Trends & Forecast 2025 to 2035
System on Module Market Growth – Trends & Forecast 2025 to 2035
SLE Drugs Market Insights - Growth & Forecast 2025 to 2035
Vessel Retrofit Market Growth – Trends & Forecast 2024-2034
ERCP Devices Market Insights – Growth & Forecast 2024-2034
Systemic Mastocytosis Treatment Market
Systemic Infection Treatment Market
5G System Integration Market Insights - Demand & Growth Forecast 2025 to 2035
VRF Systems Market Growth - Trends & Forecast 2025 to 2035

Thank you!
You will receive an email from our Business Development Manager. Please be sure to check your SPAM/JUNK folder too.
Chat With
MaRIA