

- Market Size (2026)
- USD 1.1 Bn
- Forecast (2036)
- USD 1.9 Bn
- CAGR (2026 to 2036)
- 5.6%
Endurance Racing Vehicle Reliability Upgrade Services Market Size, Market Forecast and Outlook By FMI
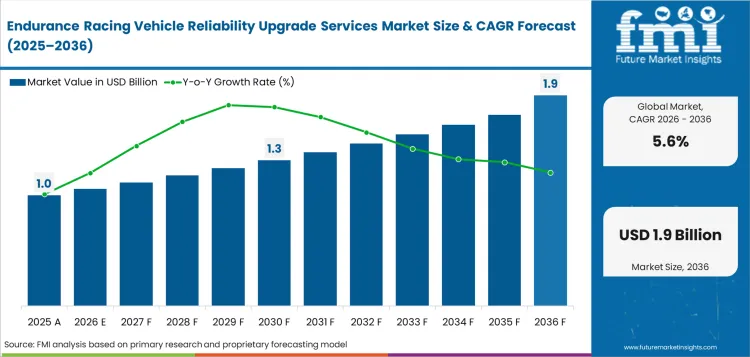
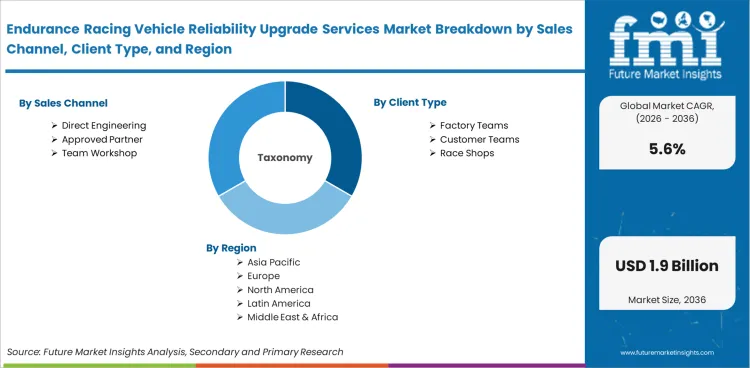
The endurance racing vehicle reliability upgrade services market was valued at USD 1.0 billion in 2025. The market is estimated at USD 1.1 billion by 2026-end and expand at a CAGR of 5.6% between 2026 and 2036 to reach USD 1.9 billion by 2036. Direct engineering is expected to account for a 57.0% sales channel share, and factory teams are expected to lead the client type segment with a 46.0% share.
Summary of the Endurance Racing Vehicle Reliability Upgrade Services Market
- Demand and Growth Drivers
- Longer race formats push teams to strengthen cooling systems and fault checks before cars enter race-weekend schedules.
- Hypercar programs need direct engineering support as hybrid components require careful review before major endurance events.
- GT3 customer teams create repeat service work between rounds through approved reliability upgrades and race-readiness checks.
- Product and Segment View
- Direct engineering is projected to hold 57.0% share in 2026 as teams need closer control over setup changes before race events.
- Factory teams are expected to account for 46.0% of client type demand in 2026, backed by larger budgets for season-long reliability work.
- Powertrain upgrades hold high-value service demand since long race stints place sustained stress on cooling systems and driveline components.
- Geography and Company Outlook
- France is expected to record a CAGR of 6.8% through 2036, driven by Le Mans activity and prototype service depth.
- The USA is projected to expand at 6.3% CAGR by 2036, as IMSA endurance programs create repeat upgrade work.
- Companies combining race platform skill with trackside engineering access are strengthening their market position during the forecast period.
- Analyst Opinion
- Nikhil Kaitwade, Principal Consultant for Automotive at FMI, says, “Endurance reliability work is becoming planned service spending for race teams seeking fewer preventable failures. Teams need powertrain durability records with brake stability checks. Factory programs protect championship points while customer teams need proven upgrades under strict race rules.”
- Endurance Racing Vehicle Reliability Upgrade Services Market Value Analysis
- The endurance racing vehicle reliability upgrade services market is moving from reactive repair work into an upgrade service base.
- Race finish risk across engines and electrical systems is increasing the need for planned reliability upgrades.
- Broader use of automotive engineering services is helping regulated motorsport programs improve reliability planning and race preparation.
- Demand is reinforced by the need for service records meeting race rules. These records help teams protect setup timing and limit rework before events.
Key Takeaways, Market Size and Forecast
- The endurance racing vehicle reliability upgrade services market was valued at USD 1.0 billion in 2025.
- By 2036, the endurance racing vehicle reliability upgrade services market is projected to reach USD 1.9 billion.
- From 2026 to 2036, the market is projected to expand at a CAGR of 5.6%.
- The market is projected to create an incremental opportunity of USD 0.8 billion between 2026 and 2036.
- In 2026, direct engineering is expected to account for 57.0% of sales channel demand.
- France at 6.8% and the USA at 6.3% are two of the faster growing country markets.
Race teams invest in reliability upgrades to avoid one basic risk: a small part failure can end an expensive race weekend. The 2026 FIA WEC entry list includes 14 major manufacturers, so service partners need experience across many race platforms. FIA extended Hypercar homologation until the end of 2032, which helps teams plan upgrades across several seasons. Bosch Motorsport describes Le Mans as a race with speeds above 300 km/h. Cars cover almost 5,000 km in 24 hours and run at 85% full throttle. These conditions make data checks and fault reviews important before race day. Suppliers with deep race data skills and proven upgrade records are better placed to win repeat service work.
Endurance Racing Vehicle Reliability Upgrade Services Market Definition
The endurance racing vehicle reliability upgrade services market includes engineering and service work used to improve race finish probability before endurance events. These services assess powertrain durability, brake stability, cooling capacity, chassis wear, and electronic fault risk for professional race cars. Scope includes pre-race build checks, mid-season reliability upgrades, post-race teardown, and trackside service work. Finished race car manufacturing and normal road vehicle repair are outside the scope.
Endurance Racing Vehicle Reliability Upgrade Services Market Inclusions
Market scope covers all commercially traded endurance racing vehicle reliability upgrade services categorized by sales channel, including direct engineering, approved partner, team workshop, trackside contract, and digital review; client type, including factory teams, customer teams, race shops, OEM programs, and private entries; service type, including powertrain upgrades, cooling upgrades, brake upgrades, suspension upgrades, and electrical upgrades; vehicle class, including Hypercar, LMP2, GT3, GT4, and rally raid; and service stage, including pre-race build, mid-season upgrade, post-race overhaul, trackside service, and data review. Revenue scope covers 2026 to 2036. Key stakeholders include motorsport engineering firms, race teams, OEM motorsport divisions, component suppliers, braking system specialists, drivetrain providers, electronics and sensor companies, trackside service partners, race series organizers, testing facilities, distributors, and regulatory bodies.
Endurance Racing Vehicle Reliability Upgrade Services Market Exclusions
Scope does not include standard passenger vehicle servicing, cosmetic racing work, driver coaching, fuel sales, tire supply, or finished race vehicle sales.
Endurance Racing Vehicle Reliability Upgrade Services Market Research Methodology
- Primary Research: FMI analysts spoke to race teams, motorsport engineering firms, component specialists, and trackside service providers in important markets.
- Desk Research: Combined data from racing regulations, official entry lists, service portfolios, and vehicle platform requirements.
- Market sizing and forecasting: Added service demand across vehicle classes and service stages from the bottom up.
- Data validation: Cross-checked every 3 months against race program activity and company service coverage.
Why is the Endurance Racing Vehicle Reliability Upgrade Services Market Growing?
- Teams are using reliability upgrades earlier to reduce retirement risk before endurance race weekends begin.
- Engineering partners are becoming important as cars combine hybrid systems, high-load brakes, and high-load cooling packages.
- Customer teams are outsourcing complex checks to specialists with approved parts and race-weekend documentation systems.
Race programs need better pre-race evidence as long-distance events turn small faults into race-ending failures. The 2026 FIA WEC provisional entry list includes 17 Hypercars and 18 LMGT3 entries across the full-season grid. This mix increases the need for validated cooling work and detailed brake checks across different vehicle platforms. It requires thorough electronics reviews to ensure consistent performance and safety compliance. Service providers with direct engineering access gain value as teams require faster and better-informed decisions. These decisions are needed before transport and setup approval during critical race weekend checks.
Race distance keeps reliability work central to endurance preparation. The winning car at the 2025 24 Hours of Le Mans covered 5,272.54 km at an average speed of 219.3 kph across 387 laps. These operating conditions place sustained stress on powertrain systems and control hardware. Suppliers benefit from repeat service work as teams need evidence-based upgrades before vehicles face long race runs.
Market Segmentation Analysis
- Direct engineering is projected to hold 57.0% of the sales channel segment in 2026 as factory and prototype teams need supplier-side setup control.
- Factory teams are expected to account for 46.0% of client type spending in 2026 through larger budgets for validation and season-long reliability programs.
- Powertrain upgrades are forecast to represent 38.5% of service type revenue in 2026 as long stints expose engine heat and driveline stress.
- Hypercar is expected to capture 34.0% of vehicle class activity in 2026 with hybrid systems requiring deeper reliability checks.
- Pre-race build is projected to hold 41.0% of service stage share in 2026 as teams complete planned checks before travel and scrutineering.
The market for endurance racing vehicle reliability upgrade services is divided into groups based on sales channel, client type, service type, vehicle class, service stage, and region. By sales channel, the market includes direct engineering, approved partner, team workshop, trackside contract, and digital review. By client type, the market covers factory teams, customer teams, race shops, OEM programs, and private entries. Based on service type, it includes powertrain upgrades, cooling upgrades, brake upgrades, suspension upgrades, and electrical upgrades. By vehicle class, the market includes Hypercar, LMP2, GT3, GT4, and rally raid. By service stage, the market is segmented into pre-race build, mid-season upgrade, post-race overhaul, trackside service, and data review.
Insights into Endurance Racing Vehicle Reliability Upgrade Services Market by Sales Channel
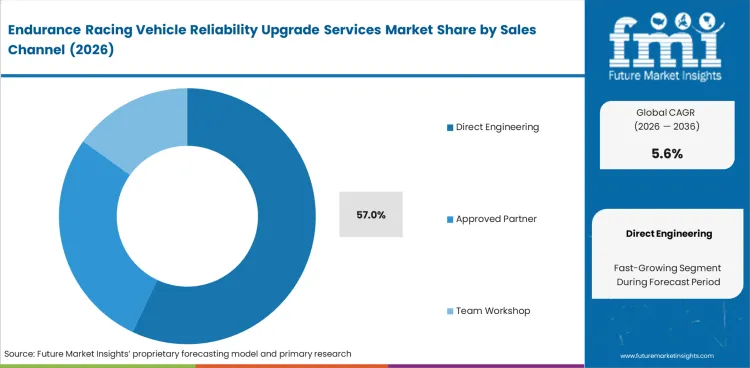
- Direct engineering is projected to account for 57.0% of sales channel demand in 2026. Race teams prefer direct supplier access for setup control and fast fault review before events.
- Direct engineering service supports complex race preparation cycles. Teams use this channel for approved changes across cooling systems and vehicle behavior checks.
Insights into Endurance Racing Vehicle Reliability Upgrade Services Market by Client Type
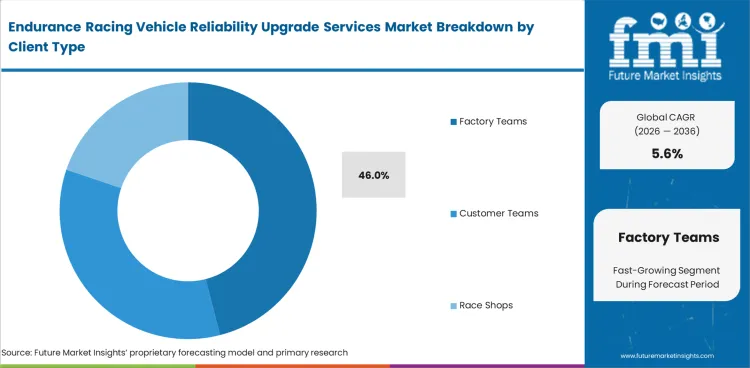
- Factory teams are expected to account for 46.0% of client type demand in 2026. Works programs carry larger service budgets for reliability planning across full-season racing.
- Factory-backed teams invest in deeper validation before race weekends. Reliability service helps protect championship points and reduce avoidable technical retirements.
Insights into Endurance Racing Vehicle Reliability Upgrade Services Market by Service Type
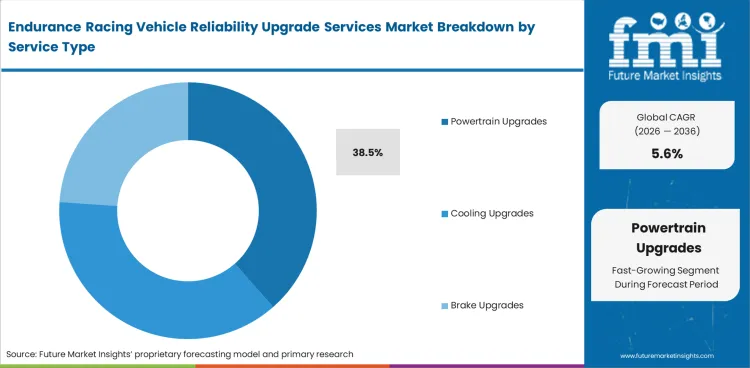
- Powertrain upgrades are projected to represent 38.5% of service type demand in 2026. Long endurance stints require improved heat control and driveline reliability.
- Powertrain service covers engine durability checks and cooling package refinement. Teams need proven upgrade records before approving changes for race use.
Insights into Endurance Racing Vehicle Reliability Upgrade Services Market by Vehicle Class
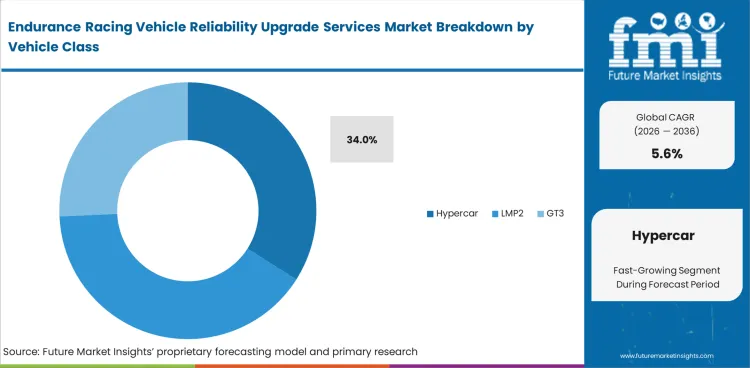
- Hypercar is forecast to account for 34.0% of vehicle class demand in 2026. Hybrid prototype programs need deeper reliability work across electrical and mechanical systems.
- Hypercar service demand is shaped by platform rules and complex race systems. Suppliers need deep experience across battery checks and control system review.
Insights into Endurance Racing Vehicle Reliability Upgrade Services Market by Service Stage
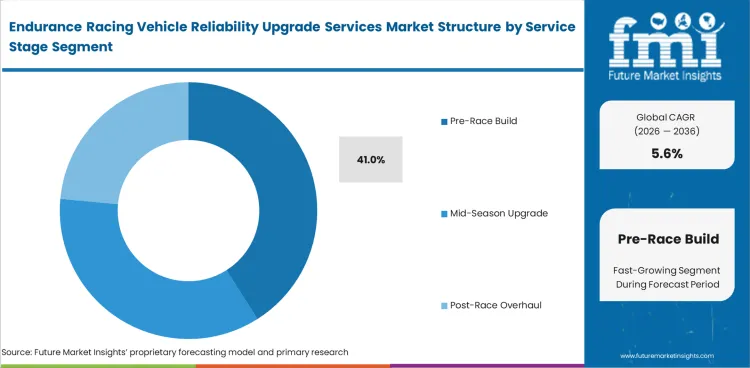
- Pre-race build is projected to hold 41.0% share of service stage demand in 2026. Teams prefer early reliability checks before travel and race-weekend setup work.
- Pre-race service reduces avoidable failure risk before scrutineering. Demand covers cooling review and brake system checks used across endurance race preparation.
Endurance Racing Vehicle Reliability Upgrade Services Market Drivers, Restraints, and Opportunities
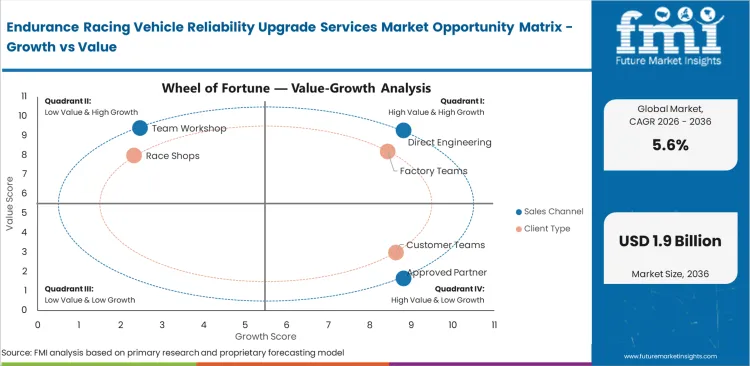
- Race finish pressure is creating demand for reliability evidence across higher-cost endurance vehicle programs.
- The requirement for skilled engineers and approved spares increases pricing pressure for smaller customer teams.
- Hybrid platforms improve service opportunity through electrical safety checks and data review needs.
Endurance racing vehicle reliability upgrade services continue to grow as race teams demand fewer preventable failures. This demand covers powertrain and braking systems during long distance endurance racing events. It includes cooling and electrical systems where failures can disrupt team performance. Cost pressure and strict race rules can slow full-service adoption among customer teams. Growth continues through direct engineering support and pre-race reliability programs.
Track-Side Capacity Premiums Are Hardening
Reliability upgrade pricing is being pushed upward by event density as the primary driver beyond simple parts inflation. In January 2025 IMSA’s official Rolex 24 at Daytona entry list indicated 61 total entries. The list included 12 GTP and 12 LMP2 prototypes which created a large pre-race service queue. This queue covered gearbox refreshes and cooling validation before the endurance event. It required wiring inspection and brake endurance packages to ensure race readiness.
Failure mode diagnostics became required as teams worked to prevent breakdowns during competition. For service providers, this concentration compresses lead times and increases operational pressure. Teams pay more for dyno slots and overnight machining to meet strict preparation timelines. They invest in spares kitting and trackside engineering availability before a 24-hour race. Buyers should expect firmer prices for short-notice reliability packages, and teams booking rebuild windows earlier can negotiate better bundled inspection and parts-replacement rates.
Tariff Exposure Is Lifting Upgrade Quotes
USA-based reliability upgrade shops are repricing around imported component exposure across endurance vehicle programs. This impact is strongest where vehicles rely on specialist European engines and transmissions. It affects components such as dampers and sensors used in high-performance systems. Carbon-fiber assemblies further increase pricing pressure due to cost and sourcing complexity. In May 2025, the Federal Register confirmed that Proclamation 10908 imposed a 25% tariff on certain imports of automobiles effective April 3, 2025, and certain auto parts effective May 3, 2025.
Even when racing components are sourced through specialist channels quote discipline changes. Suppliers must price landed cost uncertainty and account for customs documentation requirements in rebuild kits. They include non-US content risk in pricing to manage potential compliance exposure. The practical outcome is not uniform inflation; it is a sharper spread between domestic-source upgrade packages and imported, homologation-sensitive reliability parts.
Analysis of Endurance Racing Vehicle Reliability Upgrade Services Market By Key Countries
.webp "Top Country Growth Comparison Endurance Racing Vehicle Reliability Upgrade Services Market Cagr (2026 2036)")
| Country | CAGR |
|---|---|
| France | 6.8% |
| USA | 6.3% |
| Italy | 6.0% |
| Japan | 5.6% |
| Germany | 5.1% |
Source: Future Market Insights, 2026.
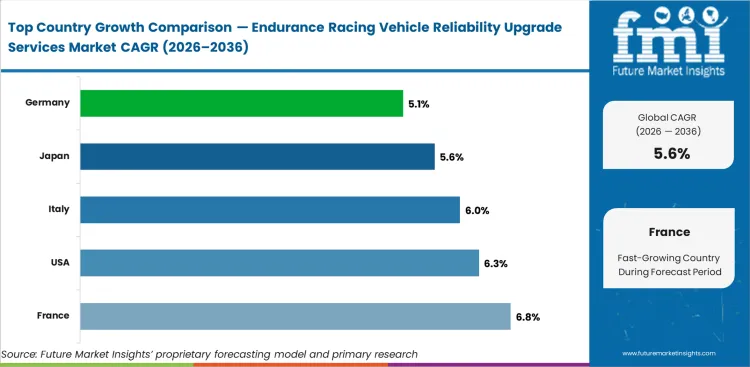
Endurance Racing Vehicle Reliability Upgrade Services Market CAGR Analysis By Country
- France records the fastest country outlook at 6.8% CAGR, helped by Le Mans activity and deeper prototype service capacity.
- The USA is projected to expand at 6.3% CAGR during 2026 to 2036 as IMSA endurance events create repeat work for GT and prototype teams.
- Italy’s forecast stands at 6.0% CAGR, supported by Ferrari prototype programs and specialist race engineering capacity.
- Japan is expected to advance at 5.6% CAGR over the assessment period, with Toyota hybrid endurance experience strengthening reliability service needs.
- Germany is forecast at 5.1% CAGR by 2036 as mature GT racing suppliers support measured expansion across endurance platforms.
Demand for endurance racing vehicle reliability upgrade services is forecast to rise at 5.6% CAGR from 2026 to 2036. Country-level analysis covers major markets in this forecast, with the key markets listed below.
Demand Outlook for Endurance Racing Vehicle Reliability Upgrade Services Market in France
France’s endurance racing vehicle reliability upgrade services industry is projected to record a CAGR of 6.8% through 2036. France benefits from Le Mans as a central race platform and service reference point. ACO stated in March 2025 the field comprised 62 cars for the 93rd 24 Hours of Le Mans. This full grid backs demand for France endurance racing vehicle reliability upgrade services. Local specialists can gain from teams needing credible checks before the biggest race week.
- Circuit de la Sarthe supports concentrated pre-race service demand across Hypercar and LMGT3 programs.
- Automobile Club de l’Ouest race rules reinforce demand for documented reliability checks before Le Mans.
- Le Mans-based race activity helps suppliers connect workshop service with trackside engineering needs.
Sales Analysis of Endurance Racing Vehicle Reliability Upgrade Services Market in the USA
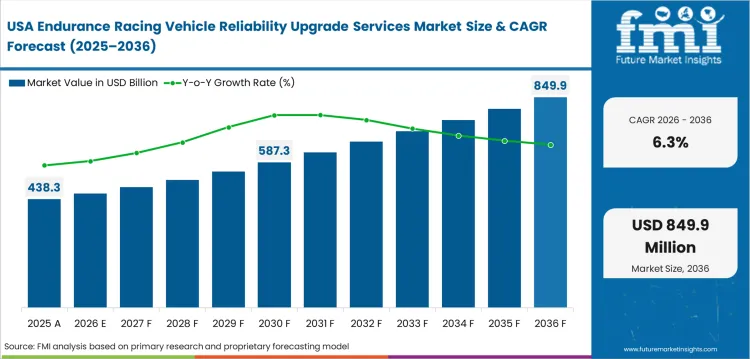
The endurance racing vehicle reliability upgrade services sector in the USA is expected to expand at a CAGR of 6.3% during the assessment period. IMSA endurance scheduling increases repeat service demand for USA endurance racing vehicle reliability upgrade services. The 2026 IMSA WeatherTech schedule includes the 24 Hours at Daytona, 12 Hours of Sebring, 6 Hours of Watkins Glen, 6 Hours at Road America, and 10 Hours at Road Atlanta. Service providers benefit from teams needing planned checks across long-distance events.
- Daytona International Speedway increases early-season pressure for complete reliability checks before Rolex 24 programs.
- Sebring International Raceway adds high-vibration stress, which increases demand for suspension and chassis review.
- Michelin Raceway Road Atlanta raises late-season service demand through Petit Le Mans preparation.
Demand Outlook for Endurance Racing Vehicle Reliability Upgrade Services Market in Italy
The Italy endurance racing vehicle reliability upgrade services industry is forecast to grow at a CAGR of 6.0% by 2036. Ferrari prototype activity gives Italy a strong role in endurance engineering. Ferrari stated in February 2025 the 499P would keep the same technical configuration used in the second half of the prior season. This boosts demand for Italy endurance racing vehicle reliability upgrade services as teams refine reliability inside stable race architecture.
- Maranello-based prototype work increases demand for high-skill thermal and driveline reviews.
- Ferrari AF Corse activity strengthens local know-how across hybrid endurance race programs.
- Italian suppliers benefit from close links between race engineering and thermal management work.
Opportunity Analysis of Endurance Racing Vehicle Reliability Upgrade Services Market in Japan
The endurance racing vehicle reliability upgrade services segment in Japan is projected to advance at 5.6% CAGR over the forecast years. Toyota’s endurance activity creates a strong base for Japan endurance racing vehicle reliability upgrade services. Toyota Gazoo Racing lists the GR010 Hybrid with a 7-gear sequential gearbox and carbon ventilated brake discs. This vehicle complexity increases need for powertrain and brake reliability review across long-distance racing.
- Fuji Speedway favors domestic reference demand through Japan’s annual WEC round.
- Toyota Gazoo Racing activity reinforces demand for hybrid reliability and regenerative braking system expertise.
- Japanese component depth helps service firms address sensors and control hardware under race conditions.
Demand Outlook for Endurance Racing Vehicle Reliability Upgrade Services Market in Germany
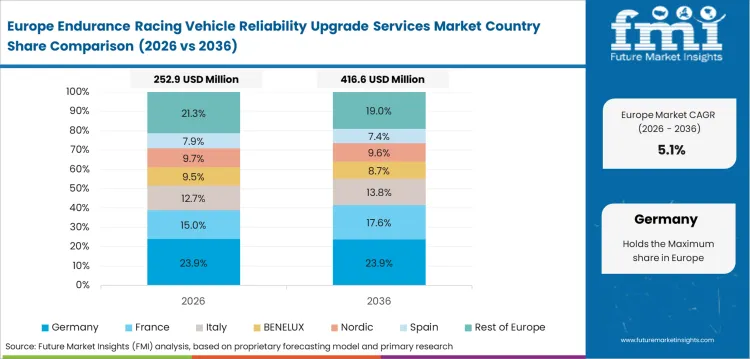
The Germany endurance racing vehicle reliability upgrade services industry is expected to post 5.1% CAGR through 2036. Germany has a mature motorsport supplier base across GT and prototype racing. FIA WEC stated in December 2025 Manthey clinched the LMGT3 crown in both seasons since the class introduction in 2024. This favors demand for Germany endurance racing vehicle reliability upgrade services as teams seek repeatable GT3 reliability packages. Service providers with fast setup review and documented race records can help customer programs.
- Nürburgring activity creates a deep service base for high-load endurance vehicle preparation.
- Manthey’s LMGT3 race record reinforces German depth in customer racing service programs.
- German suppliers gain from automotive brake system & components expertise across GT platforms.
Company Positioning and Strategic Context
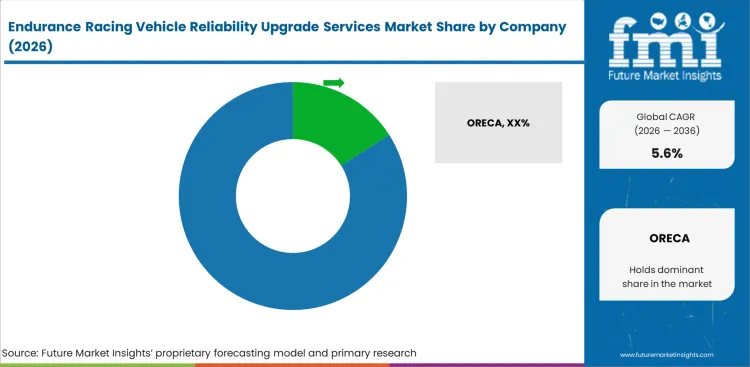
- ORECA is positioned strongly through prototype race platforms and long experience preparing LMP cars for endurance programs.
- Multimatic Motorsports and Dallara compete on chassis development and race program execution across prototype and GT3 entries.
- Bosch Motorsport and Xtrac add specialist value through electronics control and drivetrain reliability for high-stress race platforms.
Race teams judge service partners by proven race work and quick fault resolution before events. ORECA has high LMP exposure and deep race preparation knowledge across prototype programs globally. Multimatic Motorsports brings GT3 and prototype engineering experience for customer programs and factory-backed entries worldwide. Dallara contributes chassis knowledge shaped by long-distance vehicle behavior and demanding race conditions. Brembo Racing and Cosworth add strength through braking systems and control system capability.
Entry barriers are high as teams avoid unproven changes close to race dates. Service providers need documented upgrade work and fast technical response during short preparation windows. Teams usually prefer partners able to combine powertrain evidence with braking stability in one service plan. Repeat work is most likely for suppliers with race history and broad specialist coverage.
Key Companies in the Endurance Racing Vehicle Reliability Upgrade Services Market
Key global companies active in the endurance racing vehicle reliability upgrade services market include:
- ORECA, Multimatic Motorsports, and Dallara have strong race platform infrastructure for endurance service design and global program delivery.
- Bosch Motorsport and Xtrac serve race teams through electronic control coverage and drivetrain service reporting.
- Brembo Racing and Cosworth hold specialist positions across braking reliability, engine control, and race electronics services.
Company Benchmarking: Endurance Racing Vehicle Reliability Upgrade Services Market
| Company | Geographic Footprint | Race Platform Depth | Trackside Data Skill | Upgrade Portfolio Breadth |
|---|---|---|---|---|
| ORECA | France-led footprint with international race program reach | High | High | Strong |
| Multimatic Motorsports | North America, UK, Europe, and Asia | High | High | Strong |
| Dallara | Italy-led footprint with international engineering presence | High | Medium | Strong |
| Bosch Motorsport | Germany-led footprint with global motorsport customer reach | Medium | High | Strong |
| Xtrac | UK, USA, and Austria | Medium | Medium | Strong |
| Brembo Racing | Europe, America, and Asia | Medium | Medium | Strong |
| Cosworth | UK and USA | Medium | High | Moderate |
Source: Future Market Insights, 2026.
Key Developments in Endurance Racing Vehicle Reliability Upgrade Services Market
- In May 2024, BMW introduced the BMW M4 GT3 EVO before the 24 Hours at the Nürburgring, with development focused on drivability and efficiency while maintaining strong reliability alongside overall performance goals.The upgrade package included new front and rear anti-roll bars, larger rear brake discs, and a finer differential setup to reduce tyre and brake wear during longer stints. The upgrade package supports OEM-led reliability engineering being converted into customer-facing packages for GT and endurance racing teams.
- In August 2025, Porsche introduced the model-year 2026 911 GT3 R with updated suspension, aerodynamics, steering cooling, ceramic wheel bearings, driveshaft installation updates, and endurance-focused equipment packages. Porsche stated existing 911 GT3 R cars can be upgraded through update kits, making this directly relevant to reliability upgrade services for endurance racing fleets. The development supports demand for retrofit packages that improve braking predictability, component durability, thermal stability, and long-distance operating consistency.
Key Players in the Endurance Racing Vehicle Reliability Upgrade Services Market
Major Global Players:
- ORECA
- Multimatic Motorsports
- Dallara
- Bosch Motorsport
- Xtrac
Specialist Players:
- Brembo Racing
- Cosworth
Report Scope and Coverage
| Parameter | Details |
|---|---|
| Quantitative Units | USD 1.1 billion to USD 1.9 billion, at a CAGR of 5.6% |
| Market Definition | The endurance racing vehicle reliability upgrade services market encompasses engineering service work used to improve race finish probability before endurance events. |
| Regions Covered | North America, Latin America, Europe, East Asia, South Asia and Pacific, Middle East and Africa |
| Countries Covered | USA, UK, Germany, France, Italy, Japan, China, and 30 plus countries |
| Key Companies Profiled | ORECA, Multimatic Motorsports, Dallara, Bosch Motorsport, Xtrac, Brembo Racing, Cosworth |
| Forecast Period | 2026 to 2036 |
| Approach | Hybrid bottom-up and top-down methodology starting with service demand and verified race program activity. |
Endurance Racing Vehicle Reliability Upgrade Services Market by Segments
Endurance Racing Vehicle Reliability Upgrade Services Market Segmented by Sales Channel:
- Direct Engineering
- Approved Partner
- Team Workshop
- Trackside Contract
- Digital Review
Endurance Racing Vehicle Reliability Upgrade Services Market Segmented by Client Type:
- Factory Teams
- Customer Teams
- Race Shops
- OEM Programs
- Private Entries
Endurance Racing Vehicle Reliability Upgrade Services Market Segmented by Service Type:
- Powertrain Upgrades
- Cooling Upgrades
- Brake Upgrades
- Suspension Upgrades
- Electrical Upgrades
Endurance Racing Vehicle Reliability Upgrade Services Market Segmented by Vehicle Class:
- Hypercar
- LMP2
- GT3
- GT4
- Rally Raid
Endurance Racing Vehicle Reliability Upgrade Services Market Segmented by Service Stage:
- Pre-Race Build
- Mid-Season Upgrade
- Post-Race Overhaul
- Trackside Service
- Data Review
Endurance Racing Vehicle Reliability Upgrade Services Market Segmented by Region:
- North America; USA; Canada; Mexico
- Latin America; Brazil; Chile; Rest of Latin America
- Europe; Germany; UK; Italy; Spain; France; Rest of Europe
- East Asia; China; Japan; South Korea
- South Asia and Pacific; India; ASEAN; Australia and New Zealand; Rest of South Asia and Pacific
- Middle East and Africa; Saudi Arabia; Other GCC Countries; South Africa; Rest of Middle East and Africa
Research Sources and Bibliography
- Federation Internationale de l’Automobile. (2025, June). WEC: Hypercar’s winning formula extended. (fia.com)
- FIA World Endurance Championship. (2025, December). Major global marques headline 2026 FIA WEC entry list. (fiawec.com)
- Automobile Club de l’Ouest. (2025, March). 2025 24 Hours of Le Mans: The entry list in numbers. (24h-lemans.com)
- Automobile Club de l’Ouest. (2025, June). 2025 24 Hours of Le Mans: Key figures before the start. (24h-lemans.com)
- IMSA. (2026, May). 2026 IMSA WeatherTech SportsCar Championship schedule. (imsa.com)
- Toyota Gazoo Racing. (2025, April). GR010 Hybrid car details. (toyotagazooracing.com)
- Ford Racing. (2025, January). Ford Mustang GT3 earns milestone first global victory at Daytona. (fordracing.com)
- Ferrari. (2025, February). Ferrari unveils 2025 livery of 499P numbers 50 and 51. (ferrari.com)
- Stellantis Media. (2024, March). 2024 PEUGEOT 9X8 unveils its new silhouette. (media.stellantis.com)
- Federation Internationale de l’Automobile. (2025, June 13). WEC: Hypercar’s winning formula extended.
- Bosch Motorsport. (2024). The Le Mans story: Technology from Bosch.
- International Trade Administration, Department of Commerce. (2025, May 20). Procedures for Submissions by Importers of Automobiles Qualifying for Preferential Tariff Treatment Under the USMCA To Determine USA Content. Federal Register.
- International Motor Sports Association. (2025, January 22). The Rolex 24 at Daytona: Daytona International Speedway - Daytona Beach, Florida: Official entry list. 2025_IWSC_Rolex24_Official_EntryList.pdf
- Porsche AG. (2025, August 8). Porsche customer teams can rely on updated 911 GT3 R from 2026 [Press release].
- BMW Group. (2024, May 29). Presentation of the BMW M4 GT3 EVO at the Nürburgring: BMW M Motorsport makes the successful model even better [Press release]. Presentation of the BMW M4 GT3 EVO at the Nürburgring: BMW M Motorsport makes the successful model even better.
- FIA World Endurance Championship. (2025). FIA WEC 2026 provisional entry list.
- Automobile Club de l’Ouest. (2025, June 16). 24 Hours of Le Mans - this year’s facts and figures. 24 Heures du Mans.
This bibliography is provided for reader reference and is not exhaustive. The full report contains the complete reference list and detailed citations.
This Report Answers
- What is the current and future size of the endurance racing vehicle reliability upgrade services market?
- How fast is the endurance racing vehicle reliability upgrade services market expected to expand between 2026 and 2036?
- Which sales channel is expected to lead the market by 2026?
- Which client type segment is expected to account for the top demand by 2026?
- What factors are driving demand for endurance racing vehicle reliability upgrade services globally?
- How are race rules influencing adoption of direct reliability engineering services?
- Why are factory teams the main demand base for reliability upgrade services?
- How are hybrid endurance vehicles creating demand for specialized validation work?
- Which countries are projected to record faster expansion through 2036?
- What is driving market expansion in France and the USA?
- Who are the key companies active in the endurance racing vehicle reliability upgrade services market?
- How does FMI estimate and validate the market forecast?
Frequently Asked Questions
What is the global market demand for endurance racing vehicle reliability upgrade services in 2026?
In 2026, the global market for endurance racing vehicle reliability upgrade services is estimated at USD 1.1 billion.
How big will the market for endurance racing vehicle reliability upgrade services be in 2036?
By 2036, the market for endurance racing vehicle reliability upgrade services is projected to reach USD 1.9 billion.
How much is demand for endurance racing vehicle reliability upgrade services expected to expand between 2026 and 2036?
Between 2026 and 2036, demand for endurance racing vehicle reliability upgrade services is expected to expand at a CAGR of 5.6%.
Which sales channel segment is expected to lead globally by 2026?
Direct Engineering is expected to account for 57.0% of the sales channel segment in 2026.
What is causing demand to rise in France?
The France endurance racing vehicle reliability upgrade services market is projected to record 6.8% CAGR through 2036, backed by Le Mans activity and prototype engineering depth.
What is causing demand to rise in the USA?
The USA endurance racing vehicle reliability upgrade services market is projected to expand at 6.3% CAGR through 2036, backed by IMSA endurance events and factory GT programs.
What does this report mean by Endurance Racing Vehicle Reliability Upgrade Services Market definition?
The endurance racing vehicle reliability upgrade services market includes engineering work used to improve race finish probability before endurance events.
How does FMI make the Endurance Racing Vehicle Reliability Upgrade Services forecast and check it?
FMI uses a hybrid bottom-up and top-down approach, starting with service demand and checking it against race program activity.
Preview the report firsthand - request a free sample
Get SampleGet the brochure for pricing and purchase details.
Get PDFTable of Content
- Executive Summary
- Global Market Outlook
- Demand-side Trends
- Supply-side Trends
- Technology Roadmap Analysis
- Analysis and Recommendations
- Market Overview
- Market Coverage / Taxonomy
- Market Definition / Scope / Limitations
- Research Methodology
- Chapter Orientation
- Analytical Lens and Working Hypotheses
- Market Structure, Signals, and Trend Drivers
- Benchmarking and Cross-market Comparability
- Market Sizing, Forecasting, and Opportunity Mapping
- Research Design and Evidence Framework
- Desk Research Programme (Secondary Evidence)
- Company Annual and Sustainability Reports
- Peer-reviewed Journals and Academic Literature
- Corporate Websites, Product Literature, and Technical Notes
- Earnings Decks and Investor Briefings
- Statutory Filings and Regulatory Disclosures
- Technical White Papers and Standards Notes
- Trade Journals, Industry Magazines, and Analyst Briefs
- Conference Proceedings, Webinars, and Seminar Materials
- Government Statistics Portals and Public Data Releases
- Press Releases and Reputable Media Coverage
- Specialist Newsletters and Curated Briefings
- Sector Databases and Reference Repositories
- FMI Internal Proprietary Databases and Historical Market Datasets
- Subscription Datasets and Paid Sources
- Social Channels, Communities, and Digital Listening Inputs
- Additional Desk Sources
- Expert Input and Fieldwork (Primary Evidence)
- Primary Modes
- Qualitative Interviews and Expert Elicitation
- Quantitative Surveys and Structured Data Capture
- Blended Approach
- Why Primary Evidence is Used
- Field Techniques
- Interviews
- Surveys
- Focus Groups
- Observational and In-context Research
- Social and Community Interactions
- Stakeholder Universe Engaged
- C-suite Leaders
- Board Members
- Presidents and Vice Presidents
- R&D and Innovation Heads
- Technical Specialists
- Domain Subject-matter Experts
- Scientists
- Physicians and Other Healthcare Professionals
- Governance, Ethics, and Data Stewardship
- Research Ethics
- Data Integrity and Handling
- Primary Modes
- Tooling, Models, and Reference Databases
- Desk Research Programme (Secondary Evidence)
- Data Engineering and Model Build
- Data Acquisition and Ingestion
- Cleaning, Normalisation, and Verification
- Synthesis, Triangulation, and Analysis
- Quality Assurance and Audit Trail
- Market Background
- Market Dynamics
- Drivers
- Restraints
- Opportunity
- Trends
- Scenario Forecast
- Demand in Optimistic Scenario
- Demand in Likely Scenario
- Demand in Conservative Scenario
- Opportunity Map Analysis
- Product Life Cycle Analysis
- Supply Chain Analysis
- Investment Feasibility Matrix
- Value Chain Analysis
- PESTLE and Porter’s Analysis
- Regulatory Landscape
- Regional Parent Market Outlook
- Production and Consumption Statistics
- Import and Export Statistics
- Market Dynamics
- Global Market Analysis 2021 to 2025 and Forecast, 2026 to 2036
- Historical Market Size Value (USD Million) Analysis, 2021 to 2025
- Current and Future Market Size Value (USD Million) Projections, 2026 to 2036
- Y-o-Y Growth Trend Analysis
- Absolute $ Opportunity Analysis
- Global Market Pricing Analysis 2021 to 2025 and Forecast 2026 to 2036
- Global Market Analysis 2021 to 2025 and Forecast 2026 to 2036, By Product Type
- Introduction / Key Findings
- Historical Market Size Value (USD Million) Analysis By Product Type , 2021 to 2025
- Current and Future Market Size Value (USD Million) Analysis and Forecast By Product Type , 2026 to 2036
- Joven
- Reposado
- Anejo
- Joven
- Y-o-Y Growth Trend Analysis By Product Type , 2021 to 2025
- Absolute $ Opportunity Analysis By Product Type , 2026 to 2036
- Global Market Analysis 2021 to 2025 and Forecast 2026 to 2036, By Source
- Introduction / Key Findings
- Historical Market Size Value (USD Million) Analysis By Source, 2021 to 2025
- Current and Future Market Size Value (USD Million) Analysis and Forecast By Source, 2026 to 2036
- Espadin
- Tobala
- Tobaziche
- Espadin
- Y-o-Y Growth Trend Analysis By Source, 2021 to 2025
- Absolute $ Opportunity Analysis By Source, 2026 to 2036
- Global Market Analysis 2021 to 2025 and Forecast 2026 to 2036, By Distribution Channel
- Introduction / Key Findings
- Historical Market Size Value (USD Million) Analysis By Distribution Channel, 2021 to 2025
- Current and Future Market Size Value (USD Million) Analysis and Forecast By Distribution Channel, 2026 to 2036
- HORECA
- Specialty Stores
- Travel Retail
- HORECA
- Y-o-Y Growth Trend Analysis By Distribution Channel, 2021 to 2025
- Absolute $ Opportunity Analysis By Distribution Channel, 2026 to 2036
- Global Market Analysis 2021 to 2025 and Forecast 2026 to 2036, By Agave Composition
- Introduction / Key Findings
- Historical Market Size Value (USD Million) Analysis By Agave Composition, 2021 to 2025
- Current and Future Market Size Value (USD Million) Analysis and Forecast By Agave Composition, 2026 to 2036
- 100% Agave
- Blends
- Others
- 100% Agave
- Y-o-Y Growth Trend Analysis By Agave Composition, 2021 to 2025
- Absolute $ Opportunity Analysis By Agave Composition, 2026 to 2036
- Global Market Analysis 2021 to 2025 and Forecast 2026 to 2036, By Production Method
- Introduction / Key Findings
- Historical Market Size Value (USD Million) Analysis By Production Method, 2021 to 2025
- Current and Future Market Size Value (USD Million) Analysis and Forecast By Production Method, 2026 to 2036
- Artisanal
- Industrial
- Ancestral
- Artisanal
- Y-o-Y Growth Trend Analysis By Production Method, 2021 to 2025
- Absolute $ Opportunity Analysis By Production Method, 2026 to 2036
- Global Market Analysis 2021 to 2025 and Forecast 2026 to 2036, By Region
- Introduction
- Historical Market Size Value (USD Million) Analysis By Region, 2021 to 2025
- Current Market Size Value (USD Million) Analysis and Forecast By Region, 2026 to 2036
- North America
- Latin America
- Western Europe
- Eastern Europe
- East Asia
- South Asia and Pacific
- Middle East & Africa
- Market Attractiveness Analysis By Region
- North America Market Analysis 2021 to 2025 and Forecast 2026 to 2036, By Country
- Historical Market Size Value (USD Million) Trend Analysis By Market Taxonomy, 2021 to 2025
- Market Size Value (USD Million) Forecast By Market Taxonomy, 2026 to 2036
- By Country
- USA
- Canada
- Mexico
- By Product Type
- By Source
- By Distribution Channel
- By Agave Composition
- By Production Method
- By Country
- Market Attractiveness Analysis
- By Country
- By Product Type
- By Source
- By Distribution Channel
- By Agave Composition
- By Production Method
- Key Takeaways
- Latin America Market Analysis 2021 to 2025 and Forecast 2026 to 2036, By Country
- Historical Market Size Value (USD Million) Trend Analysis By Market Taxonomy, 2021 to 2025
- Market Size Value (USD Million) Forecast By Market Taxonomy, 2026 to 2036
- By Country
- Brazil
- Chile
- Rest of Latin America
- By Product Type
- By Source
- By Distribution Channel
- By Agave Composition
- By Production Method
- By Country
- Market Attractiveness Analysis
- By Country
- By Product Type
- By Source
- By Distribution Channel
- By Agave Composition
- By Production Method
- Key Takeaways
- Western Europe Market Analysis 2021 to 2025 and Forecast 2026 to 2036, By Country
- Historical Market Size Value (USD Million) Trend Analysis By Market Taxonomy, 2021 to 2025
- Market Size Value (USD Million) Forecast By Market Taxonomy, 2026 to 2036
- By Country
- Germany
- UK
- Italy
- Spain
- France
- Nordic
- BENELUX
- Rest of Western Europe
- By Product Type
- By Source
- By Distribution Channel
- By Agave Composition
- By Production Method
- By Country
- Market Attractiveness Analysis
- By Country
- By Product Type
- By Source
- By Distribution Channel
- By Agave Composition
- By Production Method
- Key Takeaways
- Eastern Europe Market Analysis 2021 to 2025 and Forecast 2026 to 2036, By Country
- Historical Market Size Value (USD Million) Trend Analysis By Market Taxonomy, 2021 to 2025
- Market Size Value (USD Million) Forecast By Market Taxonomy, 2026 to 2036
- By Country
- Russia
- Poland
- Hungary
- Balkan & Baltic
- Rest of Eastern Europe
- By Product Type
- By Source
- By Distribution Channel
- By Agave Composition
- By Production Method
- By Country
- Market Attractiveness Analysis
- By Country
- By Product Type
- By Source
- By Distribution Channel
- By Agave Composition
- By Production Method
- Key Takeaways
- East Asia Market Analysis 2021 to 2025 and Forecast 2026 to 2036, By Country
- Historical Market Size Value (USD Million) Trend Analysis By Market Taxonomy, 2021 to 2025
- Market Size Value (USD Million) Forecast By Market Taxonomy, 2026 to 2036
- By Country
- China
- Japan
- South Korea
- By Product Type
- By Source
- By Distribution Channel
- By Agave Composition
- By Production Method
- By Country
- Market Attractiveness Analysis
- By Country
- By Product Type
- By Source
- By Distribution Channel
- By Agave Composition
- By Production Method
- Key Takeaways
- South Asia and Pacific Market Analysis 2021 to 2025 and Forecast 2026 to 2036, By Country
- Historical Market Size Value (USD Million) Trend Analysis By Market Taxonomy, 2021 to 2025
- Market Size Value (USD Million) Forecast By Market Taxonomy, 2026 to 2036
- By Country
- India
- ASEAN
- Australia & New Zealand
- Rest of South Asia and Pacific
- By Product Type
- By Source
- By Distribution Channel
- By Agave Composition
- By Production Method
- By Country
- Market Attractiveness Analysis
- By Country
- By Product Type
- By Source
- By Distribution Channel
- By Agave Composition
- By Production Method
- Key Takeaways
- Middle East & Africa Market Analysis 2021 to 2025 and Forecast 2026 to 2036, By Country
- Historical Market Size Value (USD Million) Trend Analysis By Market Taxonomy, 2021 to 2025
- Market Size Value (USD Million) Forecast By Market Taxonomy, 2026 to 2036
- By Country
- Kingdom of Saudi Arabia
- Other GCC Countries
- Turkiye
- South Africa
- Other African Union
- Rest of Middle East & Africa
- By Product Type
- By Source
- By Distribution Channel
- By Agave Composition
- By Production Method
- By Country
- Market Attractiveness Analysis
- By Country
- By Product Type
- By Source
- By Distribution Channel
- By Agave Composition
- By Production Method
- Key Takeaways
- Key Countries Market Analysis
- USA
- Pricing Analysis
- Market Share Analysis, 2025
- By Product Type
- By Source
- By Distribution Channel
- By Agave Composition
- By Production Method
- Canada
- Pricing Analysis
- Market Share Analysis, 2025
- By Product Type
- By Source
- By Distribution Channel
- By Agave Composition
- By Production Method
- Mexico
- Pricing Analysis
- Market Share Analysis, 2025
- By Product Type
- By Source
- By Distribution Channel
- By Agave Composition
- By Production Method
- Brazil
- Pricing Analysis
- Market Share Analysis, 2025
- By Product Type
- By Source
- By Distribution Channel
- By Agave Composition
- By Production Method
- Chile
- Pricing Analysis
- Market Share Analysis, 2025
- By Product Type
- By Source
- By Distribution Channel
- By Agave Composition
- By Production Method
- Germany
- Pricing Analysis
- Market Share Analysis, 2025
- By Product Type
- By Source
- By Distribution Channel
- By Agave Composition
- By Production Method
- UK
- Pricing Analysis
- Market Share Analysis, 2025
- By Product Type
- By Source
- By Distribution Channel
- By Agave Composition
- By Production Method
- Italy
- Pricing Analysis
- Market Share Analysis, 2025
- By Product Type
- By Source
- By Distribution Channel
- By Agave Composition
- By Production Method
- Spain
- Pricing Analysis
- Market Share Analysis, 2025
- By Product Type
- By Source
- By Distribution Channel
- By Agave Composition
- By Production Method
- France
- Pricing Analysis
- Market Share Analysis, 2025
- By Product Type
- By Source
- By Distribution Channel
- By Agave Composition
- By Production Method
- India
- Pricing Analysis
- Market Share Analysis, 2025
- By Product Type
- By Source
- By Distribution Channel
- By Agave Composition
- By Production Method
- ASEAN
- Pricing Analysis
- Market Share Analysis, 2025
- By Product Type
- By Source
- By Distribution Channel
- By Agave Composition
- By Production Method
- Australia & New Zealand
- Pricing Analysis
- Market Share Analysis, 2025
- By Product Type
- By Source
- By Distribution Channel
- By Agave Composition
- By Production Method
- China
- Pricing Analysis
- Market Share Analysis, 2025
- By Product Type
- By Source
- By Distribution Channel
- By Agave Composition
- By Production Method
- Japan
- Pricing Analysis
- Market Share Analysis, 2025
- By Product Type
- By Source
- By Distribution Channel
- By Agave Composition
- By Production Method
- South Korea
- Pricing Analysis
- Market Share Analysis, 2025
- By Product Type
- By Source
- By Distribution Channel
- By Agave Composition
- By Production Method
- Russia
- Pricing Analysis
- Market Share Analysis, 2025
- By Product Type
- By Source
- By Distribution Channel
- By Agave Composition
- By Production Method
- Poland
- Pricing Analysis
- Market Share Analysis, 2025
- By Product Type
- By Source
- By Distribution Channel
- By Agave Composition
- By Production Method
- Hungary
- Pricing Analysis
- Market Share Analysis, 2025
- By Product Type
- By Source
- By Distribution Channel
- By Agave Composition
- By Production Method
- Kingdom of Saudi Arabia
- Pricing Analysis
- Market Share Analysis, 2025
- By Product Type
- By Source
- By Distribution Channel
- By Agave Composition
- By Production Method
- Turkiye
- Pricing Analysis
- Market Share Analysis, 2025
- By Product Type
- By Source
- By Distribution Channel
- By Agave Composition
- By Production Method
- South Africa
- Pricing Analysis
- Market Share Analysis, 2025
- By Product Type
- By Source
- By Distribution Channel
- By Agave Composition
- By Production Method
- USA
- Market Structure Analysis
- Competition Dashboard
- Competition Benchmarking
- Market Share Analysis of Top Players
- By Regional
- By Product Type
- By Source
- By Distribution Channel
- By Agave Composition
- By Production Method
- Competition Analysis
- Competition Deep Dive
- Del Maguey
- Overview
- Product Portfolio
- Profitability by Market Segments (Product/Age /Sales Channel/Region)
- Sales Footprint
- Strategy Overview
- Marketing Strategy
- Product Strategy
- Channel Strategy
- Ilegal Mezcal
- Mezcal Unión
- Montelobos
- Dos Hombres
- The Lost Explorer
- Del Maguey
- Competition Deep Dive
- Assumptions & Acronyms Used


