Enzymatic RNA Manufacturing Market Forecast and Outlook 2025-2035

The enzymatic RNA manufacturing market is projected to grow from USD 1,357.4 million in 2025 to approximately USD 3,184.1 million by 2035, recording an absolute increase of USD 1,826.7 million over the forecast period. This translates into a total growth of 134.6%, with the market forecast to expand at a compound annual growth rate (CAGR) of 8.9% between 2025 and 2035.

The overall market size is expected to grow by 2.3X during the same period, supported by increasing demand for advanced RNA therapeutics, growing prevalence of genetic disorders, and rising adoption of enzymatic synthesis technologies across the global pharmaceutical and biotechnology sectors.
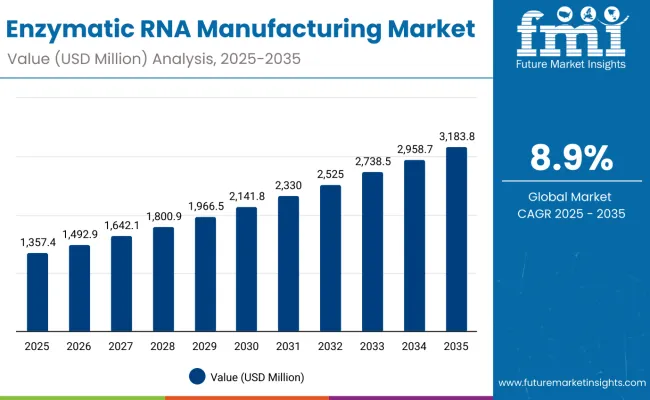
Quick Stats for Enzymatic RNA Manufacturing Market

  • Enzymatic RNA Manufacturing Market Value (2025): USD 1,357.4 million
  • Enzymatic RNA Manufacturing Market Forecast Value (2035): USD 3,184.1 million
  • Enzymatic RNA Manufacturing Market Forecast CAGR: 8.9%
  • Leading Product Type in Enzymatic RNA Manufacturing Market: Enzymes (43.3%)
  • Key Growth Regions in Enzymatic RNA Manufacturing Market: North America, Europe, East Asia, and South Asia & Pacific
  • Top Key Players in Enzymatic RNA Manufacturing Market: Thermo Fisher Scientific, New England Biolabs, Merck KGaA, Promega Corporation, TriLinkBioTechnologies

Enzymatic Rna Manufacturing Market

Enzymatic RNA Manufacturing Market Key Takeaways

Metric Value
Estimated Value in (2025E) USD 1,357.4 million
Forecast Value in (2035F) USD 3,184.1 million
Forecast CAGR (2025 to 2035) 8.9%

Between 2025 and 2030, the enzymatic RNA manufacturing market is projected to expand from USD 1,357.4 million to USD 2,079.0 million, resulting in a value increase of USD 721.6 million, which represents 39.5% of the total forecast growth for the decade. This phase of development will be shaped by increasing RNA therapeutics development, rising demand for gene therapy applications, and growing utilization in personalized medicine and vaccine development applications. Pharmaceutical manufacturers and biotechnology companies are expanding their RNA synthesis capabilities to address the growing preference for enzymatic manufacturing solutions in therapeutic RNA production systems.

From 2030 to 2035, the market is forecast to grow from USD 2,079.0 million to USD 3,184.1 million, adding another USD 1,105.1 million, which constitutes 60.5% of the overall ten-year expansion. This period is expected to be characterized by the expansion of advanced RNA synthesis technologies, the integration of AI-powered process optimization systems for premium enzymatic RNA products, and the development of enhanced scalability features for commercial applications. The growing emphasis on RNA-based therapeutics and vaccine development will drive demand for sophisticated enzymatic manufacturing solutions with enhanced efficiency capabilities and improved production reliability.

Between 2020 and 2024, the enzymatic RNA manufacturing market experienced steady growth at a CAGR of 7.3%, driven by increasing RNA therapeutics awareness and growing recognition of enzymatic synthesis systems' superior production capabilities across pharmaceutical and biotechnology applications. The market developed as manufacturers recognized the potential for enzymatic RNA manufacturing to enhance product quality while meeting modern pharmaceutical requirements for purity, scalability, and cost-effectiveness. Technological advancement in enzyme optimization and synthesis protocols began emphasizing the critical importance of maintaining production consistency while improving yield and reducing manufacturing complexity.
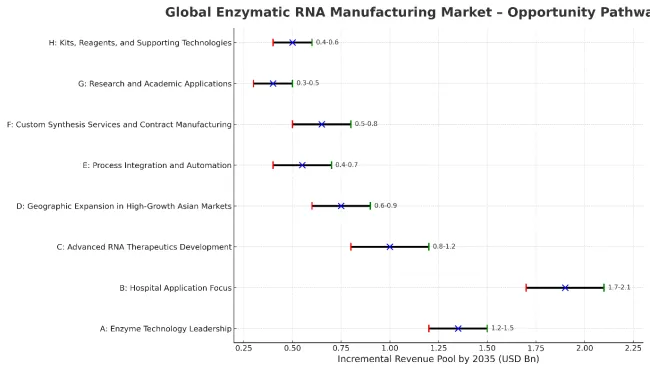
Opportunity Pathways - Enzymatic RNA Manufacturing Market

Enzymatic Rna Manufacturing Market Pathways

The enzymatic RNA manufacturing market represents a rapidly expanding biotechnology opportunity at the intersection of pharmaceutical innovation, therapeutic development, and advanced synthesis technology, with the market projected to expand from USD 1,357.4 million in 2025 to USD 3,184.1 million by 2035 at a robust 8.9% CAGR-a 2.3X growth driven by accelerating RNA therapeutics adoption, pharmaceutical demand for superior synthesis precision, and the integration of enzymatic technologies into therapeutic manufacturing workflows.

This convergence opportunity leverages the critical need for high-quality RNA production, the pharmaceutical industry's shift toward precision medicine, and advances in enzyme engineering to create manufacturing solutions that offer superior synthesis control in therapeutic development applications. Enzymes lead with 43.3% market share due to their catalytic efficiency and synthesis precision, while hospital applications dominate demand as healthcare systems increasingly adopt RNA therapeutics and personalized medicine approaches. Geographic growth is strongest in China (8.3% CAGR) and India (7.6% CAGR), where biotechnology infrastructure development and pharmaceutical investment create ideal market conditions.

Pathway A - Enzyme Technology Leadership

The dominant product category offers superior catalytic efficiency, precise synthesis control, and reliable performance essential for therapeutic RNA manufacturing. Companies developing advanced enzyme systems with enhanced specificity, improved stability, and optimized reaction conditions will capture the leading technology segment. Expected revenue pool: USD 1,200-1,500 million.

Pathway B - Hospital Application Focus

The largest application segment benefits from growing RNA therapeutics adoption, personalized medicine programs, and clinical manufacturing requirements. Providers developing comprehensive hospital solutions with integrated synthesis platforms, quality control systems, and regulatory compliance features will dominate this primary market. Opportunity: USD 1,700-2,100 million.

Pathway C - Advanced RNA Therapeutics Development

Next-generation products require sophisticated manufacturing capabilities for complex RNA molecules, modified nucleotides, and therapeutic applications. Companies investing in specialized enzyme engineering, custom synthesis protocols, and therapeutic-grade production systems will create competitive differentiation and premium positioning. Revenue uplift: USD 800-1,200 million.

Pathway D - Geographic Expansion in High-Growth Asian Markets

China and India's biotechnology infrastructure development and pharmaceutical investment create substantial opportunities. Local manufacturing partnerships, regulatory expertise, and cost-effective production strategies enable market penetration in these high-growth regions. Pool: USD 600-900 million.

Pathway E - Process Integration and Automation

Modern manufacturers prioritize efficiency, consistency, and scalability in RNA production systems. Developing integrated platforms with automated synthesis workflows, real-time quality monitoring, and predictive optimization capabilities addresses growing manufacturing demands while reducing operational complexity. Expected upside: USD 400-700 million.

Pathway F - Custom Synthesis Services and Contract Manufacturing

Pharmaceutical companies increasingly outsource specialized RNA manufacturing requirements to focus on core therapeutic development. Systems offering comprehensive contract services, custom synthesis capabilities, and regulatory support create enhanced value propositions for pharmaceutical partners. USD 500-800 million.

Pathway G - Research and Academic Applications

Universities and research institutions represent growing opportunities for advanced synthesis platforms supporting fundamental research and educational programs. Developing specialized solutions for research applications with flexible protocols, educational support, and collaborative features expands beyond commercial markets. Pool: USD 300-500 million.

Pathway H - Kits, Reagents, and Supporting Technologies

Comprehensive RNA manufacturing requires specialized reagents, purification systems, and quality control technologies. Companies developing integrated product portfolios with standardized protocols, quality assurance features, and technical support will capture supporting technology opportunities. Expected revenue: USD 400-600 million.

Why is the Enzymatic RNA Manufacturing Market Growing?

Market expansion is being supported by the increasing global development of RNA-based therapeutics and the corresponding shift toward enzymatic synthesis technologies that can provide superior product quality while meeting pharmaceutical requirements for purity, scalability, and regulatory compliance capabilities. Modern pharmaceutical manufacturers and biotechnology companies are increasingly focused on incorporating enzymatic RNA manufacturing systems to enhance production outcomes while satisfying demands for advanced therapeutic development technologies and high-quality RNA products.

Enzymatic RNA manufacturing systems' proven ability to deliver superior synthesis precision, consistent product quality, and scalable production capabilities makes them essential technologies for RNA therapeutics development and personalized medicine applications.

The growing emphasis on gene therapy and mRNA vaccine development is driving demand for high-quality enzymatic RNA manufacturing products that can support distinctive therapeutic requirements and comprehensive synthesis across vaccine development, therapeutic RNA, and personalized medicine categories. Pharmaceutical manufacturer preference for technologies that combine synthesis excellence with regulatory compliance is creating opportunities for innovative enzymatic implementations in both research and commercial manufacturing applications. The rising influence of personalized medicine and targeted therapeutics is also contributing to increased adoption of premium enzymatic RNA manufacturing products that can provide reliable therapeutic integration characteristics.

Segmental Analysis

The market is segmented by product type and application. The demand for product types is divided into enzymes, kits & reagents, and services. Based on application, the market is categorized into hospitals, research & academic centers, specialty clinics, and others.
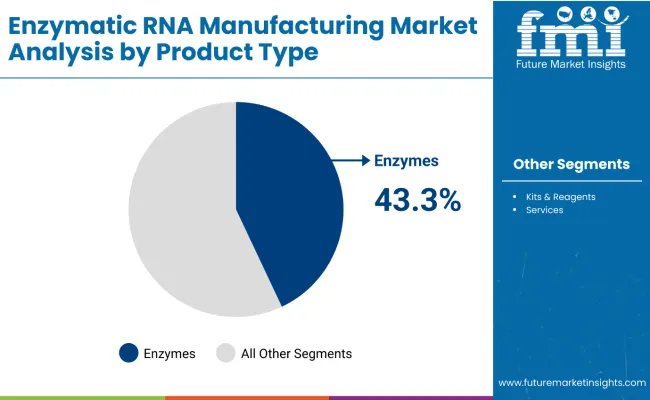
By Product Type, the Enzymes Segment Accounts for 43.3% Market Share

Enzymatic Rna Manufacturing Market By Product

The enzymes segment is projected to account for 43.3% of the enzymatic RNA manufacturing market in 2025, slightly declining to 42.7% by 2035, maintaining its position as the leading product category. Pharmaceutical manufacturers and biotechnology companies increasingly utilize enzyme technology for their superior catalytic efficiency, precise synthesis control, and reliable performance in critical RNA manufacturing applications across diverse research and commercial settings. Enzyme technology's standardized performance and proven effectiveness directly address the production requirements for consistent RNA synthesis and reliable therapeutic molecule production in enzymatic manufacturing operations.

This product segment forms the foundation of modern RNA synthesis applications, as it represents the technology with the greatest catalytic potential and established compatibility across multiple synthesis platforms. Manufacturer investments in enzyme optimization and specificity enhancement continue to strengthen adoption among pharmaceutical producers. With biotechnology companies prioritizing synthesis efficiency and product quality, enzyme systems align with both manufacturing effectiveness objectives and regulatory compliance requirements, making them the central component of comprehensive RNA manufacturing strategies.
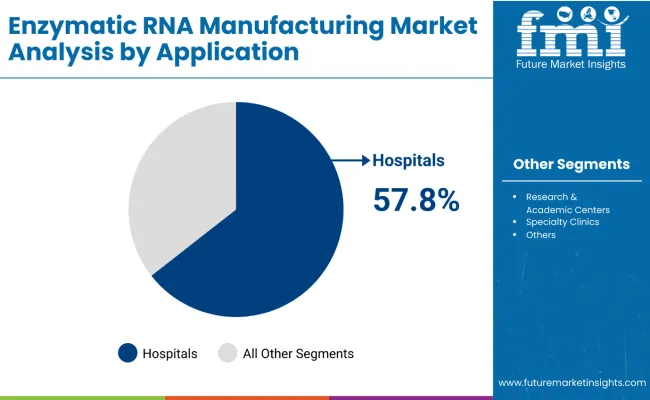
By Application, Hospitals Segment Leads Market Demand

Enzymatic Rna Manufacturing Market By Application

Hospital applications are projected to represent the largest share of enzymatic RNA manufacturing demand in 2025 at 57.8%, increasing to 58.2% by 2035, underscoring their critical role as the primary application for advanced RNA synthesis technologies in therapeutic development and clinical manufacturing protocols. Healthcare providers and pharmaceutical companies prefer hospital-based RNA manufacturing systems for their exceptional production capabilities, quality control features, and ability to support personalized medicine requirements while maintaining regulatory compliance during clinical and commercial phases. Positioned as essential platforms for RNA therapeutics and vaccine development, hospital applications offer both therapeutic innovation and clinical implementation advantages.

The segment is supported by continuous growth in RNA-based therapy adoption and the growing availability of advanced enzymatic technologies that enable enhanced therapeutic outcomes and patient care at the hospital level. Additionally, healthcare systems are investing in RNA manufacturing technologies to support therapeutic innovation and treatment personalization. As RNA therapeutics continue to evolve and providers seek superior synthesis solutions, hospital applications will continue to dominate the application landscape while supporting technology advancement and therapeutic excellence strategies.

By Application, Research & Academic Centers Show Strong Growth

Research & academic centers are projected to account for 20.1% of the market in 2025, increasing to 21.3% by 2035, reflecting their position as key drivers of RNA manufacturing innovation. This segment benefits from extensive research activities in RNA biology, therapeutic development, and educational programs requiring advanced synthesis capabilities. The growing emphasis on academic-industry partnerships and collaborative research supports continued growth in this application category.

Specialty clinics represent 14.3% in 2025, declining to 13.8% by 2035, driven by specialized therapeutic applications and niche treatment protocols. Others account for 7.8% in 2025, decreasing to 6.7% by 2035, reflecting stable but limited growth in emerging applications and specialized use cases.

What are the Drivers, Restraints, and Key Trends of the Enzymatic RNA Manufacturing Market?

The enzymatic RNA manufacturing market is advancing rapidly due to increasing RNA therapeutics development and growing demand for advanced synthesis technologies that emphasize superior product quality across pharmaceutical manufacturing and biotechnology applications. However, the market faces challenges, including high development costs compared to traditional synthesis methods, technical complexity in enzyme optimization, and competition from chemical synthesis alternatives. Innovation in enzyme engineering and process automation continues to influence market development and expansion patterns.

Expansion of RNA Therapeutics Development Programs

The growing adoption of enzymatic RNA manufacturing in comprehensive therapeutic development and commercial production applications is enabling pharmaceutical companies to develop processes that provide distinctive synthesis capabilities while commanding premium positioning and enhanced therapeutic effectiveness characteristics. Advanced enzymatic systems provide superior quality control while allowing more sophisticated RNA production across various therapeutic categories and manufacturing segments. Biotechnology companies are increasingly recognizing the competitive advantages of enzymatic synthesis positioning for comprehensive drug development and pharmaceutical market penetration.

Integration of Advanced Enzyme Engineering and Process Optimization

Modern enzymatic RNA manufacturing suppliers are incorporating advanced enzyme design systems, real-time monitoring technologies, and predictive optimization platforms to enhance synthesis efficiency, improve product quality, and meet pharmaceutical manufacturer demands for intelligent and reliable RNA production solutions. These programs improve manufacturing performance while enabling new applications, including personalized therapeutics and continuous production systems. Advanced technology integration also allows suppliers to support premium market positioning and synthesis excellence leadership beyond traditional RNA manufacturing products.
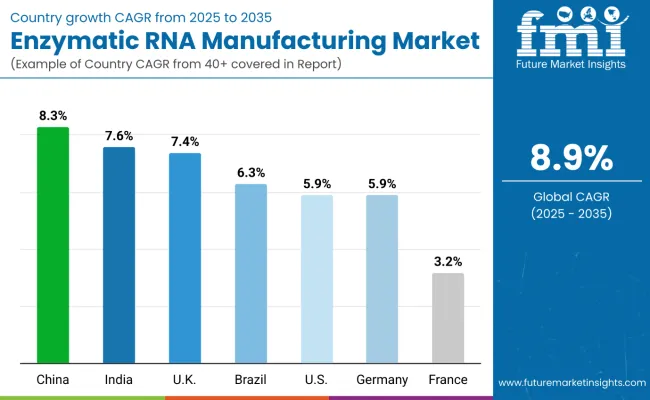
Analysis of the Enzymatic RNA Manufacturing Market by Key Country

Enzymatic Rna Manufacturing Market By Country

Countries CAGR (2025 to 2035)
China 8.3%
India 7.6%
UK 7.4%
South Korea 7.2%
Brazil 6.3%
USA 5.9%
Germany 5.9%
France 3.2%

The enzymatic RNA manufacturing market is experiencing robust growth globally, with China leading at an 8.3% CAGR through 2035, driven by expanding biotechnology infrastructure, rising pharmaceutical investments, and increasing adoption of advanced RNA synthesis technologies. India follows at 7.6%, supported by growing healthcare innovation, expanding pharmaceutical research capabilities, and rising focus on therapeutic development. The UK shows growth at 7.4%, emphasizing biotechnology advancement and pharmaceutical research excellence.

South Korea demonstrates 7.2% growth, prioritizing advanced therapeutics development and biotechnology innovation. Brazil records 6.3%, focusing on healthcare modernization and pharmaceutical sector expansion. The USA demonstrates 5.9% growth, prioritizing advanced pharmaceutical innovation and comprehensive RNA synthesis solutions. Germany exhibits 5.9% growth, supported by precision biotechnology and manufacturing excellence. France shows 3.2% growth, supported by established pharmaceutical infrastructure and steady research advancement.

The report covers an in-depth analysis of 40+ countries; eight top-performing countries are highlighted below.

China Leads Global Market Growth with Biotechnology Infrastructure Expansion

Revenue from enzymatic RNA manufacturing in China is projected to exhibit exceptional growth with a CAGR of 8.3% through 2035, driven by expanding biotechnology infrastructure and rising investments in pharmaceutical development across major research and manufacturing centers. The country's growing pharmaceutical market and increasing adoption of advanced RNA synthesis technologies are creating substantial demand for enzymatic RNA manufacturing solutions in both domestic and export-oriented applications. Major pharmaceutical manufacturers and biotechnology companies are establishing comprehensive production and research capabilities to serve both domestic healthcare needs and international pharmaceutical markets.

Rising biotechnology infrastructure development and expanding pharmaceutical investments are driving demand for enzymatic RNA manufacturing across pharmaceutical companies, biotechnology manufacturers, and research institutions throughout major Chinese biotechnology systems. Strong government support for pharmaceutical innovation and biotechnology advancement is supporting the rapid adoption of advanced RNA synthesis solutions among manufacturers seeking to meet evolving production standards and international quality expectations.

India Demonstrates Strong Market Potential with Healthcare Innovation Focus

Revenue from enzymatic RNA manufacturing in India is expanding at a CAGR of 7.6%, supported by growing healthcare innovation initiatives, increasing pharmaceutical research capabilities, and expanding biotechnology development infrastructure with advanced synthesis capabilities. The country's developing pharmaceutical ecosystem and expanding research sector are driving demand for sophisticated enzymatic RNA manufacturing products across both academic research facilities and commercial development centers. International pharmaceutical companies and domestic biotechnology manufacturers are establishing comprehensive research and production capabilities to address growing market demand for advanced RNA synthesis solutions.

Rising healthcare innovation and expanding pharmaceutical research are creating opportunities for enzymatic RNA manufacturing adoption across pharmaceutical companies, research institutions, and biotechnology suppliers in major Indian pharmaceutical markets. Growing government focus on biotechnology advancement and pharmaceutical innovation is driving the adoption of premium RNA synthesis products among researchers and manufacturers seeking to upgrade to advanced therapeutic development technologies and research excellence standards.

UK Maintains Strong Position with Biotechnology Advancement Leadership

Revenue from enzymatic RNA manufacturing in the UK is projected to grow at a CAGR of 7.4% through 2035, driven by biotechnology advancement initiatives, pharmaceutical research excellence, and established focus on therapeutic innovation requiring advanced synthesis solutions. The UK's established pharmaceutical infrastructure and increasing emphasis on RNA therapeutics development are creating substantial demand for both standard and premium enzymatic RNA manufacturing varieties. Leading pharmaceutical companies and biotechnology specialists are establishing comprehensive research strategies to serve both British markets and growing international pharmaceutical demand.

Rising biotechnology advancement and expanding pharmaceutical research focus are driving demand for premium enzymatic RNA manufacturing products across pharmaceutical companies, biotechnology manufacturers, and research providers seeking superior synthesis capabilities. Strong research expertise and pharmaceutical development initiatives are supporting the adoption of advanced RNA synthesis technologies among manufacturers prioritizing therapeutic excellence and innovation in pharmaceutical applications.

South Korea Strengthens Market with Advanced Therapeutics Development

Revenue from enzymatic RNA manufacturing in South Korea is projected to grow at a CAGR of 7.2% through 2035, supported by advanced therapeutics development initiatives, biotechnology innovation leadership, and established focus on pharmaceutical advancement requiring sophisticated synthesis solutions. South Korean pharmaceutical manufacturers and biotechnology companies prioritize research excellence, technological innovation, and therapeutic advancement, making enzymatic RNA manufacturing essential technologies for both domestic development and export-oriented research. The country's comprehensive biotechnology ecosystem and innovation capabilities support continued market development.

Advanced therapeutics development capabilities and biotechnology innovation leadership are driving demand for specialized enzymatic RNA manufacturing products across pharmaceutical manufacturers, biotechnology companies, and research providers serving domestic and international markets. Strong focus on pharmaceutical innovation and technological advancement is encouraging manufacturers to adopt premium RNA synthesis products that support competitive positioning and meet South Korean quality standards for advanced therapeutic applications.

Brazil Demonstrates Stable Growth with Healthcare Modernization Integration

Revenue from enzymatic RNA manufacturing in Brazil is projected to grow at a CAGR of 6.3% through 2035, supported by healthcare modernization integration initiatives, pharmaceutical sector development, and established expertise in biotechnology applications. Brazilian healthcare providers' focus on therapeutic advancement, research development, and technological innovation creates steady demand for advanced RNA synthesis products. The country's attention to healthcare quality and pharmaceutical development drives consistent adoption across both commercial production and research applications.

Healthcare modernization integration and pharmaceutical sector development are driving steady demand for enzymatic RNA manufacturing products across pharmaceutical companies, biotechnology manufacturers, and research specialists seeking superior synthesis capabilities and therapeutic enhancement. Strong innovation culture and pharmaceutical development focus are supporting the adoption of premium RNA synthesis solutions among manufacturers seeking to meet Brazilian quality expectations and research standards for advanced therapeutic development.
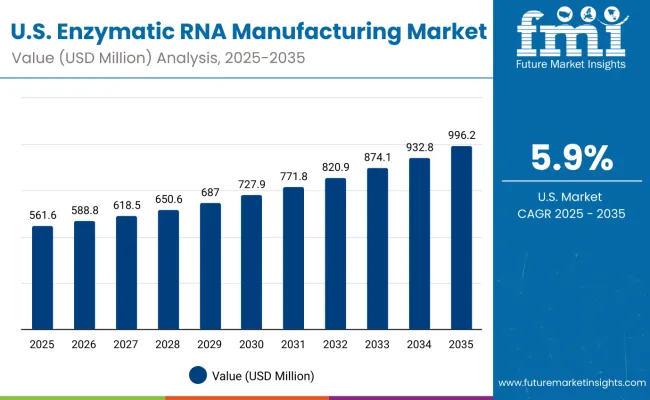
USA Demonstrates Consistent Growth with Pharmaceutical Innovation Priorities

Enzymatic Rna Manufacturing Market Usa

Revenue from enzymatic RNA manufacturing in the United States is projected to grow at a CAGR of 5.9% through 2035, supported by pharmaceutical innovation priorities, advanced biotechnology development sector, and established focus on therapeutic advancement and research optimization. American pharmaceutical manufacturers' emphasis on drug development, research efficiency, and technological leadership creates steady demand for advanced RNA synthesis products. The country's attention to pharmaceutical quality and innovation drives consistent adoption across both commercial manufacturing and research applications.

Pharmaceutical innovation priorities and advanced biotechnology development are driving steady demand for enzymatic RNA manufacturing products across pharmaceutical companies, biotechnology manufacturers, and research specialists seeking superior synthesis capabilities and innovation enhancement. Strong research culture and pharmaceutical development focus are supporting the adoption of validated RNA synthesis solutions among manufacturers seeking to meet American regulatory standards and innovation expectations for advanced therapeutic development.

Germany Maintains Focus on Precision Biotechnology Excellence

Revenue from enzymatic RNA manufacturing in Germany is projected to grow at a CAGR of 5.9% through 2035, supported by precision biotechnology excellence sector, advanced research capabilities, and sustained reputation for producing high-quality pharmaceutical products while working to enhance RNA synthesis precision and develop advanced manufacturing technologies. Germany's pharmaceutical industry continues to benefit from its reputation for engineering excellence while focusing on biotechnology innovation and synthesis optimization.

Precision biotechnology excellence capabilities and advanced research expertise are driving the development of high-quality enzymatic RNA manufacturing products that command premium prices in international markets while supporting technological advancement and engineering excellence initiatives. Growing focus on pharmaceutical innovation and synthesis precision is supporting the adoption of advanced RNA manufacturing technologies among manufacturers seeking to ensure product quality and maintain German reputation for biotechnology excellence in therapeutic applications.

France Maintains Focus on Pharmaceutical Research Integration

Revenue from enzymatic RNA manufacturing in France is projected to grow at a CAGR of 3.2% through 2035, supported by pharmaceutical research integration sector, established biotechnology capabilities, and sustained focus on therapeutic development while working to enhance synthesis technologies and develop advanced research platforms. France's pharmaceutical industry continues to benefit from its reputation for scientific excellence while focusing on research innovation and therapeutic advancement.

Pharmaceutical research integration capabilities and established biotechnology expertise are driving the development of specialized enzymatic RNA manufacturing products that support research excellence while advancing therapeutic development initiatives. Growing focus on pharmaceutical innovation and research integration is supporting the adoption of advanced RNA synthesis technologies among manufacturers seeking to ensure research quality and maintain French reputation for pharmaceutical research excellence in therapeutic applications.
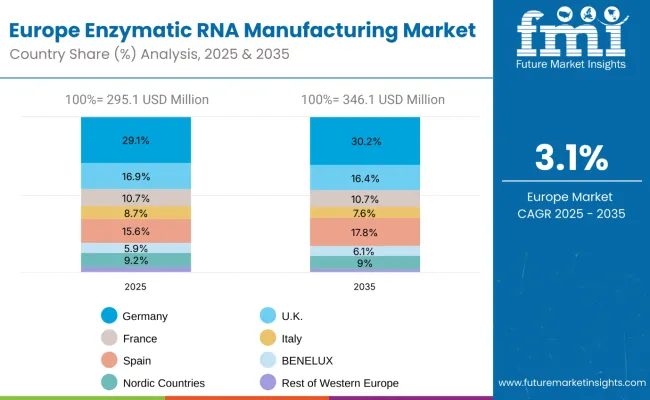
Europe Market Split by Country

Enzymatic Rna Manufacturing Market Europe

The enzymatic RNA manufacturing market in Europe is projected to grow at a CAGR of 4.9% from 2025 to 2035. Germany is expected to maintain its leadership position with a 29.1% market share in 2025, expanding to 30.2% by 2035, supported by its precision biotechnology sector, advanced pharmaceutical infrastructure, and research capabilities serving regional and international markets.

The United Kingdom follows with a 16.9% share in 2025, projected to reach 16.4% by 2035, driven by excellence in pharmaceutical research, biotechnology innovation, and therapeutic development. Spain holds a 15.6% share in 2025, expected to increase to 17.8% by 2035, supported by pharmaceutical sector growth and biotechnology advancement.

France accounts for 10.7% in 2025, projected to maintain 10.7% by 2035, while Nordic Countries contribute 9.2% in 2025, declining slightly to 9.0% by 2035. Italy represents 8.7% in 2025, decreasing to 7.6% in 2035, while BENELUX holds 5.9% in 2025, growing to 6.1% by 2035. The Rest of Western Europe region is expected to account for 4.0% in 2025, declining to 2.3% by 2035, reflecting mixed growth dynamics across smaller European markets.
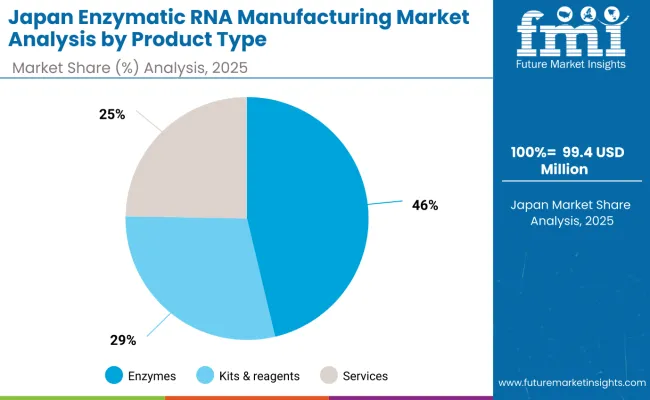
Japan Market Split by Product Type

Enzymatic Rna Manufacturing Market Japan

The enzymatic RNA manufacturing market in Japan is projected to grow steadily from 2025 to 2035, supported by advanced pharmaceutical infrastructure, strong biotechnology ecosystem, and adoption of innovative synthesis technologies.

Enzymes are expected to maintain their leadership position with a 46.3% market share in 2025, reflecting strong demand for advanced enzymatic solutions and synthesis optimization. Kits & reagents follow with 29.0% in 2025, supported by robust adoption of comprehensive reagent systems and standardized protocols.

Services hold 24.7% in 2025, leveraging Japan's expertise in technical support, process optimization, and quality assurance services for RNA synthesis applications.
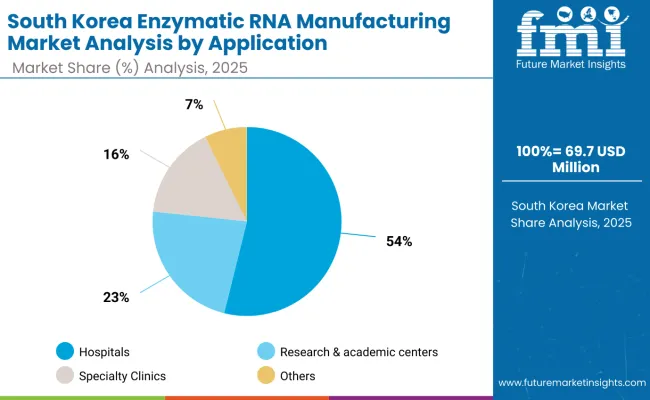
South Korea Market Split by Application

Enzymatic Rna Manufacturing Market South Korea

The enzymatic RNA manufacturing market in South Korea is projected to expand through 2035, driven by advanced healthcare infrastructure, strong pharmaceutical research capabilities, and increasing investment in RNA therapeutics development.

Hospitals are expected to maintain their leadership with a 53.9% market share in 2025, supported by growing implementation of RNA therapeutics, personalized medicine programs, and clinical manufacturing capabilities. Research & academic centers follow with 22.8% in 2025, reflecting South Korea's strong research infrastructure and educational excellence in biotechnology.

Specialty clinics account for 16.0% in 2025, supported by specialized therapeutic applications and niche treatment protocols. Others represent 7.3% in 2025, reflecting steady demand from emerging applications and specialized use cases.
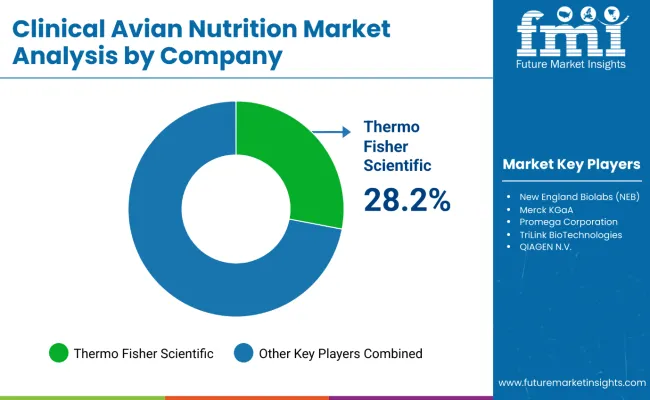
Competitive Landscape of the Enzymatic RNA Manufacturing Market

Enzymatic Rna Manufacturing Market By Company

The enzymatic RNA manufacturing market is characterized by competition among established biotechnology companies, specialized enzyme suppliers, and integrated pharmaceutical solution providers. Companies are investing in advanced enzyme technologies, synthesis optimization systems, application-specific product development, and comprehensive technical support capabilities to deliver consistent, high-performance, and reliable enzymatic RNA manufacturing products. Innovation in enzyme engineering enhancement, process integration, and customized synthesis compatibility is central to strengthening market position and pharmaceutical manufacturer satisfaction.

Thermo Fisher Scientific leads the market with a dominant 28.2% share, focusing on comprehensive life sciences solutions and advanced biotechnology platforms, offering premium enzymatic RNA manufacturing products with emphasis on research excellence and synthesis optimization capabilities. Other key players provide specialized biotechnology and pharmaceutical manufacturing capabilities with focus on innovation and technical support. New England Biolabs delivers specialized enzyme solutions with emphasis on quality and research applications.

Merck KGaA specializes in pharmaceutical and biotechnology solutions with focus on manufacturing reliability and technical innovation. Promega Corporation focuses on life sciences research with emphasis on molecular biology tools and synthesis solutions. TriLinkBioTechnologies emphasizes nucleic acid synthesis with focus on custom RNA manufacturing and therapeutic applications. QIAGEN N.V. provides molecular diagnostics and research solutions with emphasis on sample preparation and analysis technologies.

Enzymatic RNA Manufacturing Market - Stakeholder Contribution Framework

The global enzymatic RNA manufacturing market represents a rapidly expanding $1.36 billion opportunity in 2025, projected to reach $3.18 billion by 2035 at an 8.9% CAGR. Enzymatic RNA manufacturing offers superior synthesis precision, consistent product quality, and scalable production capabilities essential for RNA therapeutics, mRNA vaccines, gene therapy, and personalized medicine applications. Success requires coordinated action across regulatory bodies, technology innovators, pharmaceutical manufacturers, research institutions, and capital providers to unlock the full potential of this transformative biotechnology sector.

How Governments Could Accelerate Market Development and Innovation?

Regulatory Framework Enhancement:

  • Establish clear approval pathways for enzymatic RNA manufacturing processes in therapeutic applications, including guidelines for Good Manufacturing Practice (GMP) compliance, quality control standards, and contamination thresholds
  • Create expedited review processes for RNA therapeutic manufacturing technologies, particularly for pandemic preparedness and emergency use applications
  • Develop harmonized international standards with major pharmaceutical markets to facilitate cross-border technology transfer and product approval

Research & Development Investment:

  • Fund national centers of excellence for enzymatic RNA synthesis research, focusing on enzyme optimization, process scalability, and cost reduction technologies
  • Support academic-industry partnerships through grants targeting breakthrough innovations in RNA polymerase engineering, template design, and purification technologies
  • Invest in workforce development programs training biochemical engineers, process technologists, and quality assurance specialists in enzymatic RNA manufacturing

Infrastructure & Manufacturing Support:

  • Provide tax incentives and concessional financing for establishing regional enzymatic RNA manufacturing hubs, particularly in emerging markets like China (8.3% CAGR) and India (7.6% CAGR)
  • Support technology transfer initiatives bringing advanced enzymatic synthesis capabilities to developing pharmaceutical ecosystems
  • Create manufacturing readiness programs helping biotechnology companies scale from research-grade to commercial-scale production

Strategic Stockpiling & Preparedness:

  • Establish national strategic reserves of key enzymes, reagents, and manufacturing capacity for emergency RNA therapeutic production
  • Develop pandemic preparedness protocols leveraging enzymatic RNA manufacturing for rapid vaccine and therapeutic development
  • Support dual-use research initiatives advancing both commercial and defense applications of RNA synthesis technologies

How Industry Bodies Could Strengthen Market Foundations?

Standardization & Quality Assurance:

  • Develop comprehensive analytical standards for enzymatic RNA products, including protocols for measuring RNA integrity, purity, immunogenicity, and stability across different synthesis platforms
  • Establish certification programs for enzymatic RNA manufacturing facilities, ensuring consistent quality and regulatory compliance across global production networks
  • Create reference materials and inter-laboratory testing programs enabling reliable quality comparison between suppliers and manufacturing sites

Market Development & Education:

  • Lead industry messaging differentiating enzymatic synthesis advantages over chemical and solid-phase synthesis methods, emphasizing superior fidelity, scalability, and cost-effectiveness
  • Organize technical conferences and training programs educating pharmaceutical manufacturers on enzymatic RNA integration into existing production workflows
  • Facilitate regulatory science initiatives providing evidence-based guidance for enzymatic RNA manufacturing approval processes

Collaborative Platforms:

  • Establish buyer-supplier matching platforms connecting pharmaceutical companies with specialized enzymatic RNA manufacturing service providers
  • Coordinate pilot programs allowing pharmaceutical manufacturers to evaluate enzymatic synthesis for specific therapeutic applications
  • Develop industry consortiums addressing shared challenges in enzyme development, process optimization, and supply chain management

Innovation Acceleration:

  • Support pre-competitive research initiatives advancing fundamental understanding of enzymatic RNA synthesis mechanisms and optimization strategies
  • Facilitate intellectual property sharing arrangements enabling broader access to key enzymatic synthesis technologies
  • Coordinate international research collaborations advancing next-generation enzymatic RNA manufacturing platforms

How Technology Providers Could Strengthen the Ecosystem?

Advanced Synthesis Platforms:

  • Develop modular, scalable enzymatic synthesis systems accommodating both research-scale and commercial production requirements, with particular focus on serving the dominant hospital segment (57.8% market share)
  • Integrate AI-powered process optimization enabling real-time adjustment of synthesis parameters for maximum yield and quality consistency
  • Create continuous-flow enzymatic synthesis platforms reducing production time and manufacturing costs while improving product consistency

Enzyme Engineering & Optimization:

  • Advance enzyme engineering capabilities developing RNA polymerases with enhanced thermostability, processivity, and fidelity for diverse therapeutic applications
  • Develop specialized enzyme formulations optimized for different RNA types including mRNA, siRNA, antisense oligonucleotides, and guide RNAs
  • Create enzyme immobilization technologies enabling reusable synthesis platforms and reducing per-unit production costs

Integrated Digital Solutions:

  • Provide comprehensive software suites integrating sequence design, synthesis planning, quality prediction, and batch tracking for enzymatic RNA manufacturing workflows
  • Develop digital twin technologies enabling virtual optimization of enzymatic synthesis processes before physical implementation
  • Create cloud-based platforms allowing remote monitoring and control of enzymatic RNA synthesis operations

Quality Control & Analytics:

  • Develop rapid, automated quality control systems providing real-time analysis of RNA products during enzymatic synthesis
  • Create advanced purification technologies removing enzyme residues, incomplete products, and contaminants from therapeutic RNA preparations
  • Provide integrated packaging and cold-chain management solutions preserving RNA stability during storage and distribution

How Pharmaceutical Manufacturers Could Navigate Market Opportunities?

Technology Integration Strategies:

  • Evaluate enzymatic synthesis integration for existing RNA therapeutic programs, particularly focusing on cost reduction and quality improvement opportunities
  • Develop internal capabilities in enzymatic RNA manufacturing or establish strategic partnerships with specialized service providers
  • Implement parallel manufacturing strategies comparing enzymatic versus traditional synthesis methods for specific therapeutic applications

Product Development Acceleration:

  • Leverage enzymatic synthesis advantages for developing complex RNA therapeutics including self-amplifying RNA, circular RNA, and modified nucleotide therapeutics
  • Utilize enzymatic platforms for rapid prototyping and optimization of RNA therapeutic candidates during discovery and development phases
  • Develop personalized medicine applications leveraging enzymatic synthesis flexibility for patient-specific RNA therapeutic production

Supply Chain Optimization:

  • Establish distributed manufacturing networks utilizing enzymatic synthesis platforms for regional RNA therapeutic production
  • Develop robust supplier qualification programs ensuring consistent enzyme and reagent quality across global manufacturing operations
  • Implement advanced inventory management systems optimizing enzyme, reagent, and consumable procurement for enzymatic RNA manufacturing

Regulatory Strategy Development:

  • Engage early with regulatory agencies regarding enzymatic RNA manufacturing process validation and approval requirements
  • Develop comprehensive analytical packages demonstrating enzymatic RNA product comparability to existing synthesis methods
  • Establish quality systems ensuring consistent documentation and traceability throughout enzymatic RNA manufacturing processes

How Investors Could Unlock Market Value?

Platform Technology Investment:

  • Fund breakthrough enzyme engineering companies developing next-generation RNA polymerases and synthesis systems with enhanced performance characteristics
  • Support biotechnology platforms integrating enzymatic synthesis with downstream processing, formulation, and delivery technologies
  • Invest in companies developing proprietary enzyme formulations and optimized reaction conditions for specific RNA therapeutic applications

Manufacturing Infrastructure Development:

  • Finance construction of regional enzymatic RNA manufacturing facilities serving pharmaceutical industry demand in high-growth markets
  • Support contract manufacturing organizations (CMOs) expanding enzymatic RNA synthesis capabilities and capacity
  • Fund technology transfer initiatives bringing enzymatic RNA manufacturing capabilities to emerging pharmaceutical markets

Innovation & IP Development:

  • Back early-stage companies developing novel enzymatic synthesis approaches including cell-free systems, engineered biosynthetic pathways, and hybrid synthesis platforms
  • Support intellectual property development in key areas including enzyme optimization, process control, and product purification technologies
  • Fund research collaborations between academic institutions and biotechnology companies advancing enzymatic RNA synthesis science

Market Expansion Strategies:

  • Support companies expanding enzymatic RNA manufacturing applications beyond therapeutics into research tools, diagnostics, and agricultural applications
  • Fund international expansion initiatives bringing enzymatic RNA manufacturing capabilities to underserved geographic markets
  • Invest in companies developing cost-effective enzymatic synthesis solutions for resource-constrained healthcare systems

Strategic Consolidation Opportunities:

  • Support strategic acquisitions consolidating enzymatic RNA manufacturing capabilities within integrated pharmaceutical and biotechnology platforms
  • Fund roll-up strategies combining specialized enzyme suppliers, synthesis service providers, and quality control technology companies
  • Finance vertical integration initiatives bringing enzymatic RNA manufacturing capabilities in-house for major pharmaceutical manufacturers

Key Players in the Enzymatic RNA Manufacturing Market

  • Thermo Fisher Scientific
  • New England Biolabs (NEB)
  • Merck KGaA
  • Promega Corporation
  • TriLinkBioTechnologies
  • QIAGEN N.V.
  • Others

Scope of the Report

Items Values
Quantitative Units (2025) USD 1,357.4 million
Product Type Enzymes, Kits & Reagents, Services
Application Hospitals, Research & Academic Centers, Specialty Clinics, Others
Regions Covered North America, Europe, East Asia, South Asia & Pacific, Latin America, Middle East & Africa
Countries Covered United States, Germany, United Kingdom, France, China, Japan, South Korea, India, Brazil, and 40+ countries
Key Companies Profiled Thermo Fisher Scientific, New England Biolabs, Merck KGaA, Promega Corporation, TriLink BioTechnologies, QIAGEN N.V.
Additional Attributes Dollar sales by product type and application, regional demand trends, competitive landscape, technological advancements in enzymatic synthesis, pharmaceutical integration initiatives, therapeutic development programs, and synthesis excellence enhancement strategies

Enzymatic RNA Manufacturing Market by Segments

By Product Type:

  • Enzymes
  • Kits & Reagents
  • Services

By Application:

  • Hospitals
  • Research & Academic Centers
  • Specialty Clinics
  • Others

By Region:

By North America

  • United States
  • Canada
  • Mexico

By Europe

  • Germany
  • United Kingdom
  • France
  • Italy
  • Spain
  • Nordic
  • BENELUX
  • Rest of Europe

By East Asia

  • China
  • Japan
  • South Korea

By South Asia & Pacific

  • India
  • ASEAN
  • Australia & New Zealand
  • Rest of South Asia & Pacific

By Latin America

  • Brazil
  • Chile
  • Rest of Latin America

By Middle East & Africa

  • Kingdom of Saudi Arabia
  • Other GCC Countries
  • Turkey
  • South Africa
  • Other African Union
  • Rest of Middle East & Africa

Table of Content

  1. Executive Summary
    • Global Market Outlook
    • Demand-side Trends
    • Supply-side Trends
    • Technology Roadmap Analysis
    • Analysis and Recommendations
  2. Market Overview
    • Market Coverage / Taxonomy
    • Market Definition / Scope / Limitations
  3. Market Background
    • Market Dynamics
      • Drivers
      • Restraints
      • Opportunity
      • Trends
    • Scenario Forecast
      • Demand in Optimistic Scenario
      • Demand in Likely Scenario
      • Demand in Conservative Scenario
    • Opportunity Map Analysis
    • Product Life Cycle Analysis
    • Supply Chain Analysis
      • Supply Side Participants and their Roles
        • Producers
        • Mid-Level Participants (Traders/ Agents/ Brokers)
        • Wholesalers and Distributors
      • Value Added and Value Created at Node in the Supply Chain
      • List of Raw Material Suppliers
      • List of Existing and Potential Buyer's
    • Investment Feasibility Matrix
    • Value Chain Analysis
      • Profit Margin Analysis
      • Wholesalers and Distributors
      • Retailers
    • PESTLE and Porter's Analysis
    • Regulatory Landscape
      • By Key Regions
      • By Key Countries
    • Regional Parent Market Outlook
    • Production and Consumption Statistics
    • Import and Export Statistics
  4. Global Market Analysis 2020 to 2024 and Forecast, 2025 to 2035
    • Historical Market Size Value (USD Million) & Volume (Units) Analysis, 2020 to 2024
    • Current and Future Market Size Value (USD Million) & Volume (Units) Projections, 2025 to 2035
      • Y-o-Y Growth Trend Analysis
      • Absolute $ Opportunity Analysis
  5. Global Market Pricing Analysis 2020 to 2024 and Forecast 2025 to 2035
  6. Global Market Analysis 2020 to 2024 and Forecast 2025 to 2035, By Product Type
    • Introduction / Key Findings
    • Historical Market Size Value (USD Million) & Volume (Units) Analysis By Product Type, 2020 to 2024
    • Current and Future Market Size Value (USD Million) & Volume (Units) Analysis and Forecast By Product Type, 2025 to 2035
      • Enzymes
      • Kits & Reagents
      • Services
    • Y-o-Y Growth Trend Analysis By Product Type, 2020 to 2024
    • Absolute $ Opportunity Analysis By Product Type, 2025 to 2035
  7. Global Market Analysis 2020 to 2024 and Forecast 2025 to 2035, By Application
    • Introduction / Key Findings
    • Historical Market Size Value (USD Million) & Volume (Units) Analysis By Application, 2020 to 2024
    • Current and Future Market Size Value (USD Million) & Volume (Units) Analysis and Forecast By Application, 2025 to 2035
      • Hospitals
      • Research & Academic Centers
      • Specialty Clinics
    • Y-o-Y Growth Trend Analysis By Application, 2020 to 2024
    • Absolute $ Opportunity Analysis By Application, 2025 to 2035
  8. Global Market Analysis 2020 to 2024 and Forecast 2025 to 2035, By Region
    • Introduction
    • Historical Market Size Value (USD Million) & Volume (Units) Analysis By Region, 2020 to 2024
    • Current Market Size Value (USD Million) & Volume (Units) Analysis and Forecast By Region, 2025 to 2035
      • North America
      • Latin America
      • East Asia
      • South Asia & Pacific
      • Western Europe
      • Eastern Europe
      • Middle East & Africa
    • Market Attractiveness Analysis By Region
  9. North America Market Analysis 2020 to 2024 and Forecast 2025 to 2035, By Country
    • Historical Market Size Value (USD Million) & Volume (Units) Trend Analysis By Market Taxonomy, 2020 to 2024
    • Market Size Value (USD Million) & Volume (Units) Forecast By Market Taxonomy, 2025 to 2035
      • By Country
        • USA
        • Canada
        • Mexico
      • By Product Type
      • By Application
    • Market Attractiveness Analysis
      • By Country
      • By Product Type
      • By Application
    • Key Takeaways
  10. Latin America Market Analysis 2020 to 2024 and Forecast 2025 to 2035, By Country
    • Historical Market Size Value (USD Million) & Volume (Units) Trend Analysis By Market Taxonomy, 2020 to 2024
    • Market Size Value (USD Million) & Volume (Units) Forecast By Market Taxonomy, 2025 to 2035
      • By Country
        • Brazil
        • Argentina
        • Rest of Latin America
      • By Product Type
      • By Application
    • Market Attractiveness Analysis
      • By Country
      • By Product Type
      • By Application
    • Key Takeaways
  11. East Asia Market Analysis 2020 to 2024 and Forecast 2025 to 2035, By Country
    • Historical Market Size Value (USD Million) & Volume (Units) Trend Analysis By Market Taxonomy, 2020 to 2024
    • Market Size Value (USD Million) & Volume (Units) Forecast By Market Taxonomy, 2025 to 2035
      • By Country
        • China
        • Japan
        • South Korea
      • By Product Type
      • By Application
    • Market Attractiveness Analysis
      • By Country
      • By Product Type
      • By Application
    • Key Takeaways
  12. South Asia & Pacific Market Analysis 2020 to 2024 and Forecast 2025 to 2035, By Country
    • Historical Market Size Value (USD Million) & Volume (Units) Trend Analysis By Market Taxonomy, 2020 to 2024
    • Market Size Value (USD Million) & Volume (Units) Forecast By Market Taxonomy, 2025 to 2035
      • By Country
        • India
        • ASEAN Countries
        • Australia & New Zealand
        • Rest of South Asia
      • By Product Type
      • By Application
    • Market Attractiveness Analysis
      • By Country
      • By Product Type
      • By Application
    • Key Takeaways
  13. Western Europe Market Analysis 2020 to 2024 and Forecast 2025 to 2035, By Country
    • Historical Market Size Value (USD Million) & Volume (Units) Trend Analysis By Market Taxonomy, 2020 to 2024
    • Market Size Value (USD Million) & Volume (Units) Forecast By Market Taxonomy, 2025 to 2035
      • By Country
        • Germany
        • UK
        • France
        • Italy
        • Spain
        • BENELUX
        • Nordic Countries
        • Rest of Western Europe
      • By Product Type
      • By Application
    • Market Attractiveness Analysis
      • By Country
      • By Product Type
      • By Application
    • Key Takeaways
  14. Eastern Europe Market Analysis 2020 to 2024 and Forecast 2025 to 2035, By Country
    • Historical Market Size Value (USD Million) & Volume (Units) Trend Analysis By Market Taxonomy, 2020 to 2024
    • Market Size Value (USD Million) & Volume (Units) Forecast By Market Taxonomy, 2025 to 2035
      • By Country
        • Russia
        • Hungary
        • Poland
        • Rest of Eastern Europe
      • By Product Type
      • By Application
    • Market Attractiveness Analysis
      • By Country
      • By Product Type
      • By Application
    • Key Takeaways
  15. Middle East & Africa Market Analysis 2020 to 2024 and Forecast 2025 to 2035, By Country
    • Historical Market Size Value (USD Million) & Volume (Units) Trend Analysis By Market Taxonomy, 2020 to 2024
    • Market Size Value (USD Million) & Volume (Units) Forecast By Market Taxonomy, 2025 to 2035
      • By Country
        • Saudi Arabia
        • Türkiye
        • South Africa
        • Other African Union
        • Rest of Middle East & Africa
      • By Product Type
      • By Application
    • Market Attractiveness Analysis
      • By Country
      • By Product Type
      • By Application
    • Key Takeaways
  16. Key Countries Market Analysis
    • USA
      • Pricing Analysis
      • Market Share Analysis, 2024
        • By Product Type
        • By Application
    • Brazil
      • Pricing Analysis
      • Market Share Analysis, 2024
        • By Product Type
        • By Application
    • China
      • Pricing Analysis
      • Market Share Analysis, 2024
        • By Product Type
        • By Application
    • India
      • Pricing Analysis
      • Market Share Analysis, 2024
        • By Product Type
        • By Application
    • Japan
      • Pricing Analysis
      • Market Share Analysis, 2024
        • By Product Type
        • By Application
    • Germany
      • Pricing Analysis
      • Market Share Analysis, 2024
        • By Product Type
        • By Application
    • France
      • Pricing Analysis
      • Market Share Analysis, 2024
        • By Product Type
        • By Application
    • UK
      • Pricing Analysis
      • Market Share Analysis, 2024
        • By Product Type
        • By Application
  17. Market Structure Analysis
    • Competition Dashboard
    • Competition Benchmarking
    • Market Share Analysis of Top Players
      • By Regional
      • By Product Type
      • By Application
  18. Competition Analysis
    • Competition Deep Dive
      • Thermo Fisher Scientific
        • Overview
        • Product Portfolio
        • Profitability by Market Segments (Product/Age/Sales Channel/Region)
        • Sales Footprint
        • Strategy Overview
          • Marketing Strategy
          • Product Strategy
          • Channel Strategy
      • New England Biolabs (NEB)
        • Overview
        • Product Portfolio
        • Profitability by Market Segments (Product/Age/Sales Channel/Region)
        • Sales Footprint
        • Strategy Overview
          • Marketing Strategy
          • Product Strategy
          • Channel Strategy
      • Merck KGaA
        • Overview
        • Product Portfolio
        • Profitability by Market Segments (Product/Age/Sales Channel/Region)
        • Sales Footprint
        • Strategy Overview
          • Marketing Strategy
          • Product Strategy
          • Channel Strategy
      • Promega Corporation
        • Overview
        • Product Portfolio
        • Profitability by Market Segments (Product/Age/Sales Channel/Region)
        • Sales Footprint
        • Strategy Overview
          • Marketing Strategy
          • Product Strategy
          • Channel Strategy
      • TriLink BioTechnologies
        • Overview
        • Product Portfolio
        • Profitability by Market Segments (Product/Age/Sales Channel/Region)
        • Sales Footprint
        • Strategy Overview
          • Marketing Strategy
          • Product Strategy
          • Channel Strategy
      • QIAGEN N.V.
        • Overview
        • Product Portfolio
        • Profitability by Market Segments (Product/Age/Sales Channel/Region)
        • Sales Footprint
        • Strategy Overview
          • Marketing Strategy
          • Product Strategy
          • Channel Strategy
  19. Assumptions & Acronyms Used
  20. Research Methodology

List of Tables

  • Table 1: Global Market Value (USD Million) Forecast by Region, 2020-2035
  • Table 2: Global Market Volume (Units) Forecast by Region, 2020-2035
  • Table 3: Global Market Value (USD Million) Forecast by Product Type, 2020-2035
  • Table 4: Global Market Volume (Units) Forecast by Product Type, 2020-2035
  • Table 5: Global Market Value (USD Million) Forecast by Application, 2020-2035
  • Table 6: Global Market Volume (Units) Forecast by Application, 2020-2035
  • Table 7: North America Market Value (USD Million) Forecast by Country, 2020-2035
  • Table 8: North America Market Volume (Units) Forecast by Country, 2020-2035
  • Table 9: North America Market Value (USD Million) Forecast by Product Type, 2020-2035
  • Table 10: North America Market Volume (Units) Forecast by Product Type, 2020-2035
  • Table 11: North America Market Value (USD Million) Forecast by Application, 2020-2035
  • Table 12: North America Market Volume (Units) Forecast by Application, 2020-2035
  • Table 13: Latin America Market Value (USD Million) Forecast by Country, 2020-2035
  • Table 14: Latin America Market Volume (Units) Forecast by Country, 2020-2035
  • Table 15: Latin America Market Value (USD Million) Forecast by Product Type, 2020-2035
  • Table 16: Latin America Market Volume (Units) Forecast by Product Type, 2020-2035
  • Table 17: Latin America Market Value (USD Million) Forecast by Application, 2020-2035
  • Table 18: Latin America Market Volume (Units) Forecast by Application, 2020-2035
  • Table 19: East Asia Market Value (USD Million) Forecast by Country, 2020-2035
  • Table 20: East Asia Market Volume (Units) Forecast by Country, 2020-2035
  • Table 21: East Asia Market Value (USD Million) Forecast by Product Type, 2020-2035
  • Table 22: East Asia Market Volume (Units) Forecast by Product Type, 2020-2035
  • Table 23: East Asia Market Value (USD Million) Forecast by Application, 2020-2035
  • Table 24: East Asia Market Volume (Units) Forecast by Application, 2020-2035
  • Table 25: South Asia & Pacific Market Value (USD Million) Forecast by Country, 2020-2035
  • Table 26: South Asia & Pacific Market Volume (Units) Forecast by Country, 2020-2035
  • Table 27: South Asia & Pacific Market Value (USD Million) Forecast by Product Type, 2020-2035
  • Table 28: South Asia & Pacific Market Volume (Units) Forecast by Product Type, 2020-2035
  • Table 29: South Asia & Pacific Market Value (USD Million) Forecast by Application, 2020-2035
  • Table 30: South Asia & Pacific Market Volume (Units) Forecast by Application, 2020-2035
  • Table 31: Western Europe Market Value (USD Million) Forecast by Country, 2020-2035
  • Table 32: Western Europe Market Volume (Units) Forecast by Country, 2020-2035
  • Table 33: Western Europe Market Value (USD Million) Forecast by Product Type, 2020-2035
  • Table 34: Western Europe Market Volume (Units) Forecast by Product Type, 2020-2035
  • Table 35: Western Europe Market Value (USD Million) Forecast by Application, 2020-2035
  • Table 36: Western Europe Market Volume (Units) Forecast by Application, 2020-2035
  • Table 37: Eastern Europe Market Value (USD Million) Forecast by Country, 2020-2035
  • Table 38: Eastern Europe Market Volume (Units) Forecast by Country, 2020-2035
  • Table 39: Eastern Europe Market Value (USD Million) Forecast by Product Type, 2020-2035
  • Table 40: Eastern Europe Market Volume (Units) Forecast by Product Type, 2020-2035
  • Table 41: Eastern Europe Market Value (USD Million) Forecast by Application, 2020-2035
  • Table 42: Eastern Europe Market Volume (Units) Forecast by Application, 2020-2035
  • Table 43: Middle East & Africa Market Value (USD Million) Forecast by Country, 2020-2035
  • Table 44: Middle East & Africa Market Volume (Units) Forecast by Country, 2020-2035
  • Table 45: Middle East & Africa Market Value (USD Million) Forecast by Product Type, 2020-2035
  • Table 46: Middle East & Africa Market Volume (Units) Forecast by Product Type, 2020-2035
  • Table 47: Middle East & Africa Market Value (USD Million) Forecast by Application, 2020-2035
  • Table 48: Middle East & Africa Market Volume (Units) Forecast by Application, 2020-2035
  • Table 49: USA Market Value (USD Million) Forecast by Product Type, 2020-2035
  • Table 50: USA Market Volume (Units) Forecast by Product Type, 2020-2035
  • Table 51: USA Market Value (USD Million) Forecast by Application, 2020-2035
  • Table 52: USA Market Volume (Units) Forecast by Application, 2020-2035
  • Table 53: Canada Market Value (USD Million) Forecast by Product Type, 2020-2035
  • Table 54: Canada Market Volume (Units) Forecast by Product Type, 2020-2035
  • Table 55: Canada Market Value (USD Million) Forecast by Application, 2020-2035
  • Table 56: Canada Market Volume (Units) Forecast by Application, 2020-2035
  • Table 57: Mexico Market Value (USD Million) Forecast by Product Type, 2020-2035
  • Table 58: Mexico Market Volume (Units) Forecast by Product Type, 2020-2035
  • Table 59: Mexico Market Value (USD Million) Forecast by Application, 2020-2035
  • Table 60: Mexico Market Volume (Units) Forecast by Application, 2020-2035
  • Table 61: Brazil Market Value (USD Million) Forecast by Product Type, 2020-2035
  • Table 62: Brazil Market Volume (Units) Forecast by Product Type, 2020-2035
  • Table 63: Brazil Market Value (USD Million) Forecast by Application, 2020-2035
  • Table 64: Brazil Market Volume (Units) Forecast by Application, 2020-2035
  • Table 65: Argentina Market Value (USD Million) Forecast by Product Type, 2020-2035
  • Table 66: Argentina Market Volume (Units) Forecast by Product Type, 2020-2035
  • Table 67: Argentina Market Value (USD Million) Forecast by Application, 2020-2035
  • Table 68: Argentina Market Volume (Units) Forecast by Application, 2020-2035
  • Table 69: China Market Value (USD Million) Forecast by Product Type, 2020-2035
  • Table 70: China Market Volume (Units) Forecast by Product Type, 2020-2035
  • Table 71: China Market Value (USD Million) Forecast by Application, 2020-2035
  • Table 72: China Market Volume (Units) Forecast by Application, 2020-2035
  • Table 73: Japan Market Value (USD Million) Forecast by Product Type, 2020-2035
  • Table 74: Japan Market Volume (Units) Forecast by Product Type, 2020-2035
  • Table 75: Japan Market Value (USD Million) Forecast by Application, 2020-2035
  • Table 76: Japan Market Volume (Units) Forecast by Application, 2020-2035
  • Table 77: South Korea Market Value (USD Million) Forecast by Product Type, 2020-2035
  • Table 78: South Korea Market Volume (Units) Forecast by Product Type, 2020-2035
  • Table 79: South Korea Market Value (USD Million) Forecast by Application, 2020-2035
  • Table 80: South Korea Market Volume (Units) Forecast by Application, 2020-2035
  • Table 81: India Market Value (USD Million) Forecast by Product Type, 2020-2035
  • Table 82: India Market Volume (Units) Forecast by Product Type, 2020-2035
  • Table 83: India Market Value (USD Million) Forecast by Application, 2020-2035
  • Table 84: India Market Volume (Units) Forecast by Application, 2020-2035
  • Table 85: ASEAN Countries Market Value (USD Million) Forecast by Product Type, 2020-2035
  • Table 86: ASEAN Countries Market Volume (Units) Forecast by Product Type, 2020-2035
  • Table 87: ASEAN Countries Market Value (USD Million) Forecast by Application, 2020-2035
  • Table 88: ASEAN Countries Market Volume (Units) Forecast by Application, 2020-2035
  • Table 89: Australia & New Zealand Market Value (USD Million) Forecast by Product Type, 2020-2035
  • Table 90: Australia & New Zealand Market Volume (Units) Forecast by Product Type, 2020-2035
  • Table 91: Australia & New Zealand Market Value (USD Million) Forecast by Application, 2020-2035
  • Table 92: Australia & New Zealand Market Volume (Units) Forecast by Application, 2020-2035
  • Table 93: Germany Market Value (USD Million) Forecast by Product Type, 2020-2035
  • Table 94: Germany Market Volume (Units) Forecast by Product Type, 2020-2035
  • Table 95: Germany Market Value (USD Million) Forecast by Application, 2020-2035
  • Table 96: Germany Market Volume (Units) Forecast by Application, 2020-2035
  • Table 97: UK Market Value (USD Million) Forecast by Product Type, 2020-2035
  • Table 98: UK Market Volume (Units) Forecast by Product Type, 2020-2035
  • Table 99: UK Market Value (USD Million) Forecast by Application, 2020-2035
  • Table 100: UK Market Volume (Units) Forecast by Application, 2020-2035
  • Table 101: France Market Value (USD Million) Forecast by Product Type, 2020-2035
  • Table 102: France Market Volume (Units) Forecast by Product Type, 2020-2035
  • Table 103: France Market Value (USD Million) Forecast by Application, 2020-2035
  • Table 104: France Market Volume (Units) Forecast by Application, 2020-2035
  • Table 105: Italy Market Value (USD Million) Forecast by Product Type, 2020-2035
  • Table 106: Italy Market Volume (Units) Forecast by Product Type, 2020-2035
  • Table 107: Italy Market Value (USD Million) Forecast by Application, 2020-2035
  • Table 108: Italy Market Volume (Units) Forecast by Application, 2020-2035
  • Table 109: Spain Market Value (USD Million) Forecast by Product Type, 2020-2035
  • Table 110: Spain Market Volume (Units) Forecast by Product Type, 2020-2035
  • Table 111: Spain Market Value (USD Million) Forecast by Application, 2020-2035
  • Table 112: Spain Market Volume (Units) Forecast by Application, 2020-2035
  • Table 113: BENELUX Market Value (USD Million) Forecast by Product Type, 2020-2035
  • Table 114: BENELUX Market Volume (Units) Forecast by Product Type, 2020-2035
  • Table 115: BENELUX Market Value (USD Million) Forecast by Application, 2020-2035
  • Table 116: BENELUX Market Volume (Units) Forecast by Application, 2020-2035
  • Table 117: Nordic Countries Market Value (USD Million) Forecast by Product Type, 2020-2035
  • Table 118: Nordic Countries Market Volume (Units) Forecast by Product Type, 2020-2035
  • Table 119: Nordic Countries Market Value (USD Million) Forecast by Application, 2020-2035
  • Table 120: Nordic Countries Market Volume (Units) Forecast by Application, 2020-2035
  • Table 121: Russia Market Value (USD Million) Forecast by Product Type, 2020-2035
  • Table 122: Russia Market Volume (Units) Forecast by Product Type, 2020-2035
  • Table 123: Russia Market Value (USD Million) Forecast by Application, 2020-2035
  • Table 124: Russia Market Volume (Units) Forecast by Application, 2020-2035
  • Table 125: Hungary Market Value (USD Million) Forecast by Product Type, 2020-2035
  • Table 126: Hungary Market Volume (Units) Forecast by Product Type, 2020-2035
  • Table 127: Hungary Market Value (USD Million) Forecast by Application, 2020-2035
  • Table 128: Hungary Market Volume (Units) Forecast by Application, 2020-2035
  • Table 129: Poland Market Value (USD Million) Forecast by Product Type, 2020-2035
  • Table 130: Poland Market Volume (Units) Forecast by Product Type, 2020-2035
  • Table 131: Poland Market Value (USD Million) Forecast by Application, 2020-2035
  • Table 132: Poland Market Volume (Units) Forecast by Application, 2020-2035
  • Table 133: Saudi Arabia Market Value (USD Million) Forecast by Product Type, 2020-2035
  • Table 134: Saudi Arabia Market Volume (Units) Forecast by Product Type, 2020-2035
  • Table 135: Saudi Arabia Market Value (USD Million) Forecast by Application, 2020-2035
  • Table 136: Saudi Arabia Market Volume (Units) Forecast by Application, 2020-2035
  • Table 137: Türkiye Market Value (USD Million) Forecast by Product Type, 2020-2035
  • Table 138: Türkiye Market Volume (Units) Forecast by Product Type, 2020-2035
  • Table 139: Türkiye Market Value (USD Million) Forecast by Application, 2020-2035
  • Table 140: Türkiye Market Volume (Units) Forecast by Application, 2020-2035
  • Table 141: South Africa Market Value (USD Million) Forecast by Product Type, 2020-2035
  • Table 142: South Africa Market Volume (Units) Forecast by Product Type, 2020-2035
  • Table 143: South Africa Market Value (USD Million) Forecast by Application, 2020-2035
  • Table 144: South Africa Market Volume (Units) Forecast by Application, 2020-2035
  • Table 145: Global Market Pricing Analysis by Product Type, 2020-2024
  • Table 146: Global Market Price Forecast by Product Type, 2025-2035
  • Table 147: Regional Price Comparison - Enzymes, 2024
  • Table 148: Regional Price Comparison - Kits & Reagents, 2024
  • Table 149: Regional Price Comparison - Services, 2024
  • Table 150: Thermo Fisher Scientific Financial Performance, 2020-2024
  • Table 151: Thermo Fisher Scientific Product Portfolio Analysis, 2024
  • Table 152: New England Biolabs Revenue Breakdown by Product Category, 2024
  • Table 153: New England Biolabs Geographic Presence Analysis, 2024
  • Table 154: Merck KGaA Life Science Division Performance Metrics, 2020-2024
  • Table 155: Merck KGaA Strategic Initiatives Timeline, 2020-2024
  • Table 156: Promega Corporation Innovation Investment Analysis, 2020-2024
  • Table 157: Promega Corporation Market Share by Application, 2024
  • Table 158: TriLink BioTechnologies Service Portfolio Revenue, 2020-2024
  • Table 159: TriLink BioTechnologies Client Retention Metrics, 2024
  • Table 160: QIAGEN N.V. RNA Solutions Business Unit Performance, 2020-2024
  • Table 161: QIAGEN N.V. Strategic Partnerships Impact Analysis, 2024
  • Table 162: Competitive Landscape - Market Share Analysis, 2024
  • Table 163: Top 6 Companies - Revenue Comparison, 2020-2024
  • Table 164: Market Entry Strategies - New Players Analysis, 2023-2024
  • Table 165: Technology Adoption Rate by Company, 2024
  • Table 166: Investment in R&D - Top Companies, 2020-2024
  • Table 167: Patent Portfolio Analysis - Key Players, 2024
  • Table 168: Strategic Alliances and Partnerships Matrix, 2024
  • Table 169: Market Consolidation Trends Analysis, 2020-2024
  • Table 170: Supply Chain Risk Assessment by Company, 2024
  • Table 171: Regulatory Compliance Status - Major Players, 2024
  • Table 172: Sustainability Initiatives Comparison, 2024
  • Table 173: Digital Transformation Progress - Key Companies, 2024
  • Table 174: Customer Satisfaction Scores Analysis, 2024
  • Table 175: Global Manufacturing Capacity Analysis, 2024
  • Table 176: Quality Certifications Matrix - Top Companies, 2024
  • Table 177: Export-Import Trade Analysis by Company, 2024
  • Table 178: COVID-19 Impact Assessment on Key Players, 2020-2024
  • Table 179: Future Growth Strategies - Company Comparison, 2025-2027
  • Table 180: Market Risk Assessment Framework, 2025-2035

List of Figures

  • Figure 1: Global Market Value (USD Million) by Product Type, 2025-2035
  • Figure 2: Global Market Value (USD Million) by Application, 2025-2035
  • Figure 3: Global Market Value (USD Million) by Region, 2025-2035
  • Figure 4: Global Market Value (USD Million) Analysis by Region, 2020-2035
  • Figure 5: Global Market Volume (Units) Analysis by Region, 2020-2035
  • Figure 6: Global Market Value Share (%) and BPS Analysis by Region, 2025-2035
  • Figure 7: Global Market Y-o-Y Growth (%) Projections by Region, 2025-2035
  • Figure 8: Global Market Value (USD Million) Analysis by Product Type, 2020-2035
  • Figure 9: Global Market Volume (Units) Analysis by Product Type, 2020-2035
  • Figure 10: Global Market Value Share (%) and BPS Analysis by Product Type, 2025-2035
  • Figure 11: Global Market Y-o-Y Growth (%) Projections by Product Type, 2025-2035
  • Figure 12: Global Market Value (USD Million) Analysis by Application, 2020-2035
  • Figure 13: Global Market Volume (Units) Analysis by Application, 2020-2035
  • Figure 14: Global Market Value Share (%) and BPS Analysis by Application, 2025-2035
  • Figure 15: Global Market Y-o-Y Growth (%) Projections by Application, 2025-2035
  • Figure 16: Global Market Attractiveness by Product Type, 2025-2035
  • Figure 17: Global Market Attractiveness by Application, 2025-2035
  • Figure 18: Global Market Attractiveness by Region, 2025-2035
  • Figure 19: North America Market Value (USD Million) by Product Type, 2025-2035
  • Figure 20: North America Market Value (USD Million) by Application, 2025-2035
  • Figure 21: North America Market Value (USD Million) by Country, 2025-2035
  • Figure 22: North America Market Value (USD Million) Analysis by Country, 2020-2035
  • Figure 23: North America Market Volume (Units) Analysis by Country, 2020-2035
  • Figure 24: North America Market Value Share (%) and BPS Analysis by Country, 2025-2035
  • Figure 25: North America Market Y-o-Y Growth (%) Projections by Country, 2025-2035
  • Figure 26: North America Market Value (USD Million) Analysis by Product Type, 2020-2035
  • Figure 27: North America Market Volume (Units) Analysis by Product Type, 2020-2035
  • Figure 28: North America Market Value Share (%) and BPS Analysis by Product Type, 2025-2035
  • Figure 29: North America Market Y-o-Y Growth (%) Projections by Product Type, 2025-2035
  • Figure 30: North America Market Value (USD Million) Analysis by Application, 2020-2035
  • Figure 31: North America Market Volume (Units) Analysis by Application, 2020-2035
  • Figure 32: North America Market Value Share (%) and BPS Analysis by Application, 2025-2035
  • Figure 33: North America Market Y-o-Y Growth (%) Projections by Application, 2025-2035
  • Figure 34: North America Market Attractiveness by Product Type, 2025-2035
  • Figure 35: North America Market Attractiveness by Application, 2025-2035
  • Figure 36: North America Market Attractiveness by Country, 2025-2035
  • Figure 37: Latin America Market Value (USD Million) by Product Type, 2025-2035
  • Figure 38: Latin America Market Value (USD Million) by Application, 2025-2035
  • Figure 39: Latin America Market Value (USD Million) by Country, 2025-2035
  • Figure 40: Latin America Market Value (USD Million) Analysis by Country, 2020-2035
  • Figure 41: Latin America Market Volume (Units) Analysis by Country, 2020-2035
  • Figure 42: Latin America Market Value Share (%) and BPS Analysis by Country, 2025-2035
  • Figure 43: Latin America Market Y-o-Y Growth (%) Projections by Country, 2025-2035
  • Figure 44: Latin America Market Value (USD Million) Analysis by Product Type, 2020-2035
  • Figure 45: Latin America Market Volume (Units) Analysis by Product Type, 2020-2035
  • Figure 46: Latin America Market Value Share (%) and BPS Analysis by Product Type, 2025-2035
  • Figure 47: Latin America Market Y-o-Y Growth (%) Projections by Product Type, 2025-2035
  • Figure 48: Latin America Market Value (USD Million) Analysis by Application, 2020-2035
  • Figure 49: Latin America Market Volume (Units) Analysis by Application, 2020-2035
  • Figure 50: Latin America Market Value Share (%) and BPS Analysis by Application, 2025-2035
  • Figure 51: Latin America Market Y-o-Y Growth (%) Projections by Application, 2025-2035
  • Figure 52: Latin America Market Attractiveness by Product Type, 2025-2035
  • Figure 53: Latin America Market Attractiveness by Application, 2025-2035
  • Figure 54: Latin America Market Attractiveness by Country, 2025-2035
  • Figure 55: East Asia Market Value (USD Million) by Product Type, 2025-2035
  • Figure 56: East Asia Market Value (USD Million) by Application, 2025-2035
  • Figure 57: East Asia Market Value (USD Million) by Country, 2025-2035
  • Figure 58: East Asia Market Value (USD Million) Analysis by Country, 2020-2035
  • Figure 59: East Asia Market Volume (Units) Analysis by Country, 2020-2035
  • Figure 60: East Asia Market Value Share (%) and BPS Analysis by Country, 2025-2035
  • Figure 61: East Asia Market Y-o-Y Growth (%) Projections by Country, 2025-2035
  • Figure 62: East Asia Market Value (USD Million) Analysis by Product Type, 2020-2035
  • Figure 63: East Asia Market Volume (Units) Analysis by Product Type, 2020-2035
  • Figure 64: East Asia Market Value Share (%) and BPS Analysis by Product Type, 2025-2035
  • Figure 65: East Asia Market Y-o-Y Growth (%) Projections by Product Type, 2025-2035
  • Figure 66: East Asia Market Value (USD Million) Analysis by Application, 2020-2035
  • Figure 67: East Asia Market Volume (Units) Analysis by Application, 2020-2035
  • Figure 68: East Asia Market Value Share (%) and BPS Analysis by Application, 2025-2035
  • Figure 69: East Asia Market Y-o-Y Growth (%) Projections by Application, 2025-2035
  • Figure 70: East Asia Market Attractiveness by Product Type, 2025-2035
  • Figure 71: East Asia Market Attractiveness by Application, 2025-2035
  • Figure 72: East Asia Market Attractiveness by Country, 2025-2035
  • Figure 73: South Asia & Pacific Market Value (USD Million) by Product Type, 2025-2035
  • Figure 74: South Asia & Pacific Market Value (USD Million) by Application, 2025-2035
  • Figure 75: South Asia & Pacific Market Value (USD Million) by Country, 2025-2035
  • Figure 76: South Asia & Pacific Market Value (USD Million) Analysis by Country, 2020-2035
  • Figure 77: South Asia & Pacific Market Volume (Units) Analysis by Country, 2020-2035
  • Figure 78: South Asia & Pacific Market Value Share (%) and BPS Analysis by Country, 2025-2035
  • Figure 79: South Asia & Pacific Market Y-o-Y Growth (%) Projections by Country, 2025-2035
  • Figure 80: South Asia & Pacific Market Value (USD Million) Analysis by Product Type, 2020-2035
  • Figure 81: South Asia & Pacific Market Volume (Units) Analysis by Product Type, 2020-2035
  • Figure 82: South Asia & Pacific Market Value Share (%) and BPS Analysis by Product Type, 2025-2035
  • Figure 83: South Asia & Pacific Market Y-o-Y Growth (%) Projections by Product Type, 2025-2035
  • Figure 84: South Asia & Pacific Market Value (USD Million) Analysis by Application, 2020-2035
  • Figure 85: South Asia & Pacific Market Volume (Units) Analysis by Application, 2020-2035
  • Figure 86: South Asia & Pacific Market Value Share (%) and BPS Analysis by Application, 2025-2035
  • Figure 87: South Asia & Pacific Market Y-o-Y Growth (%) Projections by Application, 2025-2035
  • Figure 88: South Asia & Pacific Market Attractiveness by Product Type, 2025-2035
  • Figure 89: South Asia & Pacific Market Attractiveness by Application, 2025-2035
  • Figure 90: South Asia & Pacific Market Attractiveness by Country, 2025-2035
  • Figure 91: Western Europe Market Value (USD Million) by Product Type, 2025-2035
  • Figure 92: Western Europe Market Value (USD Million) by Application, 2025-2035
  • Figure 93: Western Europe Market Value (USD Million) by Country, 2025-2035
  • Figure 94: Western Europe Market Value (USD Million) Analysis by Country, 2020-2035
  • Figure 95: Western Europe Market Volume (Units) Analysis by Country, 2020-2035
  • Figure 96: Western Europe Market Value Share (%) and BPS Analysis by Country, 2025-2035
  • Figure 97: Western Europe Market Y-o-Y Growth (%) Projections by Country, 2025-2035
  • Figure 98: Western Europe Market Value (USD Million) Analysis by Product Type, 2020-2035
  • Figure 99: Western Europe Market Volume (Units) Analysis by Product Type, 2020-2035
  • Figure 100: Western Europe Market Value Share (%) and BPS Analysis by Product Type, 2025-2035
  • Figure 101: Western Europe Market Y-o-Y Growth (%) Projections by Product Type, 2025-2035
  • Figure 102: Western Europe Market Value (USD Million) Analysis by Application, 2020-2035
  • Figure 103: Western Europe Market Volume (Units) Analysis by Application, 2020-2035
  • Figure 104: Western Europe Market Value Share (%) and BPS Analysis by Application, 2025-2035
  • Figure 105: Western Europe Market Y-o-Y Growth (%) Projections by Application, 2025-2035
  • Figure 106: Western Europe Market Attractiveness by Product Type, 2025-2035
  • Figure 107: Western Europe Market Attractiveness by Application, 2025-2035
  • Figure 108: Western Europe Market Attractiveness by Country, 2025-2035
  • Figure 109: Eastern Europe Market Value (USD Million) by Product Type, 2025-2035
  • Figure 110: Eastern Europe Market Value (USD Million) by Application, 2025-2035
  • Figure 111: Eastern Europe Market Value (USD Million) by Country, 2025-2035
  • Figure 112: Eastern Europe Market Value (USD Million) Analysis by Country, 2020-2035
  • Figure 113: Eastern Europe Market Volume (Units) Analysis by Country, 2020-2035
  • Figure 114: Eastern Europe Market Value Share (%) and BPS Analysis by Country, 2025-2035
  • Figure 115: Eastern Europe Market Y-o-Y Growth (%) Projections by Country, 2025-2035
  • Figure 116: Eastern Europe Market Value (USD Million) Analysis by Product Type, 2020-2035
  • Figure 117: Eastern Europe Market Volume (Units) Analysis by Product Type, 2020-2035
  • Figure 118: Eastern Europe Market Value Share (%) and BPS Analysis by Product Type, 2025-2035
  • Figure 119: Eastern Europe Market Y-o-Y Growth (%) Projections by Product Type, 2025-2035
  • Figure 120: Eastern Europe Market Value (USD Million) Analysis by Application, 2020-2035
  • Figure 121: Eastern Europe Market Volume (Units) Analysis by Application, 2020-2035
  • Figure 122: Eastern Europe Market Value Share (%) and BPS Analysis by Application, 2025-2035
  • Figure 123: Eastern Europe Market Y-o-Y Growth (%) Projections by Application, 2025-2035
  • Figure 124: Eastern Europe Market Attractiveness by Product Type, 2025-2035
  • Figure 125: Eastern Europe Market Attractiveness by Application, 2025-2035
  • Figure 126: Eastern Europe Market Attractiveness by Country, 2025-2035
  • Figure 127: Middle East & Africa Market Value (USD Million) by Product Type, 2025-2035
  • Figure 128: Middle East & Africa Market Value (USD Million) by Application, 2025-2035
  • Figure 129: Middle East & Africa Market Value (USD Million) by Country, 2025-2035
  • Figure 130: Middle East & Africa Market Value (USD Million) Analysis by Country, 2020-2035
  • Figure 131: Middle East & Africa Market Volume (Units) Analysis by Country, 2020-2035
  • Figure 132: Middle East & Africa Market Value Share (%) and BPS Analysis by Country, 2025-2035
  • Figure 133: Middle East & Africa Market Y-o-Y Growth (%) Projections by Country, 2025-2035
  • Figure 134: Middle East & Africa Market Value (USD Million) Analysis by Product Type, 2020-2035
  • Figure 135: Middle East & Africa Market Volume (Units) Analysis by Product Type, 2020-2035
  • Figure 136: Middle East & Africa Market Value Share (%) and BPS Analysis by Product Type, 2025-2035
  • Figure 137: Middle East & Africa Market Y-o-Y Growth (%) Projections by Product Type, 2025-2035
  • Figure 138: Middle East & Africa Market Value (USD Million) Analysis by Application, 2020-2035
  • Figure 139: Middle East & Africa Market Volume (Units) Analysis by Application, 2020-2035
  • Figure 140: Middle East & Africa Market Value Share (%) and BPS Analysis by Application, 2025-2035
  • Figure 141: Middle East & Africa Market Y-o-Y Growth (%) Projections by Application, 2025-2035
  • Figure 142: Middle East & Africa Market Attractiveness by Product Type, 2025-2035
  • Figure 143: Middle East & Africa Market Attractiveness by Application, 2025-2035
  • Figure 144: Middle East & Africa Market Attractiveness by Country, 2025-2035
  • Figure 145: USA Market Share (%) by Product Type, 2024
  • Figure 146: USA Market Share (%) by Application, 2024
  • Figure 147: Brazil Market Share (%) by Product Type, 2024
  • Figure 148: Brazil Market Share (%) by Application, 2024
  • Figure 149: China Market Share (%) by Product Type, 2024
  • Figure 150: China Market Share (%) by Application, 2024
  • Figure 151: India Market Share (%) by Product Type, 2024
  • Figure 152: India Market Share (%) by Application, 2024
  • Figure 153: Japan Market Share (%) by Product Type, 2024
  • Figure 154: Japan Market Share (%) by Application, 2024
  • Figure 155: Germany Market Share (%) by Product Type, 2024
  • Figure 156: Germany Market Share (%) by Application, 2024
  • Figure 157: France Market Share (%) by Product Type, 2024
  • Figure 158: France Market Share (%) by Application, 2024
  • Figure 159: UK Market Share (%) by Product Type, 2024
  • Figure 160: UK Market Share (%) by Application, 2024
  • Figure 161: Global Market Competitive Landscape Dashboard, 2024
  • Figure 162: Global Market Company Market Share Analysis, 2024
  • Figure 163: Thermo Fisher Scientific Revenue Breakdown by Business Segment, 2024
  • Figure 164: Thermo Fisher Scientific Geographic Revenue Distribution, 2024
  • Figure 165: New England Biolabs Product Portfolio Analysis, 2024
  • Figure 166: New England Biolabs Sales Channel Distribution, 2024
  • Figure 167: Merck KGaA Life Science Division Revenue Trend, 2020-2024
  • Figure 168: Merck KGaA Regional Market Presence Analysis, 2024
  • Figure 169: Promega Corporation Product Innovation Timeline, 2020-2024
  • Figure 170: Promega Corporation Market Penetration by Region, 2024
  • Figure 171: TriLink BioTechnologies Service Portfolio Evolution, 2020-2024
  • Figure 172: TriLink BioTechnologies Client Base Analysis, 2024
  • Figure 173: QIAGEN N.V. RNA Solutions Revenue Growth, 2020-2024
  • Figure 174: QIAGEN N.V. Strategic Partnership Network, 2024
  • Figure 175: Global Market Price Trend Analysis by Product Type, 2020-2024
  • Figure 176: Global Market Price Forecast by Product Type, 2025-2035
  • Figure 177: Regional Price Comparison for Products, 2024
  • Figure 178: Competitive Pricing Analysis - Top 6 Companies, 2024
  • Figure 179: Global Market Technology Adoption Trends, 2020-2024
  • Figure 180: Innovation Pipeline Analysis - Key Market Players, 2020-2024

Frequently Asked Questions

How big is the enzymatic RNA manufacturing market in 2025?

The global enzymatic RNA manufacturing market is valued at USD 1,357.4 million in 2025.

What will be the size of enzymatic RNA manufacturing market in 2035?

The size for the enzymatic RNA manufacturing market is projected to reach USD 3,184.1 million by 2035.

How much will be the enzymatic RNA manufacturing market growth between 2025 and 2035?

The enzymatic RNA manufacturing market is expected to grow at an 8.9% CAGR between 2025 and 2035.

What are the key product type segments in the enzymatic RNA manufacturing market?

The key product type segments in the enzymatic RNA manufacturing market are enzymes, kits & reagents, and services.

Which application segment is expected to contribute significant share in the enzymatic RNA manufacturing market in 2025?

In terms of application, hospitals segment is set to command 57.8% share in the enzymatic RNA manufacturing market in 2025.

Explore Similar Insights

Future Market Insights

Enzymatic RNA Manufacturing Market

Chat With

MaRIA

Hi There, I am MaRIA, Your Market Research Intelligence Assistant. How may I help you?