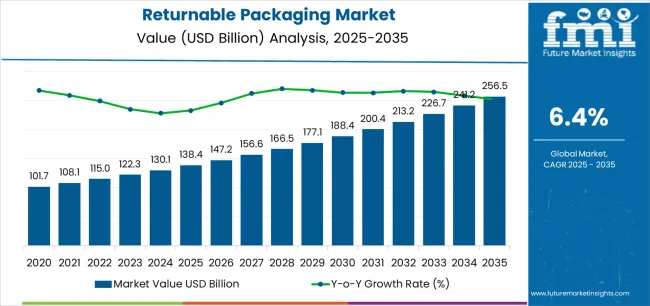
The Returnable Packaging Market is estimated to be valued at USD 138.4 billion in 2025 and is projected to reach USD 256.5 billion by 2035, registering a compound annual growth rate (CAGR) of 6.4% over the forecast period.:
The returnable packaging market is growing steadily, supported by the shift toward circular economy models and increasing emphasis on cost-effective, sustainable logistics solutions. Rising global trade activities, particularly in automotive, food, and consumer goods sectors, have accelerated adoption.
Returnable systems reduce packaging waste, enhance supply chain efficiency, and deliver long-term cost savings, making them attractive to manufacturers and distributors. The market benefits from advancements in durable materials, tracking technologies, and modular designs that extend lifecycle and improve traceability.
Growing regulatory support for waste reduction and corporate sustainability initiatives are further driving market expansion. As industries prioritize eco-friendly operations and reverse logistics optimization, the returnable packaging market is expected to experience sustained growth across diverse end-use sectors..
| Metric | Value |
|---|---|
| Returnable Packaging Market Estimated Value in (2025 E) | USD 138.4 billion |
| Returnable Packaging Market Forecast Value in (2035 F) | USD 256.5 billion |
| Forecast CAGR (2025 to 2035) | 6.4% |
The market is segmented by Material, Product, and End Use and region. By Material, the market is divided into Plastic, Metal, and Wood. In terms of Product, the market is classified into Pallets, Crates, IBCs, Drums And Barrels, Dunnage, and Others. Based on End Use, the market is segmented into Food And Beverage, Automotive, Consumer Durables, Healthcare, and Others. Regionally, the market is classified into North America, Latin America, Western Europe, Eastern Europe, Balkan & Baltic Countries, Russia & Belarus, Central Asia, East Asia, South Asia & Pacific, and the Middle East & Africa.
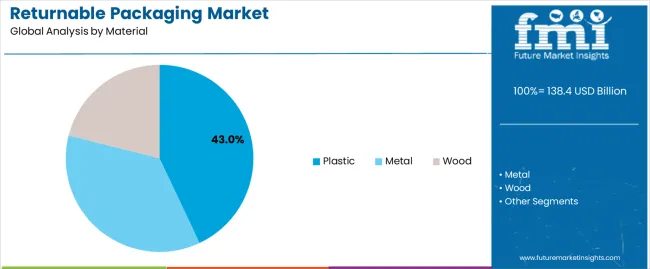
The plastic segment leads the material category with approximately 43.00% share, owing to its durability, lightweight properties, and cost-effectiveness compared to metal or wood alternatives. Reusable plastic containers and pallets offer superior resistance to impact, moisture, and chemical exposure, extending their operational lifespan.
The segment benefits from advances in recyclable and high-density polymer formulations, aligning with sustainability objectives. Its widespread use across automotive, food, and electronics sectors reinforces dominance.
With continued innovation in material engineering and closed-loop recycling systems, the plastic segment is anticipated to maintain its leadership position..
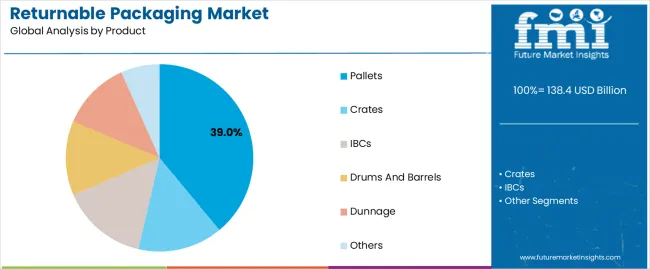
The pallets segment dominates the product category with approximately 39.00% share, driven by their essential role in handling, storage, and transportation efficiency across supply chains. Pallets offer standardized design and high load-bearing capacity, enabling smooth integration into automated warehousing and logistics systems.
The shift toward reusable pallet pooling systems has further fueled demand by reducing waste and operational costs. Adoption is expanding in fast-moving consumer goods and industrial sectors due to the growing emphasis on operational efficiency.
With continuous developments in RFID tracking and lightweight designs, the pallets segment is expected to sustain its leading share in the market..
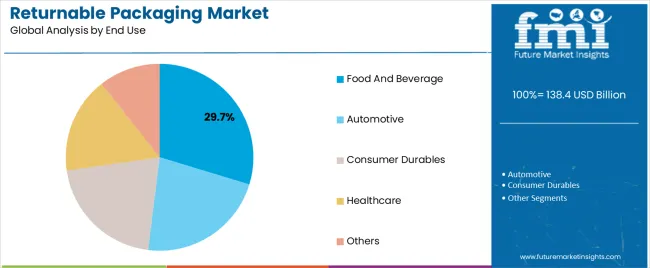
The food and beverage segment holds approximately 29.70% share in the end-use category, supported by strict hygiene standards and the need for repeated, safe transport of goods. Returnable packaging ensures contamination-free handling and reduces single-use plastic dependency.
Widespread use of crates, pallets, and containers for beverage distribution and bulk food supply reinforces dominance. The segment benefits from growing sustainability commitments among major food producers and retailers.
As global demand for packaged and perishable goods continues to rise, the food and beverage sector is expected to remain a leading end user in the returnable packaging market..
The scope for returnable packaging rose at a 9.2% CAGR between 2020 and 2025. The global market is anticipated to grow at a moderate CAGR of 6.7% over the forecast period 2025 to 2035.
The market experienced steady growth during the historical period from 2020 to 2025, driven by factors such as increasing environmental awareness. Over the past few years, there has been a significant rise in environmental awareness among consumers and businesses alike.
Governments and regulatory bodies around the world have been implementing stricter regulations and policies aimed at reducing single use plastics and promoting sustainable packaging alternatives. Compliance with these regulations has motivated businesses to adopt returnable packaging solutions as part of their sustainability initiatives.
Looking ahead to the forecast period from 2025 to 2035, the market is expected to witness significant growth. The period is likely to witness continued advancements in material science, packaging technology, and automation, driving innovation in returnable packaging solutions.
The market for returnable packaging is expected to expand into new industries and applications beyond traditional sectors such as automotive and retail. Industries such as healthcare, electronics, and agriculture are likely to adopt returnable packaging solutions to improve efficiency, reduce waste, and enhance product safety and integrity.
Advances in material science and packaging technology have LED to the development of innovative returnable packaging solutions that offer improved durability, performance, and customization options.
Implementing returnable packaging systems often requires a significant upfront investment in durable materials, infrastructure, and logistics. For some businesses, especially smaller enterprises or those operating on tight budgets, the initial cost may act as a barrier to adoption.
The below table showcases revenues in terms of the top 5 leading countries, spearheaded by Korea and the United Kingdom. The countries are expected to lead the market through 2035.
| Countries | Forecast CAGRs from 2025 to 2035 |
|---|---|
| The United States | 6.9% |
| China | 7.2% |
| The United Kingdom | 7.6% |
| Japan | 7.5% |
| Korea | 9.1% |
The returnable packaging market in the United States expected to expand at a CAGR of 6.9% through 2035. Returnable packaging offers long term cost savings and operational efficiency benefits for businesses.
While the initial investment may be higher, returnable packaging can be reused multiple times, reducing the need for constant replenishment of packaging materials and lowering overall packaging costs.
The rapid growth of e-commerce in the country has increased the demand for efficient packaging solutions that can withstand the rigors of online retail and home delivery. Returnable packaging helps minimize shipping costs, reduce product damage, and enhance the overall customer experience in the e-commerce sector.
The returnable packaging market in the United Kingdom is anticipated to expand at a CAGR of 7.6% through 2035. Ongoing advancements in packaging technology and materials science drive innovation in returnable packaging solutions.
Manufacturers are developing new materials, designs, and technologies to improve the durability, functionality, and sustainability of returnable packaging options available in the market.
Collaboration among stakeholders across the packaging value chain, including manufacturers, retailers, logistics providers, and industry associations, is essential for driving the adoption of returnable packaging solutions in the country. Strategic partnerships and alliances facilitate knowledge sharing, innovation, and market expansion efforts.
Returnable packaging trends in China are taking a turn for the better. A 7.2% CAGR is forecast for the country from 2025 to 2035. The expansion of retail chains, supermarkets, and manufacturing industries in China creates opportunities for returnable packaging solutions to optimize supply chain operations and reduce packaging waste.
Returnable packaging systems can help Chinese businesses improve inventory management, reduce product losses, and enhance overall operational efficiency.
The country is a major player in global trade and exports a wide range of products to markets around the world. Adopting returnable packaging solutions can help Chinese exporters meet sustainability requirements and compliance standards in international markets, enhancing their competitiveness and market access.
The returnable packaging market in Japan is poised to expand at a CAGR of 7.5% through 2035. In industries such as food and beverage, returnable packaging helps maintain product freshness, integrity, and safety throughout the supply chain.
Returnable packaging solutions designed for food products comply with stringent food safety standards and regulations, ensuring that products reach consumers in optimal condition.
Japanese businesses are increasingly recognizing the importance of corporate social responsibility and sustainability in building brand reputation and competitive advantage. Adopting returnable packaging solutions demonstrates a commitment to environmental stewardship and can enhance the overall reputation and credibility of businesses in the Japanese market.
The returnable packaging market in Korea is anticipated to expand at a CAGR of 9.1% through 2035. The country has made significant efforts to address waste management issues and promote recycling initiatives.
Returnable packaging aligns with the goals of country for waste reduction and resource conservation, offering a sustainable alternative to single use packaging materials and contributing to the circular economy.
Public awareness campaigns and education initiatives play a crucial role in shaping consumer behavior and encouraging the adoption of sustainable practices, including the use of returnable packaging.
Consumers are informed about the environmental benefits of returnable packaging and encouraged to make eco conscious choices, through educational programs, government initiatives, and media campaigns.
The below table highlights how plastic segment is projected to lead the market in terms of material, and is expected to account for a CAGR of 6.5% through 2035. Based on product, the pallets segment is expected to account for a CAGR of 6.4% through 2035.
| Category | CAGR through 2035 |
|---|---|
| Plastic | 6.5% |
| Pallets | 6.4% |
Based on material, the plastic segment is expected to continue dominating the returnable packaging market. Plastic materials offer versatility and customization options, allowing manufacturers to design returnable packaging solutions that meet specific product requirements, shapes, and sizes. Plastic packaging can be molded, extruded, or formed into various shapes and configurations to accommodate different products and applications.
Plastic packaging is known for its durability and longevity, making it well suited for multiple reuse cycles in returnable packaging systems. High quality plastic materials, such as polyethylene, polypropylene, and polycarbonate, can withstand the rigors of transportation, handling, and storage without compromising product protection or integrity.
In terms of product, the pallets segment is expected to continue dominating the returnable packaging market. Pallets are essential for efficient material handling and logistics operations in warehouses, distribution centers, and manufacturing facilities. They provide a stable and standardized platform for stacking, storing, and transporting goods, facilitating the movement of materials throughout the supply chain.
Returnable pallets can be customized to meet specific size, weight, and configuration requirements based on the needs of different industries and applications. Standardized pallet dimensions and specifications facilitate compatibility with automated handling systems, storage racks, and transportation equipment, improving interoperability and efficiency in the supply chain.
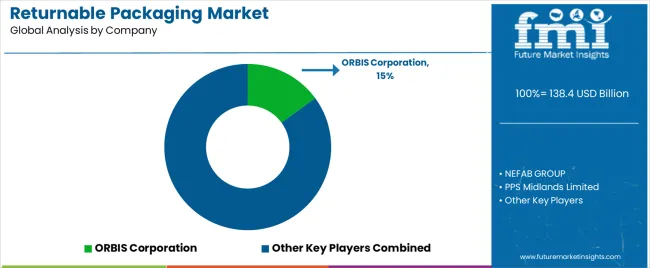 p>The competitive landscape of the returnable packaging market is characterized by the presence of numerous players offering a wide range of returnable packaging solutions tailored to the diverse needs of industries across various sectors.
Company Portfolio
| Attribute | Details |
|---|---|
| Estimated Market Size in 2025 | USD 129.7 billion |
| Projected Market Valuation in 2035 | USD 248.0 billion |
| Value-based CAGR 2025 to 2035 | 6.7% |
| Forecast Period | 2025 to 2035 |
| Historical Data Available for | 2020 to 2025 |
| Market Analysis | Value in USD billion |
| Key Regions Covered | North America; Latin America; Western Europe; Eastern Europe; South Asia and Pacific; East Asia; The Middle East & Africa |
| Key Market Segments Covered | Material, Product, End Use, Region |
| Key Countries Profiled | The United States, Canada, Brazil, Mexico, Germany, France, France, Spain, Italy, Russia, Poland, Czech Republic, Romania, India, Bangladesh, Australia, New Zealand, China, Japan, South Korea, GCC countries, South Africa, Israel |
| Key Companies Profiled | ORBIS Corporation; NEFAB GROUP; PPS Midlands Limited; Tri-pack Packaging Systems Ltd.; Amatech Inc.; CHEP; Celina; UBEECO Packaging Solutions; RPR Inc.; RPP Containers; IPL Inc.; Schoeller Allibert |
The global returnable packaging market is estimated to be valued at USD 138.4 billion in 2025.
The market size for the returnable packaging market is projected to reach USD 256.5 billion by 2035.
The returnable packaging market is expected to grow at a 6.4% CAGR between 2025 and 2035.
The key product types in returnable packaging market are plastic, metal and wood.
In terms of product, pallets segment to command 39.0% share in the returnable packaging market in 2025.


Our Research Products

The "Full Research Suite" delivers actionable market intel, deep dives on markets or technologies, so clients act faster, cut risk, and unlock growth.

The Leaderboard benchmarks and ranks top vendors, classifying them as Established Leaders, Leading Challengers, or Disruptors & Challengers.

Locates where complements amplify value and substitutes erode it, forecasting net impact by horizon

We deliver granular, decision-grade intel: market sizing, 5-year forecasts, pricing, adoption, usage, revenue, and operational KPIs—plus competitor tracking, regulation, and value chains—across 60 countries broadly.

Spot the shifts before they hit your P&L. We track inflection points, adoption curves, pricing moves, and ecosystem plays to show where demand is heading, why it is changing, and what to do next across high-growth markets and disruptive tech

Real-time reads of user behavior. We track shifting priorities, perceptions of today’s and next-gen services, and provider experience, then pace how fast tech moves from trial to adoption, blending buyer, consumer, and channel inputs with social signals (#WhySwitch, #UX).

Partner with our analyst team to build a custom report designed around your business priorities. From analysing market trends to assessing competitors or crafting bespoke datasets, we tailor insights to your needs.
Supplier Intelligence
Discovery & Profiling
Capacity & Footprint
Performance & Risk
Compliance & Governance
Commercial Readiness
Who Supplies Whom
Scorecards & Shortlists
Playbooks & Docs
Category Intelligence
Definition & Scope
Demand & Use Cases
Cost Drivers
Market Structure
Supply Chain Map
Trade & Policy
Operating Norms
Deliverables
Buyer Intelligence
Account Basics
Spend & Scope
Procurement Model
Vendor Requirements
Terms & Policies
Entry Strategy
Pain Points & Triggers
Outputs
Pricing Analysis
Benchmarks
Trends
Should-Cost
Indexation
Landed Cost
Commercial Terms
Deliverables
Brand Analysis
Positioning & Value Prop
Share & Presence
Customer Evidence
Go-to-Market
Digital & Reputation
Compliance & Trust
KPIs & Gaps
Outputs
Full Research Suite comprises of:
Market outlook & trends analysis
Interviews & case studies
Strategic recommendations
Vendor profiles & capabilities analysis
5-year forecasts
8 regions and 60+ country-level data splits
Market segment data splits
12 months of continuous data updates
DELIVERED AS:
PDF EXCEL ONLINE
Returnable Circular Packaging Market Analysis - Size, Share, and Forecast Outlook 2025 to 2035
Returnable Transport Packaging Market Analysis by Metal, Plastic, Paper, and Wood Through 2035
North America Returnable Transport Packaging Market Trends – Forecast 2023-2033
Packaging Supply Market Size and Share Forecast Outlook 2025 to 2035
Packaging Testing Services Market Size and Share Forecast Outlook 2025 to 2035
Packaging Tubes Market Size and Share Forecast Outlook 2025 to 2035
Packaging Jar Market Forecast and Outlook 2025 to 2035
Packaging Barrier Film Market Size and Share Forecast Outlook 2025 to 2035
Packaging Films Market Size and Share Forecast Outlook 2025 to 2035
Packaging Laminate Market Size and Share Forecast Outlook 2025 to 2035
Packaging Burst Strength Test Market Size and Share Forecast Outlook 2025 to 2035
Packaging Tapes Market Analysis - Size, Share, & Forecast Outlook 2025 to 2035
Returnable Plastic Crate Market Size and Share Forecast Outlook 2025 to 2035
Packaging Materials Market Size and Share Forecast Outlook 2025 to 2035
Packaging Labels Market Size and Share Forecast Outlook 2025 to 2035
Packaging Equipment Market Size and Share Forecast Outlook 2025 to 2035
Packaging Resins Market Size and Share Forecast Outlook 2025 to 2035
Packaging Inspection Systems Market Size and Share Forecast Outlook 2025 to 2035
Packaging Design And Simulation Technology Market Size and Share Forecast Outlook 2025 to 2035
Packaging Suction Cups Market Size and Share Forecast Outlook 2025 to 2035

Thank you!
You will receive an email from our Business Development Manager. Please be sure to check your SPAM/JUNK folder too.
Chat With
MaRIA