The ex proof incremental encoders market is projected to exhibit a steady growth trajectory between 2025 and 2035, with a compound annual growth rate (CAGR) of 4.5%. The market value is anticipated to rise from USD 1,223.9 million in 2025 to USD 1,901 million by 2035, reflecting increasing demand for precision motion control devices in hazardous industrial environments. Incremental encoders are critical in applications where positional accuracy, rotational speed monitoring, and feedback are essential under explosive atmospheres, including oil and gas, chemical, and mining sectors. The adoption of ex proof-certified encoders is being driven by the need to ensure operational safety while maintaining high performance, as industries prioritize equipment that can endure extreme conditions, vibrations, and corrosive surroundings. Enhanced durability and compliance with international safety standards reinforce the market’s appeal, positioning ex proof incremental encoders as essential components in automated and semi-automated industrial systems.
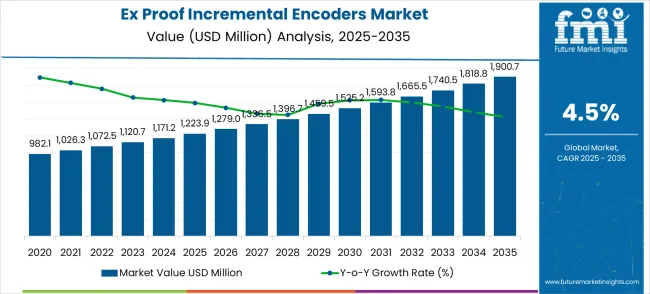
The growth of the ex proof incremental encoders market is influenced by increasing automation across industrial facilities and the demand for reliable, explosion-proof position sensing solutions. As industries expand operations in challenging environments, the deployment of encoders capable of providing accurate feedback while withstanding hazardous conditions is being prioritized. Continuous improvements in housing materials, sealing technologies, and electronic components have strengthened the reliability of these encoders, supporting long-term adoption. Regional expansion, particularly in emerging industrial hubs, is expected to drive additional demand, as compliance with safety regulations becomes a critical factor in plant design and operation. The market demonstrates a consistent upward trend, with incremental encoders being increasingly integrated into conveyor systems, pumps, motors, and process automation equipment, reinforcing their strategic role in ensuring precision, safety, and efficiency across hazardous industrial applications.
| Metric | Value |
|---|---|
| Estimated Value in (2025E) | USD 1,223.9 million |
| Forecast Value in (2035F) | USD 1,900.7 million |
| Forecast CAGR (2025 to 2035) | 4.5% |
The ex proof incremental encoders market has been established as an essential segment within industrial and process automation, particularly for environments where explosive atmospheres demand rigorous safety standards. Within the industrial automation market, this segment contributes approximately 9.3% share, as these encoders provide precise motion feedback in critical machinery. In the rotary and linear encoder market, the share is around 10.7%, reflecting their widespread adoption for high-accuracy position and speed measurement in mechanical and electrical systems. The process instrumentation market records a 9.9% share, as incremental encoders are integrated into instruments for continuous monitoring and control of industrial operations.
Within the hazardous area equipment market, the share stands at 8.5%, driven by the requirement for explosion-proof certification in chemical, oil, and gas industries. The factory automation market contributes roughly 9.1%, as manufacturing lines rely on these encoders for synchronized motion control and operational efficiency. Combined, these parent markets account for about 47.5%, highlighting the pivotal role of Ex proof incremental encoders in ensuring safety, precision, and reliability in interconnected industrial ecosystems. The market has been viewed as fundamental for safeguarding equipment performance and maintaining accuracy in high-risk operational environments.
The Ex proof incremental encoders market is set for steady growth, fueled by oil & gas safety standards, chemical industry compliance, and demand for rugged automation solutions. By 2035, these pathways together unlock USD 0.65–0.75 billion in incremental revenue opportunities, expanding the market from USD 1,223.9 million (2025) to USD 1,900.7 million (2035) at a 4.5% CAGR.
Pathway A – Oil & Gas Safety Systems. Encoders designed for explosive environments ensure compliance with ATEX and IECEx standards in upstream and downstream operations. The largest near-term pool worth USD 0.20–0.25 billion.
Pathway B – Chemical Industry Compliance. Rising chemical and petrochemical plant expansions demand encoders with high resistance to corrosive environments. Expected pool: USD 0.12–0.16 billion.
Pathway C – Food & Beverage Automation. Explosion-proof encoders ensure safe handling of combustible powders and vapors in food processing. Incremental pool: USD 0.10–0.14 billion.
Pathway D – Steel & Heavy Machinery. Robust encoders for steel plants, mining equipment, and heavy-duty machinery boost operational safety. Pool: USD 0.08–0.12 billion.
Pathway E – Regional Hotspots. High growth in China (6.1% CAGR) and India (5.6% CAGR) drives adoption, while Germany and Brazil anchor industrial safety demand. Pool: USD 0.07–0.10 billion.
Pathway F – Digital Integration & Smart Encoders. Integration with Industry 4.0, predictive maintenance, and IoT platforms enhances safety monitoring. Unlocks USD 0.05–0.08 billion.
Pathway G – Specialized Certified Designs. Ex-proof certified encoders (ATEX, IECEx, UL) open premium segments in Europe and North America. Smaller but impactful pool of USD 0.03–0.05 billion.
Market expansion is being supported by the rapid increase in industrial automation across hazardous environments worldwide and the corresponding need for safety-certified motion control equipment to ensure operational safety and regulatory compliance. Modern process industries rely on precise encoder systems to monitor rotational movement and position feedback in explosive atmospheres while maintaining intrinsic safety standards. Explosion-proof encoders enable operators to implement advanced automation systems in hazardous locations without compromising safety requirements or operational efficiency.
The growing complexity of process automation and increasing focus on operational safety are driving demand for certified ex proof encoder solutions from manufacturers with appropriate safety certifications and technical expertise. Regulatory agencies are increasingly requiring comprehensive hazardous area classification compliance for all electrical equipment installed in explosive atmospheres. Industry standards and safety regulations are establishing stringent certification procedures that require specialized designs and rigorous testing protocols for optimal safety performance.
The market is segmented by shaft size, end-use industry, and region. By shaft size, the market is divided into shaft size up to 25 mm, shaft sizes 25-100 mm, and shaft sizes above 100 mm. Based on end-use industry, the market is categorized into oil and gas, chemicals, food and beverages, steel, machinery, and others. Regionally, the market is divided into North America, Europe, East Asia, South Asia & Pacific, Latin America, and Middle East & Africa.
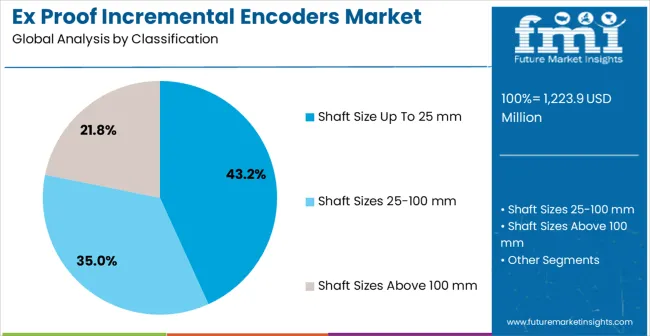
Shaft size up to 25 mm Ex proof incremental encoders are projected to account for 43.2% of the Ex proof incremental encoders market in 2025. This leading share is supported by the widespread adoption of compact encoder solutions in process automation applications, which represent the majority of current installations requiring space-efficient designs and versatile mounting options. Small shaft encoders provide optimal integration capabilities while maintaining explosion-proof certification for most industrial automation applications including valve position monitoring, pump speed control, and conveyor system feedback. The segment benefits from established manufacturing procedures and comprehensive product availability from multiple certified suppliers. These encoders offer precise measurement performance for critical process control applications while ensuring consistent safety standards across hazardous industrial environments and maintaining competitive pricing structures for automation system integrators.
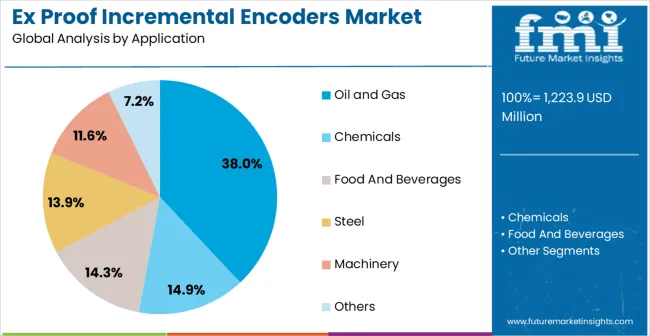
Oil and gas end-use applications are expected to represent 38% of Ex proof incremental encoder demand in 2025. This dominant share reflects the extensive use of explosion-proof automation equipment in upstream, midstream, and downstream petroleum operations that require certified safety systems for hazardous location compliance. Modern oil and gas facilities increasingly feature complex process automation that requires coordinated encoder installations for optimal equipment monitoring and control system integration across diverse operating environments. The segment benefits from stringent safety regulations and increasing emphasis on operational efficiency optimization supporting advanced automation technology adoption. Market expansion continues as operators seek reliable motion control solutions for critical rotating equipment and precision positioning applications requiring certified explosion-proof performance and enhanced operational safety capabilities.
The Ex proof incremental encoders market has been influenced by growing industrial automation, process control requirements, and stringent safety standards in hazardous environments. Trends indicate increasing adoption in oil and gas, chemical, and energy sectors, emphasizing reliability and precision in motion control. Challenges persist in ensuring compliance with explosion-proof certifications, maintaining high performance under extreme conditions, and managing installation complexities. Companies are focusing on robust product designs, integrated monitoring systems, and industry-specific solutions to maximize safety and operational efficiency while meeting regulatory requirements in diverse industrial applications.
The Ex proof incremental encoders market has been shaped by emerging trends emphasizing adoption across hazardous industrial environments such as oil and gas, petrochemicals, and energy production. In opinion, industries are increasingly prioritizing explosion-proof motion control solutions to enhance safety, maintain operational continuity, and comply with international standards such as ATEX and IECEx. Adoption of encoders with integrated diagnostic capabilities and real-time monitoring is being observed, allowing operators to detect anomalies and prevent potential failures proactively. Trends also indicate increasing interest in modular and customizable encoders that cater to diverse environmental conditions, including extreme temperatures, vibration, and corrosive atmospheres. These trends highlight how safety, reliability, and precise motion measurement are becoming critical factors driving encoder adoption in hazardous industrial settings.
The Ex proof incremental encoders market faces persistent challenges associated with achieving regulatory certifications, maintaining operational reliability in harsh conditions, and integrating with existing industrial systems. In opinion, obtaining approvals for explosion-proof compliance under standards like ATEX, IECEx, and UL can be complex and time-consuming, creating entry barriers for manufacturers. Operational challenges also arise in environments with extreme temperatures, high vibration, or chemical exposure, which can affect sensor accuracy and lifespan. Furthermore, integrating encoders into legacy systems or multi-vendor industrial automation platforms often requires extensive customization, increasing project costs and installation complexity. Overcoming these challenges is essential for enhancing market adoption, as manufacturers and end-users seek reliable, compliant, and easily integrated explosion-proof solutions for critical industrial operations.
| Country | CAGR (2025-2035) | |
|---|---|---|
| China | 6.1% | |
| India | 5.6% | |
| Germany | 5.2% | |
| Brazil | 4.7% | |
| United States | 4.3% | |
| United Kingdom | 3.8% | |
| Japan | 3.4% |
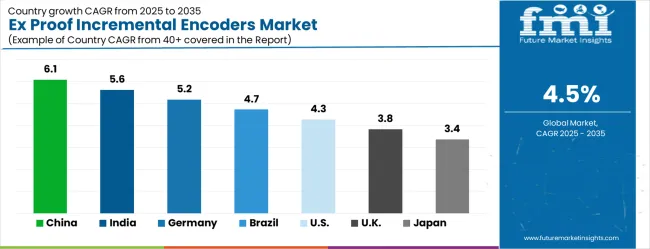
The ex proof incremental encoders market is growing steadily, with China leading at a 6.1% CAGR through 2035, driven by massive petrochemical industry expansion, growing process automation adoption, and comprehensive safety regulation implementation supporting explosion-proof equipment demand. India follows at 5.6%, supported by expanding chemical manufacturing sector and increasing government initiatives promoting industrial safety and automation technology adoption. Germany records 5.2%, emphasizing precision engineering, advanced safety certification, and stringent hazardous area compliance standards. Brazil grows at 4.7%, integrating explosion-proof automation systems into established oil and gas operations and expanding chemical processing facilities. The United States shows 4.3% growth, focusing on offshore drilling automation and petrochemical facility modernization. The United Kingdom and Japan demonstrate steady growth at 3.8% and 3.4% respectively, driven by industrial safety upgrades and advanced automation system adoption.
The report covers an in-depth analysis of 40+ countries; seven top-performing countries are highlighted below.
The ex proof incremental encoders market in China is growing at a CAGR of 6.1%, driven by increasing industrial automation and adoption in hazardous environments across chemical, oil and gas, and manufacturing sectors. Chinese manufacturers are investing in high-precision, explosion-proof encoder solutions to enhance operational efficiency and safety. Regulatory compliance and government initiatives supporting industrial safety further drive adoption. Rising infrastructure projects and modernization of industrial facilities continue to boost demand for incremental encoders with explosion-proof capabilities.
The ex proof incremental encoders market in India is projected to grow at a CAGR of 5.6%, supported by rising industrial automation and adoption in chemical, oil and gas, and heavy manufacturing sectors. India’s focus on operational safety and regulatory compliance is fueling the adoption of explosion-proof encoder solutions. Increasing modernization of industrial plants and demand for precise motion control further drive market growth. Indian manufacturers and integrators continue to implement advanced incremental encoders to ensure performance and safety in critical applications.
The ex proof incremental encoders market in Germany is growing at a CAGR of 5.2%, driven by adoption in chemical, manufacturing, and energy sectors. Germany’s emphasis on reliability, precision, and safety in industrial operations supports demand for explosion-proof encoders. Investments in automation, process monitoring, and predictive maintenance enhance market growth. The country’s strong industrial infrastructure and focus on quality engineering ensure steady adoption of ex proof incremental encoders across hazardous applications.
The ex proof incremental encoders market in Brazil is projected to grow at a CAGR of 4.7%, driven by demand from industrial sectors such as chemical, oil and gas, and energy. Brazil’s emphasis on industrial safety and adoption of automation technologies fuels the use of explosion-proof incremental encoders. Expanding and modernizing industrial facilities further supports market growth. The country’s requirement for reliable and durable encoders in hazardous environments continues to drive adoption.
The ex proof incremental encoders market in the United States is growing at a CAGR of 4.3%, driven by adoption in hazardous environments across chemical, oil and gas, and manufacturing sectors. USA companies are integrating explosion-proof incremental encoders with industrial automation and monitoring systems to improve safety and efficiency. Investments in predictive maintenance and advanced process control further support market growth. The demand for reliable, high-performance incremental encoders continues to increase in critical industrial applications.
The ex proof incremental encoders market in the United Kingdom is growing at a CAGR of 3.8%, supported by adoption in chemical, oil and gas, and manufacturing sectors. UK industries are investing in explosion-proof incremental encoders to comply with safety standards and improve operational efficiency. Industrial automation, hazard prevention, and precision motion control further support market growth. Steady adoption is observed as businesses prioritize safety and reliability in critical industrial applications.
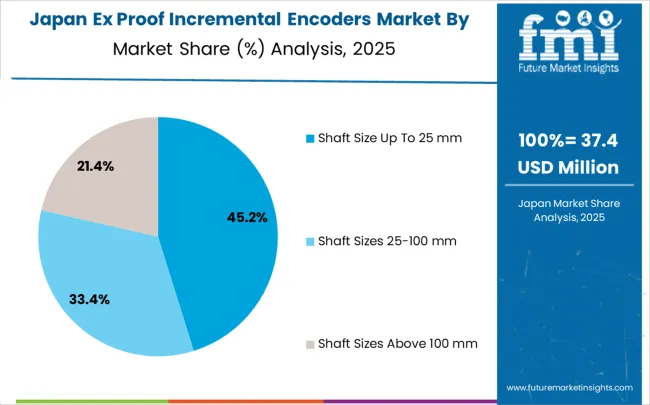
The ex proof incremental encoders market in Japan is expanding at a CAGR of 3.4%, driven by adoption in chemical, manufacturing, and energy sectors requiring explosion-proof solutions. Japanese industries prioritize operational safety, precision, and durability, supporting steady demand for ex proof incremental encoders. Investments in automation, advanced monitoring, and industrial safety measures further enhance market growth. Although growth is slower than in emerging markets, Japan continues to adopt high-quality incremental encoders to meet regulatory requirements and ensure reliable industrial operations.
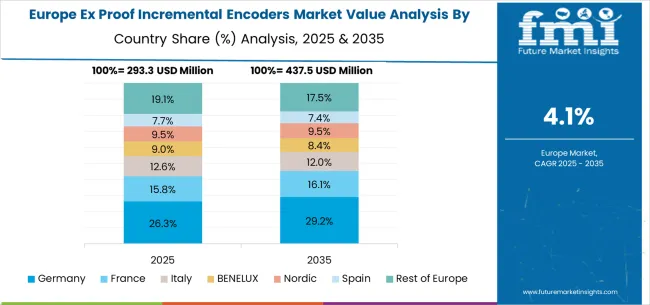
The Ex proof incremental encoders market in Europe is projected to grow from USD 293.3 million in 2025 to USD 437.5 million by 2035, registering a CAGR of 4.1% over the forecast period. Germany is expected to remain the largest national market with 26.3% share in 2025, rising to 29.2% by 2035, supported by its extensive process industry base, automation technology leadership, and strong safety standards. The United Kingdom follows with 15.8% in 2025, easing slightly to 16.1% by 2035 as adoption of automation and monitoring systems drives steady demand. France accounts for 12.0% in 2025, moderating to 11.2% by 2035, reflecting gradual but consistent adoption across hazardous industrial environments.
Italy holds 9.0% in 2025, dipping to 8.4% by 2035, while Spain represents 9.5% in 2025, remaining near 9.5% by 2035, supported by industrial modernization and demand for safety-certified encoders. BENELUX countries contribute 9.5% in 2025, slightly easing to 9.5% by 2035, while the Nordic region accounts for 7.7% in 2025, softening to 7.4% by 2035, reflecting stable adoption across energy and manufacturing sectors. The rest of Europe (Eastern Europe and other emerging markets) collectively accounts for 19.1% in 2025, easing to 17.5% by 2035, reflecting increasing modernization efforts in emerging regional markets compared with maturity in Western Europe.
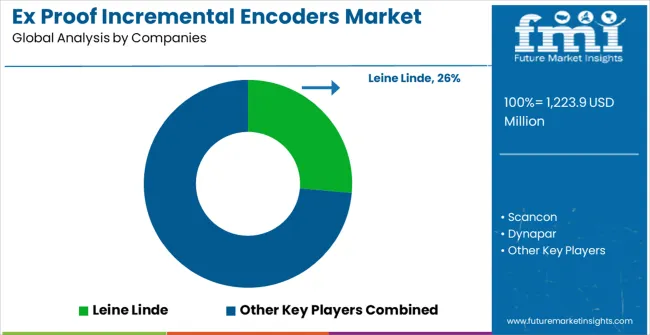
The Ex proof incremental encoders market is defined by competition among specialized automation equipment manufacturers, motion control technology companies, and safety certification suppliers. Companies are investing in advanced explosion-proof technologies, safety certification capabilities, digital communication systems, and technical support services to deliver precise, reliable, and safety-compliant encoder solutions. Strategic partnerships, technological innovation, and geographic expansion are central to strengthening product portfolios and market presence.
Leine Linde, Sweden-based, offers comprehensive explosion-proof encoder systems with focus on harsh environment applications, advanced safety certification, and technical expertise for hazardous location installations. Scancon, operating globally, provides specialized encoder solutions integrated with explosion-proof automation capabilities for diverse industrial requirements. Dynapar, USA, delivers technologically advanced encoder manufacturing with standardized safety procedures and certification integration. Nidec Industrial Solutions, emphasizes custom encoder designs and comprehensive coverage for process industry applications.
Johannes Hübner Giessen, providing European solutions, offers explosion-proof encoder manufacturing integrated with comprehensive automation engineering services. Global Encoder Systems and Sensata Technologies deliver specialized encoder expertise with advanced technical capabilities and safety validation support. Gapp Automation, FLOHR, TR-Electronic, POSITAL, and Hohner Elektrotechnik offer specialized ex proof encoder manufacturing expertise, standardized safety certification procedures, and technical reliability across regional and international industrial networks.
| Items | Values |
|---|---|
| Quantitative Units (2025) | USD 1,223.9 million |
| Shaft Size | Shaft Size Up To 25 mm, Shaft Sizes 25-100 mm, Shaft Sizes Above 100 mm |
| End-Use Industry | Oil and Gas, Chemicals, Food and Beverages, Steel, Machinery, Others |
| Regions Covered | North America, Europe, East Asia, South Asia & Pacific, Latin America, Middle East & Africa |
| Countries Covered | United States, Canada, United Kingdom, Germany, France, China, Japan, South Korea, India, Brazil, Australia and 40+ countries |
| Key Companies Profiled | Leine Linde, Scancon, Dynapar, Nidec Industrial Solutions, Johannes Hübner Giessen, Global Encoder Systems, Sensata Technologies, Gapp Automation, FLOHR, TR-Electronic, POSITAL, Hohner Elektrotechnik |
| Additional Attributes | Dollar sales by shaft size and end-use industry segments, regional demand trends across Asia-Pacific, North America, and Europe, competitive landscape with established manufacturers and emerging safety technology providers, customer preferences for compact versus heavy-duty encoder configurations, integration with explosion-proof automation systems and digital communication platforms, innovations in wireless and IoT-enabled explosion-proof technologies and predictive maintenance systems, and adoption of Industry 4.0 solutions with enhanced safety certification, advanced diagnostic capabilities, and standardized hazardous area compliance specifications for improved industrial automation outcomes. |
The global Ex proof incremental encoders market is estimated to be valued at USD 1,223.9 million in 2025.
The market size for the Ex proof incremental encoders market is projected to reach USD 1,900.7 million by 2035.
The Ex proof incremental encoders market is expected to grow at a 4.5% CAGR between 2025 and 2035.
The key product types in Ex proof incremental encoders market are shaft size up to 25 mm, shaft sizes 25-100 mm and shaft sizes above 100 mm.
In terms of application, oil and gas segment to command 38.0% share in the Ex proof incremental encoders market in 2025.


Our Research Products

The "Full Research Suite" delivers actionable market intel, deep dives on markets or technologies, so clients act faster, cut risk, and unlock growth.

The Leaderboard benchmarks and ranks top vendors, classifying them as Established Leaders, Leading Challengers, or Disruptors & Challengers.

Locates where complements amplify value and substitutes erode it, forecasting net impact by horizon

We deliver granular, decision-grade intel: market sizing, 5-year forecasts, pricing, adoption, usage, revenue, and operational KPIs—plus competitor tracking, regulation, and value chains—across 60 countries broadly.

Spot the shifts before they hit your P&L. We track inflection points, adoption curves, pricing moves, and ecosystem plays to show where demand is heading, why it is changing, and what to do next across high-growth markets and disruptive tech

Real-time reads of user behavior. We track shifting priorities, perceptions of today’s and next-gen services, and provider experience, then pace how fast tech moves from trial to adoption, blending buyer, consumer, and channel inputs with social signals (#WhySwitch, #UX).

Partner with our analyst team to build a custom report designed around your business priorities. From analysing market trends to assessing competitors or crafting bespoke datasets, we tailor insights to your needs.
Supplier Intelligence
Discovery & Profiling
Capacity & Footprint
Performance & Risk
Compliance & Governance
Commercial Readiness
Who Supplies Whom
Scorecards & Shortlists
Playbooks & Docs
Category Intelligence
Definition & Scope
Demand & Use Cases
Cost Drivers
Market Structure
Supply Chain Map
Trade & Policy
Operating Norms
Deliverables
Buyer Intelligence
Account Basics
Spend & Scope
Procurement Model
Vendor Requirements
Terms & Policies
Entry Strategy
Pain Points & Triggers
Outputs
Pricing Analysis
Benchmarks
Trends
Should-Cost
Indexation
Landed Cost
Commercial Terms
Deliverables
Brand Analysis
Positioning & Value Prop
Share & Presence
Customer Evidence
Go-to-Market
Digital & Reputation
Compliance & Trust
KPIs & Gaps
Outputs
Full Research Suite comprises of:
Market outlook & trends analysis
Interviews & case studies
Strategic recommendations
Vendor profiles & capabilities analysis
5-year forecasts
8 regions and 60+ country-level data splits
Market segment data splits
12 months of continuous data updates
DELIVERED AS:
PDF EXCEL ONLINE
Extracorporeal Membrane Oxygenation Machine Market Size and Share Forecast Outlook 2025 to 2035
External Anthelmintic for Dogs Market Size and Share Forecast Outlook 2025 to 2035
Extra Low Interstitial Titanium Market Size and Share Forecast Outlook 2025 to 2035
Exterior Polyurethane Varnish Market Size and Share Forecast Outlook 2025 to 2035
Exosomes Diagnostic and Therapeutic Market Size and Share Forecast Outlook 2025 to 2035
Extreme Ultraviolet Light Source Market Size and Share Forecast Outlook 2025 to 2035
Executive Coaching Certification Market Size and Share Forecast Outlook 2025 to 2035
Excavator Chassis Market Forecast and Outlook 2025 to 2035
Ex-Employee Verification Market Size and Share Forecast Outlook 2025 to 2035
Exfoliating Scrubs and Peels Market Analysis - Size and Share Forecast Outlook 2025 to 2035
Extrusion Press Market Size and Share Forecast Outlook 2025 to 2035
Expansion Valve Market Size and Share Forecast Outlook 2025 to 2035
Extrusion Coatings Market Size and Share Forecast Outlook 2025 to 2035
External Storage Market Size and Share Forecast Outlook 2025 to 2035
Extruder and Compounding Machines Market Size and Share Forecast Outlook 2025 to 2035
Explosive Detectors Market Size and Share Forecast Outlook 2025 to 2035
External Fixator Market Size and Share Forecast Outlook 2025 to 2035
Extruder Conditioner Market Size and Share Forecast Outlook 2025 to 2035
Explosive Vapour Detector Market Size and Share Forecast Outlook 2025 to 2035
External Anti-infective Preparations Market Size and Share Forecast Outlook 2025 to 2035

Thank you!
You will receive an email from our Business Development Manager. Please be sure to check your SPAM/JUNK folder too.
Chat With
MaRIA