Fastener Insertion Machine Market Size, Share, and Forecast Outlook 2025 to 2035

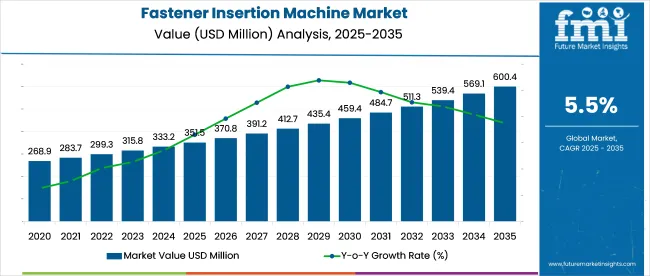
The fastener insertion machine market is expected to grow from USD 351.5 million in 2025 to approximately USD 600.4 million by 2035, registering a CAGR of 5.5%. Demand is rising as manufacturing sectors prioritize automation and precision assembly, particularly in electronics, automotive, and aerospace industries.
Quick Stats in Fastener Insertion Machine Market

  • Market Size (2025): USD 351.5 million
  • Market Forecast (2035): USD 600.4 million
  • CAGR (2025 to 2035): 5.5%
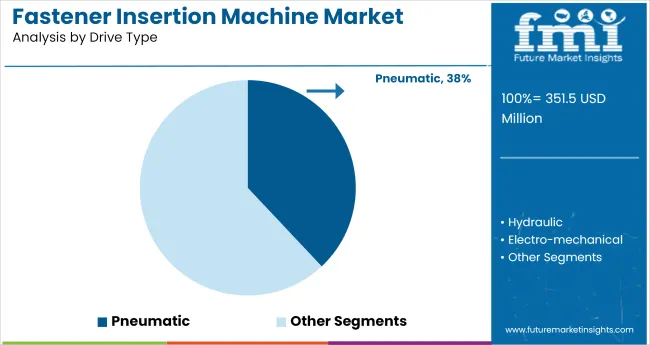
  • Top Drive Type: Pneumatic (38% share in 2025)
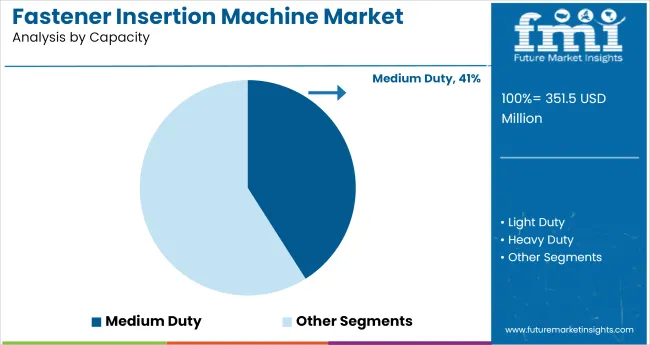
  • Leading Capacity Segment: Medium Duty (41% share in 2025)
  • Top Growing Country: India (6.0% CAGR)

Fastener Insertion Machine Market

Component manufacturers are supplying high-tolerance feed systems and servo-driven insertion heads designed to handle specialty fasteners like clinch nuts and standoffs at cycle rates above 1,200 cycles per minute. Assemblers in automotive and electronics sectors are integrating these machines into inline modular cells, enabling real-time torque and depth monitoring to eliminate joint failures.

Subcontractors are offering turnkey solutions with pick-and-place robotics and vision inspection, reducing programming time by up to 50%. On-site aftermarket support is being structured around predictive maintenance contracts that use vibration and acoustic sensors to forecast tool wear.

Demand is strong in EV battery pack assembly and precision medical device manufacturing, where cleanroom-compatible insertion systems are accelerating adoption. Overall the shift is toward high-throughput, traceable, and compliance-ready insertion platforms that enhance assembly integrity and reduce rework.

As of 2025, the fastener insertion machine market is estimated to account for around 3-4% of the broader industrial automation equipment segment. Within the global fastener machinery space, it holds approximately 6-7%, driven by increasing automation in assembly lines. The market contributes close to 2-3% of the total automotive manufacturing equipment segment, as OEMs seek precision fastening solutions to improve throughput.

In electronics manufacturing equipment, the share stands at about 1-2%, with demand supported by circuit board and device assembly lines. Within the global assembly line equipment market, fastener insertion machines maintain a 4-5% share, reflecting their role in efficient component integration across consumer goods, aerospace, and heavy machinery production. The growth outlook remains supported by rising industrial automation globally.

Analyzing Fastener Insertion Machine Market by Top Investment Segments

The market is gaining strong momentum across key segments such as pneumatic drive systems, medium duty capacity, semi-automatic configurations, and manufacturing end use. Growth is propelled by the demand for efficient fastening solutions, production automation, and consistent quality across global industrial sectors.
Pneumatic Drive Leads Adoption in Fastener Insertion Technology

Fastener Insertion Machine Market Analysis By Drive Type

Pneumatic fastener insertion machines are forecasted to hold 38% of the market share by 2025. Their superior energy efficiency, compact design, and lower maintenance costs are driving wide-scale adoption in high-throughput industrial settings. Pneumatic systems offer consistent force application, making them suitable for repetitive fastening operations in sheet metal fabrication and automotive assembly.
  • High reliability in multi-shift operations makes pneumatic machines a top choice for OEMs.
  • Air-powered systems are compatible with lean manufacturing setups, enhancing operational efficiency.
  • Major investments are seen in APAC regions where low-cost automation is on the rise.

Medium Duty Machines Strike the Balance Between Cost and Capacity

Fastener Insertion Machine Market Analysis By Capacity

Medium duty fastener insertion machines are expected to account for 41% of the global market share. These machines offer optimal performance for mid-volume production lines, balancing output capabilities with cost-effectiveness. Manufacturers in electronics, appliances, and furniture industries rely on medium-duty variants for standardized assembly.
  • Best suited for applications requiring moderate force and precision across varied materials.
  • Suppliers are offering flexible platforms that allow tool changeovers, increasing machine utility.
  • Mid-sized companies prefer these machines due to their favorable cost-performance ratio.

Semi-Automatic Systems Gain Popularity for Streamlined Operations

Fastener Insertion Machine Market Analysis By Category

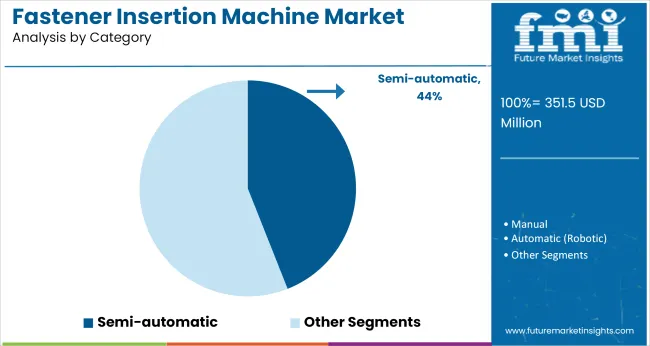
Semi-automatic fastener insertion machines are set to capture 44% of the total market by 2025. They combine manual feeding with automated pressing, offering flexibility for mixed-batch production. Businesses with small-scale to mid-scale manufacturing operations favor semi-automatic systems for their control, affordability, and ease of operation.
  • Minimal training requirements reduce labor costs and enhance production uptime.
  • Operators can handle various fastener sizes and materials with modular configurations.
  • High demand from automotive and general fabrication sectors is fueling segment growth.

Manufacturing Sector Emerges as Prime Consumer of Insertion Machines

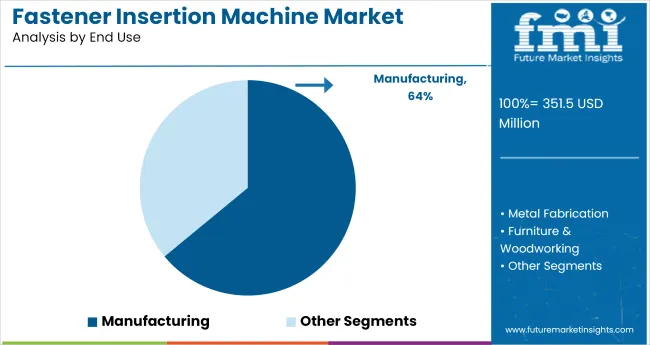
Fastener Insertion Machine Market Analysis By End Use

Manufacturing is poised to dominate the end use segment with a 64% market share by 2025. Fastener insertion machines are integral to modern assembly lines in industries such as electronics, aerospace, metalworking, and automotive. The rise in global industrial production and demand for consistent fastening solutions support this trend.

  • Assembly-intensive manufacturing processes benefit from reliable insertion technology.
  • Growing emphasis on quality and throughput is accelerating equipment upgrades.
  • North America and Asia Pacific remain major revenue centers due to strong industrial activity.

Top Fastener Insertion Machine Market Dynamics

The market is expanding as precision assembly gains traction in automotive, aerospace, and electronics manufacturing. In 2024, global unit sales rose by 7.4%, supported by automation mandates and high-throughput requirements.

Automation and Servo-Control Upgrades Boosting Efficiency

In 2024, over 51% of new machines were servo-driven, offering programmable force and depth control. Systems now feature HMI interfaces, error detection, and barcode-based part recognition. Production lines are retrofitted with robotic arms for continuous multi-fastener insertions.

  • Servo-electric models adopted for adjustable insertion force precision.
  • Vision systems added to detect misalignment and ensure first-pass yield.
  • Remote monitoring integrated for predictive maintenance and uptime tracking.

Growth in Aerospace and Sheet Metal Fabrication Applications

Aircraft interiors, avionics housings, and structural panels require precise fastening. In 2024, aerospace-grade fastener inserters made up 22% of market share. Sheet metal fabricators are investing in equipment that supports both thick and thin gauge materials with interchangeable tooling heads.
  • Used in seating frames, cockpit panels, and fuselage brackets.
  • Quick-change tooling adopted for mixed-material batch processing.
  • Aluminum and titanium part compatibility improving adoption in aerospace MROs.

Top Countries Producing, Integrating, Distributing, and Advancing Fastener Insertion Machines

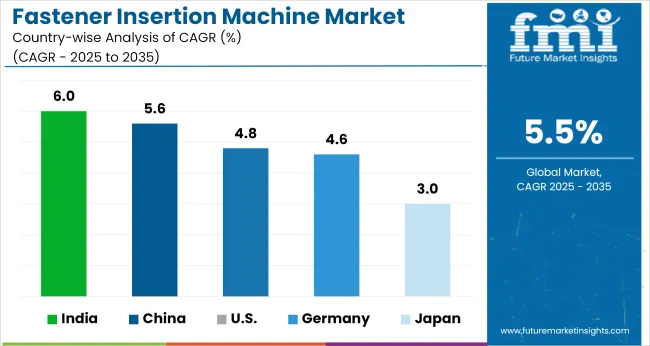
Fastener Insertion Machine Market Cagr Analysis By Country

Countries CAGR (2025 to 2035)
India 6.0%
China 5.6%
United States 4.8%
Germany 4.6%
Japan 3.0%

The global market is projected to expand at a CAGR of 5.5% from 2025 to 2035. Among BRICS nations, India leads with 6.0%, outpacing the global average by nearly 9%, supported by expanding automotive and appliance sectors. China follows at 5.6%, slightly above the global benchmark, reflecting steady demand from high-volume electronics and industrial manufacturing. In contrast, OECD economies are progressing at a slower pace.

The United States posts a CAGR of 4.8%, while Germany stands at 4.6%, both trailing the global average by 13% and 16%, respectively. Japan reports the weakest growth at 3.0%, reflecting production saturation and automation transition delays.

This performance contrast reflects the stronger industrial capital investments in BRICS regions and the need for modernization in OECD countries. Several ASEAN economies, although not listed here, are anticipated to bridge the gap through low-cost manufacturing expansions and equipment imports.

The report provides insights across 40+ countries. The five below are highlighted for their strategic influence and growth trajectory.

Rising Automation in India Fastener Insertion Machine Market

Posting a CAGR of 6.0% through 2035, Indian market is gaining traction on the back of manufacturing localization, capacity expansion, and rising automation across MSMEs. Demand is concentrated in automotive components, white goods, and electrical panels, particularly in industrial zones across Gujarat, Maharashtra, and Tamil Nadu. Competitive pricing, ease of integration, and energy-efficient models are prompting wider adoption, even among first-time automation users.

  • PLI-driven capital expenditure supporting uptake of automated fastening lines
  • Increasing demand from control panel and switchgear manufacturers
  • Mid-sized OEMs replacing manual fastening with semi-automated systems

Growth of High-Speed Fastener Insertion Machines in China

The market in China is forecast to grow at a CAGR of 5.6% from 2025 to 2035, supported by expanding use in electric vehicles, electronics, and infrastructure components. Domestic OEMs are investing in high-speed insertion solutions to meet rising production targets, with growing preference for machines offering precision control, multi-head configuration, and compatibility with MES platforms. Export-focused SMEs in Guangdong and Jiangsu are also upgrading legacy systems to improve competitiveness.

  • EV battery pack and chassis manufacturers boosting capital investment
  • MES-ready systems gaining traction in high-throughput facilities
  • Surge in demand from server rack and air-conditioning unit assembly lines

Demand for Advanced Insertion Systems in the United States

Expected to grow at a CAGR of 4.8% during the forecast period, the USA market is shaped by lifecycle equipment replacement and integration of advanced automation. Demand is pronounced in aerospace, HVAC, and electrical enclosures, where precision and repeatability are key. Vendors offering force-control features, intelligent diagnostics, and multi-size fastener compatibility are well positioned to gain share among Tier 1 suppliers and contract manufacturers.

  • Retooling of production lines in aerospace and defense sectors
  • Retrofit projects driving adoption of programmable servo-driven units
  • Demand for compact platforms with real-time quality monitoring

Germany Fastener Insertion Equipment Market Shows Steady Expansion

Registering a CAGR of 4.6% through 2035, Germany’s market benefits from consistent demand across automotive, electronics, and industrial control segments. Emphasis is placed on reliability, noise reduction, and interoperability with Industry 4.0 systems. Market participants are prioritizing long-term lifecycle cost savings, fueling interest in energy-efficient, digitally monitored systems. System integrators are increasingly sourcing modular machines for seamless factory floor integration.

  • Focus on precision assembly driving need for low-vibration equipment
  • Demand from switchgear and energy storage system OEMs expanding
  • High preference for systems compatible with EU automation standards

Japan’s Precision Fastener Insertion Machines Gain Industrial Demand

Expanding at a CAGR of 3.0% between 2025 and 2035, the Japanese market is driven by niche industrial needs, especially in electronics, robotics, and optics assembly. Buyers prioritize compact, high-precision insertion systems capable of operating in space-constrained, clean environments. While overall growth is moderate, quality benchmarks remain elevated. Vendors offering ultra-low noise, low-maintenance platforms with integrated error detection are poised for growth.
  • Use cases centered on PCB, camera module, and actuator assembly
  • Rising demand for compact solutions in vertically integrated production setups
  • Preference for machines with built-in inspection and fail-safe protocols

Leading Fastener Insertion Machine Manufacturers

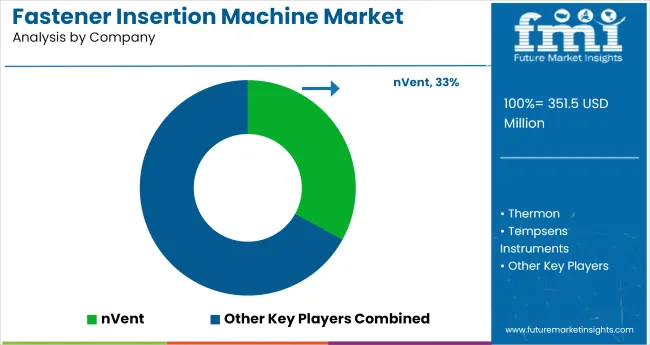
Fastener Insertion Machine Market Analysis By Company

Penn Engineering, through its Haeger division, dominates the global fastener insertion machine market with an estimated 33% market share, particularly in North America and Europe, driven by its servo-driven presses and automation-ready solutions. AMADA Co., Ltd. is a strong competitor in Asia-Pacific, integrating insertion technologies within its sheet metal fabrication ecosystems, securing contracts with leading electronics and appliance OEMs.

Dongguan Insertion Machinery Co., Ltd. and ERSM Machinery have captured a combined 20-25% of the Chinese market by offering cost-efficient, semi-automated machines suited for mid-volume manufacturing. Neumatica Technologies Pvt. Ltd. is rapidly gaining traction in India’s automotive and white goods sector, driven by its pneumatic insertion systems and expanding service network across key industrial hubs.

Recent Fastener Insertion Machine Industry News

In January 2024, PennEngineering completed the acquisition of Sherex Fastening Solutions, significantly enhancing its capabilities in fastener insertion systems. This strategic move broadens its product lineup and strengthens its position in precision fastening technology, enabling deeper integration across automotive, aerospace, and industrial equipment manufacturing sectors.

Report Coverage and Scope Summary

Report Attributes Details
Market Size (2025) USD 351.5 million
Projected Market Size (2035) USD 600.4 million
CAGR (2025 to 2035) 5.5%
Base Year for Estimation 2024
Historical Period 2020 to 2024
Projections Period 2025 to 2035
Quantitative Units USD million for market value
Drive Types Analyzed (Segment 1) Pneumatic, Hydraulic, Electro-mechanical, Hybrid
Capacities Analyzed (Segment 2) Light Duty, Medium Duty, Heavy Duty
Categories Analyzed (Segment 3) Manual, Semi-automatic, Automatic (Robotic)
End Uses Analyzed (Segment 4) Manufacturing (Automotive, Aviation, Consumer Goods & Appliances, Electronics, HVAC, Others), Metal Fabrication, Furniture & Woodworking, Others
Regions Covered North America, Latin America, Eastern Europe, Western Europe, South Asia & Pacific, East Asia, Middle East & Africa
Countries Covered United States, Canada, Germany, United Kingdom, France, Italy, Spain, China, India, Japan, South Korea, Australia, Brazil, Mexico, Argentina, Saudi Arabia, UAE, South Africa
Key Players Penn Engineering ( Haeger ), Neumatica Technologies Pvt. Ltd., ERSM Machinery, Dongguan Insertion Machinery Co., Ltd., AMADA CO., LTD.
Additional Attributes Dollar sales by drive and automation type, growing integration of robotic insertion systems, demand for precision fastening in electronics and automotive, and wider adoption across small to large-scale metal fabrication units.

Leading Players in Fastener Insertion Machine Market

  • Penn Engineering (Haeger)
  • Neumatica Technologies Pvt. Ltd.
  • ERSM Machinery
  • Dongguan Insertion Machinery Co., Ltd.
  • AMADA CO., LTD.

Fastener Insertion Machine Market Analyzed by Key Investment Segments

By Drive Type:

The market is segmented into pneumatic, hydraulic, electro-mechanical, and hybrid drive types. Each type offers varying advantages in terms of force delivery, speed, and control across industrial applications.

By Capacity:

Based on load capacity, the market includes light-duty, medium-duty, and heavy-duty press systems, catering to diverse operational scales from precision assembly to heavy metal forming.

By Category:

Pressing systems are classified as manual, semi-automatic, and automatic (robotic), offering users flexibility based on production volume, labor efficiency, and automation needs.

By End Use:

End-use segmentation includes manufacturing (automotive, aviation, consumer goods & appliances, electronics, HVAC, and others), along with metal fabrication, furniture & woodworking, and various other industrial applications.

By Region:

Regional analysis spans North America, Latin America, Eastern Europe, Western Europe, South Asia & Pacific, East Asia, and the Middle East & Africa, reflecting differences in industrial automation maturity and investment trends.

Table of Content

  1. Executive Summary
    • Global Market Outlook
    • Demand-side Trends
    • Supply-side Trends
    • Technology Roadmap Analysis
    • Analysis and Recommendations
  2. Market Overview
    • Market Coverage / Taxonomy
    • Market Definition / Scope / Limitations
  3. Market Background
    • Market Dynamics
      • Drivers
      • Restraints
      • Opportunity
      • Trends
    • Scenario Forecast
      • Demand in Optimistic Scenario
      • Demand in Likely Scenario
      • Demand in Conservative Scenario
    • Opportunity Map Analysis
    • Product Life Cycle Analysis
    • Supply Chain Analysis
      • Supply Side Participants and their Roles
        • Producers
        • Mid-Level Participants (Traders/ Agents/ Brokers)
        • Wholesalers and Distributors
      • Value Added and Value Created at Node in the Supply Chain
      • List of Raw Material Suppliers
      • List of Existing and Potential Buyer’s
    • Investment Feasibility Matrix
    • Value Chain Analysis
      • Profit Margin Analysis
      • Wholesalers and Distributors
      • Retailers
    • PESTLE and Porter’s Analysis
    • Regulatory Landscape
      • By Key Regions
      • By Key Countries
    • Regional Parent Market Outlook
    • Production and Consumption Statistics
    • Import and Export Statistics
  4. Global Market Analysis 2020 to 2024 and Forecast, 2025 to 2035
    • Historical Market Size Value (USD Million) & Volume (Units) Analysis, 2020 to 2024
    • Current and Future Market Size Value (USD Million) & Volume (Units) Projections, 2025 to 2035
      • Y-o-Y Growth Trend Analysis
      • Absolute $ Opportunity Analysis
  5. Global Market Pricing Analysis 2020 to 2024 and Forecast 2025 to 2035
  6. Global Market Analysis 2020 to 2024 and Forecast 2025 to 2035, By Drive Type
    • Introduction / Key Findings
    • Historical Market Size Value (USD Million) & Volume (Units) Analysis By Drive Type, 2020 to 2024
    • Current and Future Market Size Value (USD Million) & Volume (Units) Analysis and Forecast By Drive Type, 2025 to 2035
      • Pneumatic
      • Hydraulic
      • Electro-mechanical
      • Hybrid
    • Y-o-Y Growth Trend Analysis By Drive Type, 2020 to 2024
    • Absolute $ Opportunity Analysis By Drive Type, 2025 to 2035
  7. Global Market Analysis 2020 to 2024 and Forecast 2025 to 2035, By Capacity
    • Introduction / Key Findings
    • Historical Market Size Value (USD Million) & Volume (Units) Analysis By Capacity, 2020 to 2024
    • Current and Future Market Size Value (USD Million) & Volume (Units) Analysis and Forecast By Capacity, 2025 to 2035
      • Light Duty
      • Medium Duty
      • Heavy Duty
    • Y-o-Y Growth Trend Analysis By Capacity, 2020 to 2024
    • Absolute $ Opportunity Analysis By Capacity, 2025 to 2035
  8. Global Market Analysis 2020 to 2024 and Forecast 2025 to 2035, By Category
    • Introduction / Key Findings
    • Historical Market Size Value (USD Million) & Volume (Units) Analysis By Category, 2020 to 2024
    • Current and Future Market Size Value (USD Million) & Volume (Units) Analysis and Forecast By Category, 2025 to 2035
      • Manual
      • Semi-automatic
      • Automatic (Robotic)
    • Y-o-Y Growth Trend Analysis By Category, 2020 to 2024
    • Absolute $ Opportunity Analysis By Category, 2025 to 2035
  9. Global Market Analysis 2020 to 2024 and Forecast 2025 to 2035, By End Use
    • Introduction / Key Findings
    • Historical Market Size Value (USD Million) & Volume (Units) Analysis By End Use, 2020 to 2024
    • Current and Future Market Size Value (USD Million) & Volume (Units) Analysis and Forecast By End Use, 2025 to 2035
      • Manufacturing
        • Automotive
        • Aviation
        • Consumer Goods & Appliances
        • Electronics
        • HVAC
        • Others
      • Metal Fabrication
      • Furniture & Woodworking
      • Others
    • Y-o-Y Growth Trend Analysis By End Use, 2020 to 2024
    • Absolute $ Opportunity Analysis By End Use, 2025 to 2035
  10. Global Market Analysis 2020 to 2024 and Forecast 2025 to 2035, By Region
    • Introduction
    • Historical Market Size Value (USD Million) & Volume (Units) Analysis By Region, 2020 to 2024
    • Current Market Size Value (USD Million) & Volume (Units) Analysis and Forecast By Region, 2025 to 2035
      • North America
      • Latin America
      • Western Europe
      • Eastern Europe
      • East Asia
      • South Asia & Pacific
      • Middle East and Africa
    • Market Attractiveness Analysis By Region
  11. North America Market Analysis 2020 to 2024 and Forecast 2025 to 2035, By Country
    • Historical Market Size Value (USD Million) & Volume (Units) Trend Analysis By Market Taxonomy, 2020 to 2024
    • Market Size Value (USD Million) & Volume (Units) Forecast By Market Taxonomy, 2025 to 2035
      • By Country
        • USA
        • Canada
        • Mexico
      • By Drive Type
      • By Capacity
      • By Category
      • By End Use
    • Market Attractiveness Analysis
      • By Country
      • By Drive Type
      • By Capacity
      • By Category
      • By End Use
    • Key Takeaways
  12. Latin America Market Analysis 2020 to 2024 and Forecast 2025 to 2035, By Country
    • Historical Market Size Value (USD Million) & Volume (Units) Trend Analysis By Market Taxonomy, 2020 to 2024
    • Market Size Value (USD Million) & Volume (Units) Forecast By Market Taxonomy, 2025 to 2035
      • By Country
        • Brazil
        • Argentina
        • Rest of LATAM
      • By Drive Type
      • By Capacity
      • By Category
      • By End Use
    • Market Attractiveness Analysis
      • By Country
      • By Drive Type
      • By Capacity
      • By Category
      • By End Use
    • Key Takeaways
  13. Western Europe Market Analysis 2020 to 2024 and Forecast 2025 to 2035, By Country
    • Historical Market Size Value (USD Million) & Volume (Units) Trend Analysis By Market Taxonomy, 2020 to 2024
    • Market Size Value (USD Million) & Volume (Units) Forecast By Market Taxonomy, 2025 to 2035
      • By Country
        • Germany
        • Italy
        • France
        • UK
        • Spain
        • BENELUX
        • Nordic
        • Rest of W.Europe
      • By Drive Type
      • By Capacity
      • By Category
      • By End Use
    • Market Attractiveness Analysis
      • By Country
      • By Drive Type
      • By Capacity
      • By Category
      • By End Use
    • Key Takeaways
  14. Eastern Europe Market Analysis 2020 to 2024 and Forecast 2025 to 2035, By Country
    • Historical Market Size Value (USD Million) & Volume (Units) Trend Analysis By Market Taxonomy, 2020 to 2024
    • Market Size Value (USD Million) & Volume (Units) Forecast By Market Taxonomy, 2025 to 2035
      • By Country
        • Russia
        • Hungary
        • Poland
        • Balkan & Baltics
        • Rest of E. Europe
      • By Drive Type
      • By Capacity
      • By Category
      • By End Use
    • Market Attractiveness Analysis
      • By Country
      • By Drive Type
      • By Capacity
      • By Category
      • By End Use
    • Key Takeaways
  15. East Asia Market Analysis 2020 to 2024 and Forecast 2025 to 2035, By Country
    • Historical Market Size Value (USD Million) & Volume (Units) Trend Analysis By Market Taxonomy, 2020 to 2024
    • Market Size Value (USD Million) & Volume (Units) Forecast By Market Taxonomy, 2025 to 2035
      • By Country
        • China
        • Japan
        • South Korea
      • By Drive Type
      • By Capacity
      • By Category
      • By End Use
    • Market Attractiveness Analysis
      • By Country
      • By Drive Type
      • By Capacity
      • By Category
      • By End Use
    • Key Takeaways
  16. South Asia & Pacific Market Analysis 2020 to 2024 and Forecast 2025 to 2035, By Country
    • Historical Market Size Value (USD Million) & Volume (Units) Trend Analysis By Market Taxonomy, 2020 to 2024
    • Market Size Value (USD Million) & Volume (Units) Forecast By Market Taxonomy, 2025 to 2035
      • By Country
        • India
        • Australia & New Zealand
        • ASEAN
        • Rest of SAP
      • By Drive Type
      • By Capacity
      • By Category
      • By End Use
    • Market Attractiveness Analysis
      • By Country
      • By Drive Type
      • By Capacity
      • By Category
      • By End Use
    • Key Takeaways
  17. Middle East and Africa Market Analysis 2020 to 2024 and Forecast 2025 to 2035, By Country
    • Historical Market Size Value (USD Million) & Volume (Units) Trend Analysis By Market Taxonomy, 2020 to 2024
    • Market Size Value (USD Million) & Volume (Units) Forecast By Market Taxonomy, 2025 to 2035
      • By Country
        • GCC Countries
        • Northern Africa
        • South Africa
        • Turkiye
        • Rest of MEA
      • By Drive Type
      • By Capacity
      • By Category
      • By End Use
    • Market Attractiveness Analysis
      • By Country
      • By Drive Type
      • By Capacity
      • By Category
      • By End Use
    • Key Takeaways
  18. Key Countries Market Analysis
    • USA
      • Pricing Analysis
      • Market Share Analysis, 2024
        • By Drive Type
        • By Capacity
        • By Category
        • By End Use
    • Canada
      • Pricing Analysis
      • Market Share Analysis, 2024
        • By Drive Type
        • By Capacity
        • By Category
        • By End Use
    • Brazil
      • Pricing Analysis
      • Market Share Analysis, 2024
        • By Drive Type
        • By Capacity
        • By Category
        • By End Use
    • Mexico
      • Pricing Analysis
      • Market Share Analysis, 2024
        • By Drive Type
        • By Capacity
        • By Category
        • By End Use
    • Argentina
      • Pricing Analysis
      • Market Share Analysis, 2024
        • By Drive Type
        • By Capacity
        • By Category
        • By End Use
  19. Market Structure Analysis
    • Competition Dashboard
    • Competition Benchmarking
    • Market Share Analysis of Top Players
      • By Regional
      • By Drive Type
      • By Capacity
      • By Category
      • By End Use
  20. Competition Analysis
    • Competition Deep Dive
      • Penn Engineering (Haeger)
        • Overview
        • Product Portfolio
        • Profitability by Market Segments (Product/Age /Sales Channel/Region)
        • Sales Footprint
        • Strategy Overview
          • Marketing Strategy
          • Product Strategy
          • Channel Strategy
      • Neumatica Technologies Pvt. Ltd.
        • Overview
        • Product Portfolio
        • Profitability by Market Segments (Product/Age /Sales Channel/Region)
        • Sales Footprint
        • Strategy Overview
          • Marketing Strategy
          • Product Strategy
          • Channel Strategy
      • ERSM Machinery
        • Overview
        • Product Portfolio
        • Profitability by Market Segments (Product/Age /Sales Channel/Region)
        • Sales Footprint
        • Strategy Overview
          • Marketing Strategy
          • Product Strategy
          • Channel Strategy
      • Dongguan Insertion Machinery Co., Ltd.
        • Overview
        • Product Portfolio
        • Profitability by Market Segments (Product/Age /Sales Channel/Region)
        • Sales Footprint
        • Strategy Overview
          • Marketing Strategy
          • Product Strategy
          • Channel Strategy
      • AMADA CO., LTD.
        • Overview
        • Product Portfolio
        • Profitability by Market Segments (Product/Age /Sales Channel/Region)
        • Sales Footprint
        • Strategy Overview
          • Marketing Strategy
          • Product Strategy
          • Channel Strategy
  21. Assumptions & Acronyms Used
  22. Research Methodology

List of Tables

  • Table 1: Global Market Value (USD Million) Forecast by Region, 2020 to 2035
  • Table 2: Global Market Volume (Units) Forecast by Region, 2020 to 2035
  • Table 3: Global Market Value (USD Million) Forecast by Drive Type, 2020 to 2035
  • Table 4: Global Market Volume (Units) Forecast by Drive Type, 2020 to 2035
  • Table 5: Global Market Value (USD Million) Forecast by Capacity, 2020 to 2035
  • Table 6: Global Market Volume (Units) Forecast by Capacity, 2020 to 2035
  • Table 7: Global Market Value (USD Million) Forecast by Category, 2020 to 2035
  • Table 8: Global Market Volume (Units) Forecast by Category, 2020 to 2035
  • Table 9: Global Market Value (USD Million) Forecast by End Use, 2020 to 2035
  • Table 10: Global Market Volume (Units) Forecast by End Use, 2020 to 2035
  • Table 11: North America Market Value (USD Million) Forecast by Country, 2020 to 2035
  • Table 12: North America Market Volume (Units) Forecast by Country, 2020 to 2035
  • Table 13: North America Market Value (USD Million) Forecast by Drive Type, 2020 to 2035
  • Table 14: North America Market Volume (Units) Forecast by Drive Type, 2020 to 2035
  • Table 15: North America Market Value (USD Million) Forecast by Capacity, 2020 to 2035
  • Table 16: North America Market Volume (Units) Forecast by Capacity, 2020 to 2035
  • Table 17: North America Market Value (USD Million) Forecast by Category, 2020 to 2035
  • Table 18: North America Market Volume (Units) Forecast by Category, 2020 to 2035
  • Table 19: North America Market Value (USD Million) Forecast by End Use, 2020 to 2035
  • Table 20: North America Market Volume (Units) Forecast by End Use, 2020 to 2035
  • Table 21: Latin America Market Value (USD Million) Forecast by Country, 2020 to 2035
  • Table 22: Latin America Market Volume (Units) Forecast by Country, 2020 to 2035
  • Table 23: Latin America Market Value (USD Million) Forecast by Drive Type, 2020 to 2035
  • Table 24: Latin America Market Volume (Units) Forecast by Drive Type, 2020 to 2035
  • Table 25: Latin America Market Value (USD Million) Forecast by Capacity, 2020 to 2035
  • Table 26: Latin America Market Volume (Units) Forecast by Capacity, 2020 to 2035
  • Table 27: Latin America Market Value (USD Million) Forecast by Category, 2020 to 2035
  • Table 28: Latin America Market Volume (Units) Forecast by Category, 2020 to 2035
  • Table 29: Latin America Market Value (USD Million) Forecast by End Use, 2020 to 2035
  • Table 30: Latin America Market Volume (Units) Forecast by End Use, 2020 to 2035
  • Table 31: Western Europe Market Value (USD Million) Forecast by Country, 2020 to 2035
  • Table 32: Western Europe Market Volume (Units) Forecast by Country, 2020 to 2035
  • Table 33: Western Europe Market Value (USD Million) Forecast by Drive Type, 2020 to 2035
  • Table 34: Western Europe Market Volume (Units) Forecast by Drive Type, 2020 to 2035
  • Table 35: Western Europe Market Value (USD Million) Forecast by Capacity, 2020 to 2035
  • Table 36: Western Europe Market Volume (Units) Forecast by Capacity, 2020 to 2035
  • Table 37: Western Europe Market Value (USD Million) Forecast by Category, 2020 to 2035
  • Table 38: Western Europe Market Volume (Units) Forecast by Category, 2020 to 2035
  • Table 39: Western Europe Market Value (USD Million) Forecast by End Use, 2020 to 2035
  • Table 40: Western Europe Market Volume (Units) Forecast by End Use, 2020 to 2035
  • Table 41: Eastern Europe Market Value (USD Million) Forecast by Country, 2020 to 2035
  • Table 42: Eastern Europe Market Volume (Units) Forecast by Country, 2020 to 2035
  • Table 43: Eastern Europe Market Value (USD Million) Forecast by Drive Type, 2020 to 2035
  • Table 44: Eastern Europe Market Volume (Units) Forecast by Drive Type, 2020 to 2035
  • Table 45: Eastern Europe Market Value (USD Million) Forecast by Capacity, 2020 to 2035
  • Table 46: Eastern Europe Market Volume (Units) Forecast by Capacity, 2020 to 2035
  • Table 47: Eastern Europe Market Value (USD Million) Forecast by Category, 2020 to 2035
  • Table 48: Eastern Europe Market Volume (Units) Forecast by Category, 2020 to 2035
  • Table 49: Eastern Europe Market Value (USD Million) Forecast by End Use, 2020 to 2035
  • Table 50: Eastern Europe Market Volume (Units) Forecast by End Use, 2020 to 2035
  • Table 51: East Asia Market Value (USD Million) Forecast by Country, 2020 to 2035
  • Table 52: East Asia Market Volume (Units) Forecast by Country, 2020 to 2035
  • Table 53: East Asia Market Value (USD Million) Forecast by Drive Type, 2020 to 2035
  • Table 54: East Asia Market Volume (Units) Forecast by Drive Type, 2020 to 2035
  • Table 55: East Asia Market Value (USD Million) Forecast by Capacity, 2020 to 2035
  • Table 56: East Asia Market Volume (Units) Forecast by Capacity, 2020 to 2035
  • Table 57: East Asia Market Value (USD Million) Forecast by Category, 2020 to 2035
  • Table 58: East Asia Market Volume (Units) Forecast by Category, 2020 to 2035
  • Table 59: East Asia Market Value (USD Million) Forecast by End Use, 2020 to 2035
  • Table 60: East Asia Market Volume (Units) Forecast by End Use, 2020 to 2035
  • Table 61: South Asia & Pacific Market Value (USD Million) Forecast by Country, 2020 to 2035
  • Table 62: South Asia & Pacific Market Volume (Units) Forecast by Country, 2020 to 2035
  • Table 63: South Asia & Pacific Market Value (USD Million) Forecast by Drive Type, 2020 to 2035
  • Table 64: South Asia & Pacific Market Volume (Units) Forecast by Drive Type, 2020 to 2035
  • Table 65: South Asia & Pacific Market Value (USD Million) Forecast by Capacity, 2020 to 2035
  • Table 66: South Asia & Pacific Market Volume (Units) Forecast by Capacity, 2020 to 2035
  • Table 67: South Asia & Pacific Market Value (USD Million) Forecast by Category, 2020 to 2035
  • Table 68: South Asia & Pacific Market Volume (Units) Forecast by Category, 2020 to 2035
  • Table 69: South Asia & Pacific Market Value (USD Million) Forecast by End Use, 2020 to 2035
  • Table 70: South Asia & Pacific Market Volume (Units) Forecast by End Use, 2020 to 2035
  • Table 71: Middle East and Africa Market Value (USD Million) Forecast by Country, 2020 to 2035
  • Table 72: Middle East and Africa Market Volume (Units) Forecast by Country, 2020 to 2035
  • Table 73: Middle East and Africa Market Value (USD Million) Forecast by Drive Type, 2020 to 2035
  • Table 74: Middle East and Africa Market Volume (Units) Forecast by Drive Type, 2020 to 2035
  • Table 75: Middle East and Africa Market Value (USD Million) Forecast by Capacity, 2020 to 2035
  • Table 76: Middle East and Africa Market Volume (Units) Forecast by Capacity, 2020 to 2035
  • Table 77: Middle East and Africa Market Value (USD Million) Forecast by Category, 2020 to 2035
  • Table 78: Middle East and Africa Market Volume (Units) Forecast by Category, 2020 to 2035
  • Table 79: Middle East and Africa Market Value (USD Million) Forecast by End Use, 2020 to 2035
  • Table 80: Middle East and Africa Market Volume (Units) Forecast by End Use, 2020 to 2035

List of Figures

  • Figure 1: Global Market Volume (Units) Forecast 2020 to 2035
  • Figure 2: Global Market Pricing Analysis
  • Figure 3: Global Market Value (USD Million) Forecast 2020 to 2035
  • Figure 4: Global Market Value Share and BPS Analysis by Drive Type, 2025 and 2035
  • Figure 5: Global Market Y-o-Y Growth Comparison by Drive Type, 2025 to 2035
  • Figure 6: Global Market Attractiveness Analysis by Drive Type
  • Figure 7: Global Market Value Share and BPS Analysis by Capacity, 2025 and 2035
  • Figure 8: Global Market Y-o-Y Growth Comparison by Capacity, 2025 to 2035
  • Figure 9: Global Market Attractiveness Analysis by Capacity
  • Figure 10: Global Market Value Share and BPS Analysis by Category, 2025 and 2035
  • Figure 11: Global Market Y-o-Y Growth Comparison by Category, 2025 to 2035
  • Figure 12: Global Market Attractiveness Analysis by Category
  • Figure 13: Global Market Value Share and BPS Analysis by End Use, 2025 and 2035
  • Figure 14: Global Market Y-o-Y Growth Comparison by End Use, 2025 to 2035
  • Figure 15: Global Market Attractiveness Analysis by End Use
  • Figure 16: Global Market Value (USD Million) Share and BPS Analysis by Region, 2025 and 2035
  • Figure 17: Global Market Y-o-Y Growth Comparison by Region, 2025 to 2035
  • Figure 18: Global Market Attractiveness Analysis by Region
  • Figure 19: North America Market Incremental $ Opportunity, 2025 to 2035
  • Figure 20: Latin America Market Incremental $ Opportunity, 2025 to 2035
  • Figure 21: Western Europe Market Incremental $ Opportunity, 2025 to 2035
  • Figure 22: Eastern Europe Market Incremental $ Opportunity, 2025 to 2035
  • Figure 23: East Asia Market Incremental $ Opportunity, 2025 to 2035
  • Figure 24: South Asia & Pacific Market Incremental $ Opportunity, 2025 to 2035
  • Figure 25: Middle East and Africa Market Incremental $ Opportunity, 2025 to 2035
  • Figure 26: North America Market Value Share and BPS Analysis by Country, 2025 and 2035
  • Figure 27: North America Market Value Share and BPS Analysis by Drive Type, 2025 and 2035
  • Figure 28: North America Market Y-o-Y Growth Comparison by Drive Type, 2025 to 2035
  • Figure 29: North America Market Attractiveness Analysis by Drive Type
  • Figure 30: North America Market Value Share and BPS Analysis by Capacity, 2025 and 2035
  • Figure 31: North America Market Y-o-Y Growth Comparison by Capacity, 2025 to 2035
  • Figure 32: North America Market Attractiveness Analysis by Capacity
  • Figure 33: North America Market Value Share and BPS Analysis by Category, 2025 and 2035
  • Figure 34: North America Market Y-o-Y Growth Comparison by Category, 2025 to 2035
  • Figure 35: North America Market Attractiveness Analysis by Category
  • Figure 36: North America Market Value Share and BPS Analysis by End Use, 2025 and 2035
  • Figure 37: North America Market Y-o-Y Growth Comparison by End Use, 2025 to 2035
  • Figure 38: North America Market Attractiveness Analysis by End Use
  • Figure 39: Latin America Market Value Share and BPS Analysis by Country, 2025 and 2035
  • Figure 40: Latin America Market Value Share and BPS Analysis by Drive Type, 2025 and 2035
  • Figure 41: Latin America Market Y-o-Y Growth Comparison by Drive Type, 2025 to 2035
  • Figure 42: Latin America Market Attractiveness Analysis by Drive Type
  • Figure 43: Latin America Market Value Share and BPS Analysis by Capacity, 2025 and 2035
  • Figure 44: Latin America Market Y-o-Y Growth Comparison by Capacity, 2025 to 2035
  • Figure 45: Latin America Market Attractiveness Analysis by Capacity
  • Figure 46: Latin America Market Value Share and BPS Analysis by Category, 2025 and 2035
  • Figure 47: Latin America Market Y-o-Y Growth Comparison by Category, 2025 to 2035
  • Figure 48: Latin America Market Attractiveness Analysis by Category
  • Figure 49: Latin America Market Value Share and BPS Analysis by End Use, 2025 and 2035
  • Figure 50: Latin America Market Y-o-Y Growth Comparison by End Use, 2025 to 2035
  • Figure 51: Latin America Market Attractiveness Analysis by End Use
  • Figure 52: Western Europe Market Value Share and BPS Analysis by Country, 2025 and 2035
  • Figure 53: Western Europe Market Value Share and BPS Analysis by Drive Type, 2025 and 2035
  • Figure 54: Western Europe Market Y-o-Y Growth Comparison by Drive Type, 2025 to 2035
  • Figure 55: Western Europe Market Attractiveness Analysis by Drive Type
  • Figure 56: Western Europe Market Value Share and BPS Analysis by Capacity, 2025 and 2035
  • Figure 57: Western Europe Market Y-o-Y Growth Comparison by Capacity, 2025 to 2035
  • Figure 58: Western Europe Market Attractiveness Analysis by Capacity
  • Figure 59: Western Europe Market Value Share and BPS Analysis by Category, 2025 and 2035
  • Figure 60: Western Europe Market Y-o-Y Growth Comparison by Category, 2025 to 2035
  • Figure 61: Western Europe Market Attractiveness Analysis by Category
  • Figure 62: Western Europe Market Value Share and BPS Analysis by End Use, 2025 and 2035
  • Figure 63: Western Europe Market Y-o-Y Growth Comparison by End Use, 2025 to 2035
  • Figure 64: Western Europe Market Attractiveness Analysis by End Use
  • Figure 65: Eastern Europe Market Value Share and BPS Analysis by Country, 2025 and 2035
  • Figure 66: Eastern Europe Market Value Share and BPS Analysis by Drive Type, 2025 and 2035
  • Figure 67: Eastern Europe Market Y-o-Y Growth Comparison by Drive Type, 2025 to 2035
  • Figure 68: Eastern Europe Market Attractiveness Analysis by Drive Type
  • Figure 69: Eastern Europe Market Value Share and BPS Analysis by Capacity, 2025 and 2035
  • Figure 70: Eastern Europe Market Y-o-Y Growth Comparison by Capacity, 2025 to 2035
  • Figure 71: Eastern Europe Market Attractiveness Analysis by Capacity
  • Figure 72: Eastern Europe Market Value Share and BPS Analysis by Category, 2025 and 2035
  • Figure 73: Eastern Europe Market Y-o-Y Growth Comparison by Category, 2025 to 2035
  • Figure 74: Eastern Europe Market Attractiveness Analysis by Category
  • Figure 75: Eastern Europe Market Value Share and BPS Analysis by End Use, 2025 and 2035
  • Figure 76: Eastern Europe Market Y-o-Y Growth Comparison by End Use, 2025 to 2035
  • Figure 77: Eastern Europe Market Attractiveness Analysis by End Use
  • Figure 78: East Asia Market Value Share and BPS Analysis by Country, 2025 and 2035
  • Figure 79: East Asia Market Value Share and BPS Analysis by Drive Type, 2025 and 2035
  • Figure 80: East Asia Market Y-o-Y Growth Comparison by Drive Type, 2025 to 2035
  • Figure 81: East Asia Market Attractiveness Analysis by Drive Type
  • Figure 82: East Asia Market Value Share and BPS Analysis by Capacity, 2025 and 2035
  • Figure 83: East Asia Market Y-o-Y Growth Comparison by Capacity, 2025 to 2035
  • Figure 84: East Asia Market Attractiveness Analysis by Capacity
  • Figure 85: East Asia Market Value Share and BPS Analysis by Category, 2025 and 2035
  • Figure 86: East Asia Market Y-o-Y Growth Comparison by Category, 2025 to 2035
  • Figure 87: East Asia Market Attractiveness Analysis by Category
  • Figure 88: East Asia Market Value Share and BPS Analysis by End Use, 2025 and 2035
  • Figure 89: East Asia Market Y-o-Y Growth Comparison by End Use, 2025 to 2035
  • Figure 90: East Asia Market Attractiveness Analysis by End Use
  • Figure 91: South Asia & Pacific Market Value Share and BPS Analysis by Country, 2025 and 2035
  • Figure 92: South Asia & Pacific Market Value Share and BPS Analysis by Drive Type, 2025 and 2035
  • Figure 93: South Asia & Pacific Market Y-o-Y Growth Comparison by Drive Type, 2025 to 2035
  • Figure 94: South Asia & Pacific Market Attractiveness Analysis by Drive Type
  • Figure 95: South Asia & Pacific Market Value Share and BPS Analysis by Capacity, 2025 and 2035
  • Figure 96: South Asia & Pacific Market Y-o-Y Growth Comparison by Capacity, 2025 to 2035
  • Figure 97: South Asia & Pacific Market Attractiveness Analysis by Capacity
  • Figure 98: South Asia & Pacific Market Value Share and BPS Analysis by Category, 2025 and 2035
  • Figure 99: South Asia & Pacific Market Y-o-Y Growth Comparison by Category, 2025 to 2035
  • Figure 100: South Asia & Pacific Market Attractiveness Analysis by Category
  • Figure 101: South Asia & Pacific Market Value Share and BPS Analysis by End Use, 2025 and 2035
  • Figure 102: South Asia & Pacific Market Y-o-Y Growth Comparison by End Use, 2025 to 2035
  • Figure 103: South Asia & Pacific Market Attractiveness Analysis by End Use
  • Figure 104: Middle East and Africa Market Value Share and BPS Analysis by Country, 2025 and 2035
  • Figure 105: Middle East and Africa Market Value Share and BPS Analysis by Drive Type, 2025 and 2035
  • Figure 106: Middle East and Africa Market Y-o-Y Growth Comparison by Drive Type, 2025 to 2035
  • Figure 107: Middle East and Africa Market Attractiveness Analysis by Drive Type
  • Figure 108: Middle East and Africa Market Value Share and BPS Analysis by Capacity, 2025 and 2035
  • Figure 109: Middle East and Africa Market Y-o-Y Growth Comparison by Capacity, 2025 to 2035
  • Figure 110: Middle East and Africa Market Attractiveness Analysis by Capacity
  • Figure 111: Middle East and Africa Market Value Share and BPS Analysis by Category, 2025 and 2035
  • Figure 112: Middle East and Africa Market Y-o-Y Growth Comparison by Category, 2025 to 2035
  • Figure 113: Middle East and Africa Market Attractiveness Analysis by Category
  • Figure 114: Middle East and Africa Market Value Share and BPS Analysis by End Use, 2025 and 2035
  • Figure 115: Middle East and Africa Market Y-o-Y Growth Comparison by End Use, 2025 to 2035
  • Figure 116: Middle East and Africa Market Attractiveness Analysis by End Use
  • Figure 117: Global Market - Tier Structure Analysis
  • Figure 118: Global Market - Company Share Analysis

Frequently Asked Questions

What is the market size of the fastener insertion machine market in 2025?

The market is valued at USD 351.5 million in 2025.

What is the projected size of the fastener insertion machine market by 2035?

The market is expected to reach USD 600.4 million by 2035.

What is the CAGR of the fastener insertion machine market from 2025 to 2035?

The market is projected to grow at a CAGR of 5.5% during the forecast period.

Which drive type holds the largest share in the fastener insertion machine market?

Pneumatic machines dominate the market with a 38% share in 2025.

Which country is expected to exhibit the fastest growth in the fastener insertion machine market?

India is the fastest growing country, with a projected CAGR of 6.0% between 2025 and 2035.

Explore Similar Insights

Future Market Insights

Fastener Insertion Machine Market