Reports

- Global Locations -

Headquarters

Future Market Insights, Inc.

Christiana Corporate, 200
Continental Drive, Suite 401,
Newark, Delaware - 19713,
United States

T: +1-845-579-5705

Americas

Future Market Insights, Inc.

616 Corporate Way, Suite 2-9018,
Valley Cottage, NY 10989, United States

T: +1-347-918-3531

MEA

Future Market Insights

1602-6 Jumeirah Bay X2 Tower, Plot No: JLT-PH2-X2A,
Jumeirah Lakes Towers, Dubai,
United Arab Emirates

Europe

Future Market Insights

3rd Floor, 207 Regent Street,
W1B 3HH London
United Kingdom

T: + 44 (0) 20 8123 9659
D: +44 (0) 20 3287 4268

Asia Pacific

Future Market Insights

IndiaLand Global Tech Park, Unit UG-1, Behind Grand HighStreet, Phase 1, Hinjawadi, MH, Pune – 411057, India

Female Stress Urinary Incontinence Treatment Device Market Outlook from 2024 to 2034

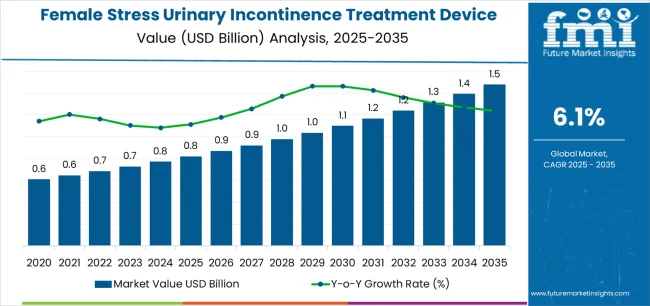
The female stress urinary incontinence treatment device market is projected to be worth US$ 770.0 million in 2024. The market is anticipated to reach US$ 1,432.0 million by 2034. The market is further expected to surge at a CAGR of 6.4% during the forecast period 2024 to 2034.

Attributes Key Insights
Female Stress Urinary Incontinence Treatment Device Market Estimated Size in 2024 US$ 770.0 million
Projected Market Value in 2034 US$ 1,432.0 million
Value-based CAGR from 2024 to 2034 6.4%

Don't pay for what you don't need

Customize your report by selecting specific countries or regions and save 30%!

Key Market Trends and Highlights

Many women prefer non surgical treatment options for stress urinary incontinence due to their minimally invasive nature and shorter recovery times. The preference has led to a surge in the demand for stress urinary incontinence treatment devices such as vaginal inserts, pessaries, and pelvic floor muscle stimulators.

  • There is a growing trend towards outpatient procedures for stress urinary incontinence treatment, driven by factors such as cost effectiveness, convenience, and reduced hospital stays. Treatment devices that can be used in outpatient settings are likely to witness increased adoption.
  • Collaboration between medical device companies, healthcare providers, and research institutions fosters innovation in stress urinary incontinence treatment devices. The partnerships help in the development of more effective and patient friendly solutions for stress urinary incontinence.
  • There is a growing emphasis on patient centric care in the healthcare industry. Manufacturers are designing stress urinary incontinence treatment devices that are tailored to meet the specific needs and preferences of female patients, thereby driving market growth.

2019 to 2023 Historical Analysis vs. 2024 to 2034 Market Forecast Projections

The scope for female stress urinary incontinence treatment device rose at a 7.2% CAGR between 2019 and 2023. The global market is anticipated to witness a downwards CAGR of 6.4% over the forecast period 2024 to 2034.

There might have been significant advancements in SUI treatment device technology, during the historical period, leading to the development of more effective, minimally invasive, and patient friendly devices. There was a rise in awareness about stress urinary incontinence among both patients and healthcare providers, leading to higher diagnosis rates and increased demand for treatment options.

The aging population demographic trend might have contributed to a higher prevalence of stress urinary incontinence, driving the demand for treatment devices. Changes in regulatory policies and approval processes for medical devices had influenced the market dynamics, affecting product innovation and market entry.

Patients and healthcare providers are expected to continue to prefer minimally invasive treatment options for stress urinary incontinence, driving the demand for advanced devices such as injectable bulking agents, neuromodulation devices, and sling systems.

Continued investments in research and development are expected to drive innovation in stress treatment devices, with companies focusing on addressing unmet clinical needs, enhancing product efficacy, and reducing complications.

Sabyasachi Ghosh
Sabyasachi Ghosh

Principal Consultant

Talk to Analyst

Find your sweet spots for generating winning opportunities in this market.

Female Stress Urinary Incontinence Treatment Device Market Key Drivers

There is a growing awareness about female stress urinary incontinence among both patients and healthcare providers. The awareness drives more women to seek treatment options, thereby expanding the market.

  • Advances in medical technology have led to the development of more effective and minimally invasive treatment devices for female stress urinary incontinence. The advancements include the introduction of innovative materials, improved designs, and better surgical techniques.
  • The prevalence of female stress urinary incontinence is expected to rise. The pelvic floor muscles weaken, as women age, leading to an increased incidence of female stress urinary incontinence. The demographic trend fuels the demand for stress urinary incontinence treatment devices.
  • Rising healthcare expenditure across the globe enables more women to afford treatment for stress urinary incontinence. Healthcare reimbursement policies in many countries cover the cost of stress urinary incontinence treatment devices, making them more accessible to patients.

Challenges in the Female Stress Urinary Incontinence Treatment Device Market

Stigma surrounding pelvic floor disorders and urinary incontinence may deter women from seeking medical treatment or discussing their symptoms with healthcare providers, leading to underdiagnosis and undertreatment of stress urinary incontinence.

  • Inadequate reimbursement coverage for stress urinary incontinence treatment devices and procedures in certain healthcare systems may restrict patient access to these interventions, particularly in regions where out of pocket expenses are high.
  • Safety issues, adverse events, and product recalls associated with stress urinary incontinence treatment devices can erode patient and provider confidence in the safety and efficacy of these interventions, leading to a decline in market demand and regulatory scrutiny.
  • The high cost of stress urinary incontinence treatment devices, surgical procedures, and long term management strategies may pose a financial barrier to access for some patients, particularly those without adequate insurance coverage or financial resources.

Get the data you need at a Fraction of the cost

Personalize your report by choosing insights you need
and save 40%!

Comparative View of Adjacent Industries

Future Market Insights has compared two other industries, pelvic floor stimulators, and urinary collection device market. Emerging economies present significant growth opportunities for the female SUI treatment device market. Rising healthcare infrastructure, increasing disposable incomes, and growing awareness about the health issues of the women contribute to market expansion in these regions.

The increasing prevalence of pelvic floor disorders such as urinary incontinence, fecal incontinence, and pelvic organ prolapse is a significant driver for the pelvic floor stimulators market. More patients are seeking treatment options, including pelvic floor stimulation therapy, as awareness of these conditions grows.

The rising prevalence of urinary disorders such as urinary incontinence, urinary tract infections, and urological conditions contributes to the growing demand for urinary collection devices. The need for effective urinary management solutions rises, as the population ages and chronic health conditions become more prevalent.

Female Stress Urinary Incontinence Treatment Device Market:

Attributes Female Stress Urinary Incontinence Treatment Device Market
CAGR from 2024 to 2034 6.4%
Key Trends
  • Patient education and support programs play a crucial role in empowering women to actively manage their stress urinary incontinence symptoms and make informed treatment decisions.
  • The rising prevalence of obesity worldwide contributes to the growing incidence of stress urinary incontinence and drives demand for effective treatment devices.
Opportunity
  • The development of advanced biomaterials with improved biocompatibility, durability, and safety profiles enhances the performance and longevity of stress urinary incontinence treatment devices.
  • Manufacturers are developing stress urinary incontinence treatment devices that not only address urinary incontinence but also enhance patient comfort, mobility, and overall well being.

Pelvic Floor Stimulators Market:

Attributes Pelvic Floor Stimulators Market
CAGR from 2023 to 2033 8.8%
Key Trends
  • There will be a higher demand for pelvic floor stimulators to address the associated symptoms, as the global population continues to age.
  • Advances in pelvic floor stimulation technology have led to the development of more effective and user friendly devices.
Opportunity
  • Pelvic floor stimulators offer a non surgical alternative to traditional treatment modalities, contributing to their growing popularity.
  • Pelvic floor stimulators are being increasingly used for a variety of pelvic floor disorders beyond urinary incontinence, including fecal incontinence, pelvic pain syndromes, and sexual dysfunction.

Urinary Collection Device Market:

Attributes Urinary Collection Device Market
CAGR from 2022 to 2032 5.2%
Key Trends
  • The demographic shift towards an older population demographic, particularly in developed countries, drives the demand for urinary collection devices designed to manage incontinence, and urinary retention.
  • Innovations such as discreet designs, anti reflux features, and odor control mechanisms enhance patient satisfaction and drive market growth.
Opportunity
  • Many patients prefer non invasive and home based urinary management solutions that offer convenience, privacy, and independence.
  • Enhanced awareness encourages patients to seek appropriate urinary collection devices and treatment options, driving market growth.

Country-wise Insights

The below table showcases revenues in terms of the top 5 leading countries, spearheaded by the United States and Germany. The countries are expected to lead the market through 2034.

Countries Forecast CAGRs from 2024 to 2034
The United States 6.7%
The United Kingdom 6.0%
Germany 6.3%
France 5.9%
India 5.7%

Increasing Prevalence of Female SUI Driving the Market in the United States

The female stress urinary incontinence treatment device market in the United States expected to expand at a CAGR of 6.7% through 2034. The country has a large population of women affected by stress urinary incontinence. There is a growing demand for effective treatment options, as the population ages and awareness of stress urinary incontinence increases, driving market growth.

Ongoing advancements in medical technology have led to the development of innovative stress urinary incontinence treatment devices with improved efficacy, safety, and patient comfort. The technological innovations drive market growth by offering patients and healthcare providers more options for managing stress urinary incontinence.

Growing Awareness and Education to Accelerate Market Growth in the United Kingdom

The female stress urinary incontinence treatment device market in the United Kingdom is anticipated to expand at a CAGR of 6.0% through 2034. There is increasing awareness and education about pelvic health and urinary incontinence among women in the United Kingdom.

Greater awareness leads to more women seeking treatment for stress urinary incontinence and advocating for better management options, which in turn drives market growth.

Many women in the United Kingdom prefer non surgical or minimally invasive treatments for stress urinary incontinence due to reduced risks, shorter recovery times, and improved quality of life. The availability of non surgical stress urinary incontinence treatment devices caters to patient preferences and drives market growth.

Strong Healthcare Infrastructure Spearhead the Market in Germany

Female stress urinary incontinence treatment device trends in Germany are taking a turn for the better. A 6.3% CAGR is forecast for the country from 2024 to 2034. Germany has a well established healthcare system with access to specialized urological and gynecological services.

The availability of comprehensive healthcare services supports the adoption and utilization of stress urinary incontinence treatment devices, contributing to market growth.

Germany has stringent regulatory standards for medical devices, ensuring the safety, efficacy, and quality of stress urinary incontinence treatment devices. Regulatory compliance provides confidence to healthcare providers and patients, fostering innovation and market growth.

Government Support and Funding Fueling the Market in France

The female stress urinary incontinence treatment device market in France is poised to expand at a CAGR of 5.9% through 2034. Government support and funding for healthcare initiatives, including research and development in the field of pelvic health, drive innovation and expand treatment options for stress urinary incontinence in France. Public investments in healthcare infrastructure and services contribute to market growth.

France is known for its strong research and development capabilities in the healthcare sector. Leading universities, research institutions, and medical device companies are engaged in developing new stress urinary incontinence treatment devices. Research and development initiatives drive technological advancements and expand the range of treatment options available in the market.

Rising Female Workforce Participation Driving the Demand in India

The female stress urinary incontinence treatment device market in India is anticipated to expand at a CAGR of 5.7% through 2034. Increasing female workforce participation in India means that more women are active in professional and social environments.

Women in the workforce are more likely to seek treatment for conditions such as stress urinary incontinence to maintain their quality of life and productivity, driving market growth.

Increased investments in research and development by both domestic and international companies lead to the development of advanced and cost effective treatment devices for stress urinary incontinence. The introduction of new and improved products expands treatment options and drives market growth.

Category-wise Insights

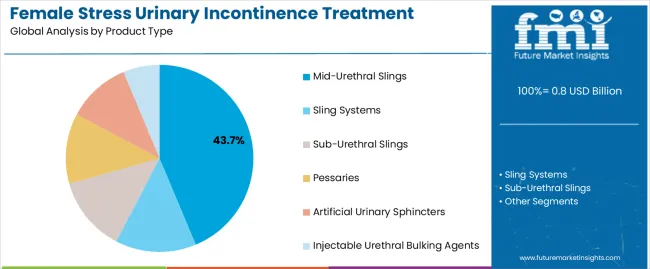
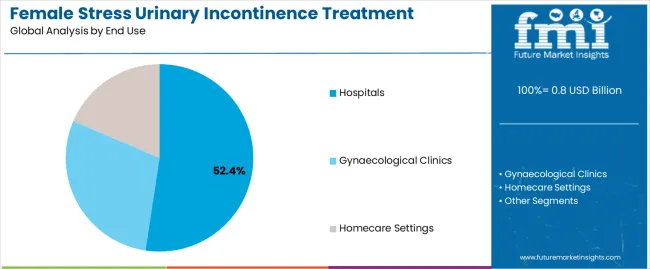
The below table highlights how sling system segment is projected to lead the market in terms of product type, and is expected to account for a share of 54.0% in 2024. Based on end use, the hospitals segment is expected to account for a share of 68.0% in 2024.

Category Market Shares in 2024
Sling System 54.0%
Hospitals 68.0%

Sling System Claims High Demand for Female Stress Urinary Incontinence Treatment Device

Based on product type, the sling system segment is expected to continue dominating the female stress urinary incontinence treatment device market. Sling systems have demonstrated high efficacy in treating stress urinary incontinence by providing support to the urethra and restoring urinary continence. They offer long term symptom relief and improved quality of life for patients, driving their adoption among healthcare providers and patients.

Sling procedures are minimally invasive compared to traditional surgical approaches for stress urinary incontinence, such as open abdominal surgery. Minimally invasive procedures are associated with shorter recovery times, reduced post operative pain, and lower risk of complications, making sling systems an attractive treatment option for patients.

Hospitals Segment to Hold High Demand for Female Stress Urinary Incontinence Treatment Device

In terms of end use, the hospitals segment is expected to continue dominating the female stress urinary incontinence treatment device market, attributed to several key factors.

Hospitals typically have advanced diagnostic and treatment facilities, including urology departments equipped with specialized equipment and expertise for the diagnosis and management of female stress urinary incontinence. The facilities attract patients seeking comprehensive care for their condition, driving demand for stress urinary incontinence treatment devices.

Hospitals employ a diverse range of specialized healthcare professionals, including urologists, gynecologists, and pelvic floor specialists, who are trained in the diagnosis and treatment of female stress urinary incontinence. Patients trust hospitals as institutions with access to a multidisciplinary team of experts, enhancing the appeal of seeking treatment in hospital settings.
Competitive Landscape

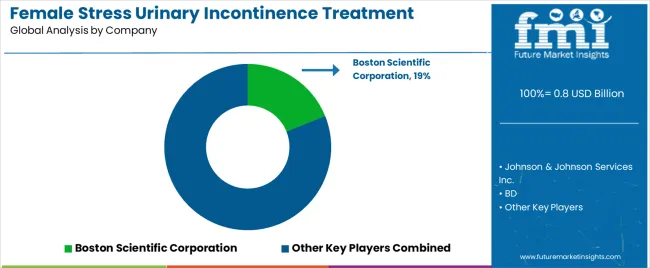
The competitive landscape of the female stress urinary incontinence treatment device market is characterized by a diverse range of players including medical device manufacturers, healthcare providers, research institutions, and regulatory bodies. The entities contribute to the development, production, distribution, and regulation of these treatment devices, shaping the dynamics of the market.

Company Portfolio

  • Boston Scientific Corporation is a global medical technology company dedicated to transforming lives through innovative medical solutions. In the female stress urinary incontinence treatment device market, the company offers a comprehensive portfolio of products including sling systems, urethral inserts, and bulking agents. Their sling systems, such as the Obtryx and Lynx devices, are designed to provide support to the urethra and address stress urinary incontinence effectively.
  • Coloplast A/S is a leading provider of medical devices and services specializing in intimate healthcare, urology, and wound care. Coloplast offers a range of innovative solutions including sling systems, urethral inserts, and urinary catheters. Their products, such as the Altis and Novasilk sling systems, are designed to provide reliable support and improve quality of life for women experiencing stress urinary incontinence.

Key Coverage in the Female Stress Urinary Incontinence Treatment Device Industry Report

  • Innovative Biofeedback Technology
  • Non-Invasive Pelvic Floor Therapy
  • Advanced Stress Urinary Incontinence Device
  • Comfortable Wearable Solutions
  • Targeted Muscle Rehabilitation
  • Personalized Pelvic Health Solutions
  • Women's Health Devices Market
  • Pelvic Floor Rehabilitation Market
  • Urology Devices Market
  • Incontinence Products Market
  • Medical Wearable Devices Market
  • Pelvic Health Solutions Market

Report Scope

Attribute Details
Estimated Market Size in 2024 US$ 770.0 million
Projected Market Valuation in 2034 US$ 1,432.0 million
Value-based CAGR 2024 to 2034 6.4%
Forecast Period 2024 to 2034
Historical Data Available for 2019 to 2023
Market Analysis Value in US$ Million
Key Regions Covered
  • North America
  • Latin America
  • Western Europe
  • Eastern Europe
  • South Asia and Pacific
  • East Asia
  • The Middle East & Africa
Key Market Segments Covered
  • Product Type
  • End Use
  • Region
Key Countries Profiled
  • The United States
  • Canada
  • Brazil
  • Mexico
  • Germany
  • France
  • France
  • Spain
  • Italy
  • Russia
  • Poland
  • Czech Republic
  • Romania
  • India
  • Bangladesh
  • Australia
  • New Zealand
  • China
  • Japan
  • South Korea
  • GCC countries
  • South Africa
  • Israel
Key Companies Profiled
  • Boston Scientific Corporation
  • Johnson & Johnson Services Inc.
  • BD
  • Coloplast A/S
  • CooperSurgical Inc.
  • MEDGYN PRODUCTS Inc.
  • Cousin Biotech
  • Caldera Medical
  • Betatech Medical
  • FEG Textiltechnik mbH
  • C.R. Bard

Segmentation Analysis of the Female Stress Urinary Incontinence Treatment Device Market

By Product Type:

  • Sling Systems
    • Mid-Urethral Slings
    • Sub-Urethral Slings
  • Pessaries
  • Artificial Urinary Sphincters
  • Injectable Urethral Bulking Agents

By End Use:

  • Hospitals
  • Gynaecological Clinics
  • Homecare Settings

By Region:

  • North America
  • Latin America
  • Western Europe
  • Eastern Europe
  • South Asia and Pacific
  • East Asia
  • The Middle East and Africa

Frequently Asked Questions

What is the anticipated value of the Female Stress Urinary Incontinence Treatment Device market in 2024?

The female stress urinary incontinence treatment device market is projected to reach a valuation of US$ 770.0 Million in 2024.

What is the expected CAGR for the Female Stress Urinary Incontinence Treatment Device market until 2034?

The female stress urinary incontinence treatment device industry is set to expand by a CAGR of 6.4% through 2034.

How much valuation is projected for the Female Stress Urinary Incontinence Treatment Device market in 2034?

The female stress urinary incontinence treatment device market is forecast to reach US$ 1,432.0 Million by 2034.

Which country is projected to lead the Female Stress Urinary Incontinence Treatment Device market?

The United States is expected to be the top performing market, exhibiting a CAGR of 6.7% through 2034.

Which is the dominant product type in the Female Stress Urinary Incontinence Treatment Device domain?

Sling system segment is preferred, and is expected to account for a share of 54.0% in 2024.

Table of Content

1. Executive Summary

    1.1. Global Market Outlook

    1.2. Demand-side Trends

    1.3. Supply-side Trends

    1.4. Technology Roadmap Analysis

    1.5. Analysis and Recommendations

2. Market Overview

    2.1. Market Coverage / Taxonomy

    2.2. Market Definition / Scope / Limitations

3. Market Background

    3.1. Market Dynamics

        3.1.1. Drivers

        3.1.2. Restraints

        3.1.3. Opportunity

        3.1.4. Trends

    3.2. Scenario Forecast

        3.2.1. Demand in Optimistic Scenario

        3.2.2. Demand in Likely Scenario

        3.2.3. Demand in Conservative Scenario

    3.3. Opportunity Map Analysis

    3.4. Product Life Cycle Analysis

    3.5. Supply Chain Analysis

        3.5.1. Supply Side Participants and their Roles

            3.5.1.1. Manufacturer

            3.5.1.2. Mid-Level Participants (Traders)

            3.5.1.3. Distributors

        3.5.2. Value Added and Value Created at Node in the Supply Chain

        3.5.3. List of Raw Material Suppliers

        3.5.4. List of Existing and Potential Buyer’s

    3.6. Investment Feasibility Matrix

    3.7. Value Chain Analysis

        3.7.1. Profit Margin Analysis

        3.7.2. Distributors

    3.8. PESTLE and Porter’s Analysis

    3.9. Regulatory Landscape

        3.9.1. By Key Regions

        3.9.2. By Key Countries

    3.10. Regional Parent Market Outlook

    3.11. Production and Consumption Statistics

    3.12. Import and Export Statistics

4. Global Market Analysis 2019 to 2023 and Forecast, 2024 to 2034

    4.1. Historical Market Size Value (US$ Million) & Volume (Units) Analysis, 2019 to 2023

    4.2. Current and Future Market Size Value (US$ Million) & Volume (Units) Projections, 2024 to 2034

        4.2.1. Y-o-Y Growth Trend Analysis

        4.2.2. Absolute $ Opportunity Analysis

5. Global Market Analysis 2019 to 2023 and Forecast 2024 to 2034, By Product Type

    5.1. Introduction / Key Findings

    5.2. Historical Market Size Value (US$ Million) & Volume (Units) Analysis By Product Type, 2019 to 2023

    5.3. Current and Future Market Size Value (US$ Million) & Volume (Units) Analysis and Forecast By Product Type, 2024 to 2034

        5.3.1. Sling Systems

            5.3.1.1. Mid-Urethral Slings

            5.3.1.2. Sub-Urethral Slings

        5.3.2. Pessaries

        5.3.3. Artificial Urinary Sphincters (AUS)

        5.3.4. Injectable Urethral Bulking Agents

    5.4. Y-o-Y Growth Trend Analysis By Product Type, 2019 to 2023

    5.5. Absolute $ Opportunity Analysis By Product Type, 2024 to 2034

6. Global Market Analysis 2019 to 2023 and Forecast 2024 to 2034, By End Use

    6.1. Introduction / Key Findings

    6.2. Historical Market Size Value (US$ Million) & Volume (Units) Analysis By End Use, 2019 to 2023

    6.3. Current and Future Market Size Value (US$ Million) & Volume (Units) Analysis and Forecast By End Use, 2024 to 2034

        6.3.1. Hospitals

        6.3.2. Gynaecological Clinics

        6.3.3. Homecare Settings

    6.4. Y-o-Y Growth Trend Analysis By End Use, 2019 to 2023

    6.5. Absolute $ Opportunity Analysis By End Use, 2024 to 2034

7. Global Market Analysis 2019 to 2023 and Forecast 2024 to 2034, By Region

    7.1. Introduction

    7.2. Historical Market Size Value (US$ Million) & Volume (Units) Analysis By Region, 2019 to 2023

    7.3. Current Market Size Value (US$ Million) & Volume (Units) Analysis and Forecast By Region, 2024 to 2034

        7.3.1. North America

        7.3.2. Latin America

        7.3.3. Western Europe

        7.3.4. Eastern Europe

        7.3.5. South Asia and Pacific

        7.3.6. East Asia

        7.3.7. Middle East and Africa

    7.4. Market Attractiveness Analysis By Region

8. North America Market Analysis 2019 to 2023 and Forecast 2024 to 2034, By Country

    8.1. Historical Market Size Value (US$ Million) & Volume (Units) Trend Analysis By Market Taxonomy, 2019 to 2023

    8.2. Market Size Value (US$ Million) & Volume (Units) Forecast By Market Taxonomy, 2024 to 2034

        8.2.1. By Country

            8.2.1.1. USA

            8.2.1.2. Canada

        8.2.2. By Product Type

        8.2.3. By End Use

    8.3. Market Attractiveness Analysis

        8.3.1. By Country

        8.3.2. By Product Type

        8.3.3. By End Use

    8.4. Key Takeaways

9. Latin America Market Analysis 2019 to 2023 and Forecast 2024 to 2034, By Country

    9.1. Historical Market Size Value (US$ Million) & Volume (Units) Trend Analysis By Market Taxonomy, 2019 to 2023

    9.2. Market Size Value (US$ Million) & Volume (Units) Forecast By Market Taxonomy, 2024 to 2034

        9.2.1. By Country

            9.2.1.1. Brazil

            9.2.1.2. Mexico

            9.2.1.3. Rest of Latin America

        9.2.2. By Product Type

        9.2.3. By End Use

    9.3. Market Attractiveness Analysis

        9.3.1. By Country

        9.3.2. By Product Type

        9.3.3. By End Use

    9.4. Key Takeaways

10. Western Europe Market Analysis 2019 to 2023 and Forecast 2024 to 2034, By Country

    10.1. Historical Market Size Value (US$ Million) & Volume (Units) Trend Analysis By Market Taxonomy, 2019 to 2023

    10.2. Market Size Value (US$ Million) & Volume (Units) Forecast By Market Taxonomy, 2024 to 2034

        10.2.1. By Country

            10.2.1.1. Germany

            10.2.1.2. UK

            10.2.1.3. France

            10.2.1.4. Spain

            10.2.1.5. Italy

            10.2.1.6. Rest of Western Europe

        10.2.2. By Product Type

        10.2.3. By End Use

    10.3. Market Attractiveness Analysis

        10.3.1. By Country

        10.3.2. By Product Type

        10.3.3. By End Use

    10.4. Key Takeaways

11. Eastern Europe Market Analysis 2019 to 2023 and Forecast 2024 to 2034, By Country

    11.1. Historical Market Size Value (US$ Million) & Volume (Units) Trend Analysis By Market Taxonomy, 2019 to 2023

    11.2. Market Size Value (US$ Million) & Volume (Units) Forecast By Market Taxonomy, 2024 to 2034

        11.2.1. By Country

            11.2.1.1. Poland

            11.2.1.2. Russia

            11.2.1.3. Czech Republic

            11.2.1.4. Romania

            11.2.1.5. Rest of Eastern Europe

        11.2.2. By Product Type

        11.2.3. By End Use

    11.3. Market Attractiveness Analysis

        11.3.1. By Country

        11.3.2. By Product Type

        11.3.3. By End Use

    11.4. Key Takeaways

12. South Asia and Pacific Market Analysis 2019 to 2023 and Forecast 2024 to 2034, By Country

    12.1. Historical Market Size Value (US$ Million) & Volume (Units) Trend Analysis By Market Taxonomy, 2019 to 2023

    12.2. Market Size Value (US$ Million) & Volume (Units) Forecast By Market Taxonomy, 2024 to 2034

        12.2.1. By Country

            12.2.1.1. India

            12.2.1.2. Bangladesh

            12.2.1.3. Australia

            12.2.1.4. New Zealand

            12.2.1.5. Rest of South Asia and Pacific

        12.2.2. By Product Type

        12.2.3. By End Use

    12.3. Market Attractiveness Analysis

        12.3.1. By Country

        12.3.2. By Product Type

        12.3.3. By End Use

    12.4. Key Takeaways

13. East Asia Market Analysis 2019 to 2023 and Forecast 2024 to 2034, By Country

    13.1. Historical Market Size Value (US$ Million) & Volume (Units) Trend Analysis By Market Taxonomy, 2019 to 2023

    13.2. Market Size Value (US$ Million) & Volume (Units) Forecast By Market Taxonomy, 2024 to 2034

        13.2.1. By Country

            13.2.1.1. China

            13.2.1.2. Japan

            13.2.1.3. South Korea

        13.2.2. By Product Type

        13.2.3. By End Use

    13.3. Market Attractiveness Analysis

        13.3.1. By Country

        13.3.2. By Product Type

        13.3.3. By End Use

    13.4. Key Takeaways

14. Middle East and Africa Market Analysis 2019 to 2023 and Forecast 2024 to 2034, By Country

    14.1. Historical Market Size Value (US$ Million) & Volume (Units) Trend Analysis By Market Taxonomy, 2019 to 2023

    14.2. Market Size Value (US$ Million) & Volume (Units) Forecast By Market Taxonomy, 2024 to 2034

        14.2.1. By Country

            14.2.1.1. GCC Countries

            14.2.1.2. South Africa

            14.2.1.3. Israel

            14.2.1.4. Rest of MEA

        14.2.2. By Product Type

        14.2.3. By End Use

    14.3. Market Attractiveness Analysis

        14.3.1. By Country

        14.3.2. By Product Type

        14.3.3. By End Use

    14.4. Key Takeaways

15. Key Countries Market Analysis

    15.1. USA

        15.1.1. Pricing Analysis

        15.1.2. Market Share Analysis, 2023

            15.1.2.1. By Product Type

            15.1.2.2. By End Use

    15.2. Canada

        15.2.1. Pricing Analysis

        15.2.2. Market Share Analysis, 2023

            15.2.2.1. By Product Type

            15.2.2.2. By End Use

    15.3. Brazil

        15.3.1. Pricing Analysis

        15.3.2. Market Share Analysis, 2023

            15.3.2.1. By Product Type

            15.3.2.2. By End Use

    15.4. Mexico

        15.4.1. Pricing Analysis

        15.4.2. Market Share Analysis, 2023

            15.4.2.1. By Product Type

            15.4.2.2. By End Use

    15.5. Germany

        15.5.1. Pricing Analysis

        15.5.2. Market Share Analysis, 2023

            15.5.2.1. By Product Type

            15.5.2.2. By End Use

    15.6. UK

        15.6.1. Pricing Analysis

        15.6.2. Market Share Analysis, 2023

            15.6.2.1. By Product Type

            15.6.2.2. By End Use

    15.7. France

        15.7.1. Pricing Analysis

        15.7.2. Market Share Analysis, 2023

            15.7.2.1. By Product Type

            15.7.2.2. By End Use

    15.8. Spain

        15.8.1. Pricing Analysis

        15.8.2. Market Share Analysis, 2023

            15.8.2.1. By Product Type

            15.8.2.2. By End Use

    15.9. Italy

        15.9.1. Pricing Analysis

        15.9.2. Market Share Analysis, 2023

            15.9.2.1. By Product Type

            15.9.2.2. By End Use

    15.10. Poland

        15.10.1. Pricing Analysis

        15.10.2. Market Share Analysis, 2023

            15.10.2.1. By Product Type

            15.10.2.2. By End Use

    15.11. Russia

        15.11.1. Pricing Analysis

        15.11.2. Market Share Analysis, 2023

            15.11.2.1. By Product Type

            15.11.2.2. By End Use

    15.12. Czech Republic

        15.12.1. Pricing Analysis

        15.12.2. Market Share Analysis, 2023

            15.12.2.1. By Product Type

            15.12.2.2. By End Use

    15.13. Romania

        15.13.1. Pricing Analysis

        15.13.2. Market Share Analysis, 2023

            15.13.2.1. By Product Type

            15.13.2.2. By End Use

    15.14. India

        15.14.1. Pricing Analysis

        15.14.2. Market Share Analysis, 2023

            15.14.2.1. By Product Type

            15.14.2.2. By End Use

    15.15. Bangladesh

        15.15.1. Pricing Analysis

        15.15.2. Market Share Analysis, 2023

            15.15.2.1. By Product Type

            15.15.2.2. By End Use

    15.16. Australia

        15.16.1. Pricing Analysis

        15.16.2. Market Share Analysis, 2023

            15.16.2.1. By Product Type

            15.16.2.2. By End Use

    15.17. New Zealand

        15.17.1. Pricing Analysis

        15.17.2. Market Share Analysis, 2023

            15.17.2.1. By Product Type

            15.17.2.2. By End Use

    15.18. China

        15.18.1. Pricing Analysis

        15.18.2. Market Share Analysis, 2023

            15.18.2.1. By Product Type

            15.18.2.2. By End Use

    15.19. Japan

        15.19.1. Pricing Analysis

        15.19.2. Market Share Analysis, 2023

            15.19.2.1. By Product Type

            15.19.2.2. By End Use

    15.20. South Korea

        15.20.1. Pricing Analysis

        15.20.2. Market Share Analysis, 2023

            15.20.2.1. By Product Type

            15.20.2.2. By End Use

    15.21. GCC Countries

        15.21.1. Pricing Analysis

        15.21.2. Market Share Analysis, 2023

            15.21.2.1. By Product Type

            15.21.2.2. By End Use

    15.22. South Africa

        15.22.1. Pricing Analysis

        15.22.2. Market Share Analysis, 2023

            15.22.2.1. By Product Type

            15.22.2.2. By End Use

    15.23. Israel

        15.23.1. Pricing Analysis

        15.23.2. Market Share Analysis, 2023

            15.23.2.1. By Product Type

            15.23.2.2. By End Use

16. Market Structure Analysis

    16.1. Competition Dashboard

    16.2. Competition Benchmarking

    16.3. Market Share Analysis of Top Players

        16.3.1. By Regional

        16.3.2. By Product Type

        16.3.3. By End Use

17. Competition Analysis

    17.1. Competition Deep Dive

        17.1.1. Boston Scientific Corporation

            17.1.1.1. Overview

            17.1.1.2. Product Portfolio

            17.1.1.3. Profitability by Market Segments

            17.1.1.4. Sales Footprint

            17.1.1.5. Strategy Overview

                17.1.1.5.1. Marketing Strategy

                17.1.1.5.2. Product Strategy

                17.1.1.5.3. Channel Strategy

        17.1.2. Johnson & Johnson Services Inc.

            17.1.2.1. Overview

            17.1.2.2. Product Portfolio

            17.1.2.3. Profitability by Market Segments

            17.1.2.4. Sales Footprint

            17.1.2.5. Strategy Overview

                17.1.2.5.1. Marketing Strategy

                17.1.2.5.2. Product Strategy

                17.1.2.5.3. Channel Strategy

        17.1.3. Becton, Dickinson and Company

            17.1.3.1. Overview

            17.1.3.2. Product Portfolio

            17.1.3.3. Profitability by Market Segments

            17.1.3.4. Sales Footprint

            17.1.3.5. Strategy Overview

                17.1.3.5.1. Marketing Strategy

                17.1.3.5.2. Product Strategy

                17.1.3.5.3. Channel Strategy

        17.1.4. Coloplast A/S

            17.1.4.1. Overview

            17.1.4.2. Product Portfolio

            17.1.4.3. Profitability by Market Segments

            17.1.4.4. Sales Footprint

            17.1.4.5. Strategy Overview

                17.1.4.5.1. Marketing Strategy

                17.1.4.5.2. Product Strategy

                17.1.4.5.3. Channel Strategy

        17.1.5. CooperSurgical Inc.

            17.1.5.1. Overview

            17.1.5.2. Product Portfolio

            17.1.5.3. Profitability by Market Segments

            17.1.5.4. Sales Footprint

            17.1.5.5. Strategy Overview

                17.1.5.5.1. Marketing Strategy

                17.1.5.5.2. Product Strategy

                17.1.5.5.3. Channel Strategy

        17.1.6. MedGyn Products, Inc.

            17.1.6.1. Overview

            17.1.6.2. Product Portfolio

            17.1.6.3. Profitability by Market Segments

            17.1.6.4. Sales Footprint

            17.1.6.5. Strategy Overview

                17.1.6.5.1. Marketing Strategy

                17.1.6.5.2. Product Strategy

                17.1.6.5.3. Channel Strategy

        17.1.7. Cousin Biotech

            17.1.7.1. Overview

            17.1.7.2. Product Portfolio

            17.1.7.3. Profitability by Market Segments

            17.1.7.4. Sales Footprint

            17.1.7.5. Strategy Overview

                17.1.7.5.1. Marketing Strategy

                17.1.7.5.2. Product Strategy

                17.1.7.5.3. Channel Strategy

        17.1.8. Caldera Medical

            17.1.8.1. Overview

            17.1.8.2. Product Portfolio

            17.1.8.3. Profitability by Market Segments

            17.1.8.4. Sales Footprint

            17.1.8.5. Strategy Overview

                17.1.8.5.1. Marketing Strategy

                17.1.8.5.2. Product Strategy

                17.1.8.5.3. Channel Strategy

        17.1.9. Betatech Medical

            17.1.9.1. Overview

            17.1.9.2. Product Portfolio

            17.1.9.3. Profitability by Market Segments

            17.1.9.4. Sales Footprint

            17.1.9.5. Strategy Overview

                17.1.9.5.1. Marketing Strategy

                17.1.9.5.2. Product Strategy

                17.1.9.5.3. Channel Strategy

        17.1.10. FEG Textiltechnik mbH

            17.1.10.1. Overview

            17.1.10.2. Product Portfolio

            17.1.10.3. Profitability by Market Segments

            17.1.10.4. Sales Footprint

            17.1.10.5. Strategy Overview

                17.1.10.5.1. Marketing Strategy

                17.1.10.5.2. Product Strategy

                17.1.10.5.3. Channel Strategy

18. Assumptions & Acronyms Used

19. Research Methodology

Don't pay for what you don't need

Customize your report by selecting specific countries or regions and save 30%!

List of Tables

Table 1: Global Market Value (US$ Million) Forecast by Region, 2019 to 2034

Table 2: Global Market Volume (Units) Forecast by Region, 2019 to 2034

Table 3: Global Market Value (US$ Million) Forecast by Product Type, 2019 to 2034

Table 4: Global Market Volume (Units) Forecast by Product Type, 2019 to 2034

Table 5: Global Market Value (US$ Million) Forecast by End Use, 2019 to 2034

Table 6: Global Market Volume (Units) Forecast by End Use, 2019 to 2034

Table 7: North America Market Value (US$ Million) Forecast by Country, 2019 to 2034

Table 8: North America Market Volume (Units) Forecast by Country, 2019 to 2034

Table 9: North America Market Value (US$ Million) Forecast by Product Type, 2019 to 2034

Table 10: North America Market Volume (Units) Forecast by Product Type, 2019 to 2034

Table 11: North America Market Value (US$ Million) Forecast by End Use, 2019 to 2034

Table 12: North America Market Volume (Units) Forecast by End Use, 2019 to 2034

Table 13: Latin America Market Value (US$ Million) Forecast by Country, 2019 to 2034

Table 14: Latin America Market Volume (Units) Forecast by Country, 2019 to 2034

Table 15: Latin America Market Value (US$ Million) Forecast by Product Type, 2019 to 2034

Table 16: Latin America Market Volume (Units) Forecast by Product Type, 2019 to 2034

Table 17: Latin America Market Value (US$ Million) Forecast by End Use, 2019 to 2034

Table 18: Latin America Market Volume (Units) Forecast by End Use, 2019 to 2034

Table 19: Western Europe Market Value (US$ Million) Forecast by Country, 2019 to 2034

Table 20: Western Europe Market Volume (Units) Forecast by Country, 2019 to 2034

Table 21: Western Europe Market Value (US$ Million) Forecast by Product Type, 2019 to 2034

Table 22: Western Europe Market Volume (Units) Forecast by Product Type, 2019 to 2034

Table 23: Western Europe Market Value (US$ Million) Forecast by End Use, 2019 to 2034

Table 24: Western Europe Market Volume (Units) Forecast by End Use, 2019 to 2034

Table 25: Eastern Europe Market Value (US$ Million) Forecast by Country, 2019 to 2034

Table 26: Eastern Europe Market Volume (Units) Forecast by Country, 2019 to 2034

Table 27: Eastern Europe Market Value (US$ Million) Forecast by Product Type, 2019 to 2034

Table 28: Eastern Europe Market Volume (Units) Forecast by Product Type, 2019 to 2034

Table 29: Eastern Europe Market Value (US$ Million) Forecast by End Use, 2019 to 2034

Table 30: Eastern Europe Market Volume (Units) Forecast by End Use, 2019 to 2034

Table 31: South Asia and Pacific Market Value (US$ Million) Forecast by Country, 2019 to 2034

Table 32: South Asia and Pacific Market Volume (Units) Forecast by Country, 2019 to 2034

Table 33: South Asia and Pacific Market Value (US$ Million) Forecast by Product Type, 2019 to 2034

Table 34: South Asia and Pacific Market Volume (Units) Forecast by Product Type, 2019 to 2034

Table 35: South Asia and Pacific Market Value (US$ Million) Forecast by End Use, 2019 to 2034

Table 36: South Asia and Pacific Market Volume (Units) Forecast by End Use, 2019 to 2034

Table 37: East Asia Market Value (US$ Million) Forecast by Country, 2019 to 2034

Table 38: East Asia Market Volume (Units) Forecast by Country, 2019 to 2034

Table 39: East Asia Market Value (US$ Million) Forecast by Product Type, 2019 to 2034

Table 40: East Asia Market Volume (Units) Forecast by Product Type, 2019 to 2034

Table 41: East Asia Market Value (US$ Million) Forecast by End Use, 2019 to 2034

Table 42: East Asia Market Volume (Units) Forecast by End Use, 2019 to 2034

Table 43: Middle East and Africa Market Value (US$ Million) Forecast by Country, 2019 to 2034

Table 44: Middle East and Africa Market Volume (Units) Forecast by Country, 2019 to 2034

Table 45: Middle East and Africa Market Value (US$ Million) Forecast by Product Type, 2019 to 2034

Table 46: Middle East and Africa Market Volume (Units) Forecast by Product Type, 2019 to 2034

Table 47: Middle East and Africa Market Value (US$ Million) Forecast by End Use, 2019 to 2034

Table 48: Middle East and Africa Market Volume (Units) Forecast by End Use, 2019 to 2034
Sabyasachi Ghosh
Sabyasachi Ghosh

Principal Consultant

Talk to Analyst

Find your sweet spots for generating winning opportunities in this market.

List of Charts

Figure 1: Global Market Value (US$ Million) by Product Type, 2024 to 2034

Figure 2: Global Market Value (US$ Million) by End Use, 2024 to 2034

Figure 3: Global Market Value (US$ Million) by Region, 2024 to 2034

Figure 4: Global Market Value (US$ Million) Analysis by Region, 2019 to 2034

Figure 5: Global Market Volume (Units) Analysis by Region, 2019 to 2034

Figure 6: Global Market Value Share (%) and BPS Analysis by Region, 2024 to 2034

Figure 7: Global Market Y-o-Y Growth (%) Projections by Region, 2024 to 2034

Figure 8: Global Market Value (US$ Million) Analysis by Product Type, 2019 to 2034

Figure 9: Global Market Volume (Units) Analysis by Product Type, 2019 to 2034

Figure 10: Global Market Value Share (%) and BPS Analysis by Product Type, 2024 to 2034

Figure 11: Global Market Y-o-Y Growth (%) Projections by Product Type, 2024 to 2034

Figure 12: Global Market Value (US$ Million) Analysis by End Use, 2019 to 2034

Figure 13: Global Market Volume (Units) Analysis by End Use, 2019 to 2034

Figure 14: Global Market Value Share (%) and BPS Analysis by End Use, 2024 to 2034

Figure 15: Global Market Y-o-Y Growth (%) Projections by End Use, 2024 to 2034

Figure 16: Global Market Attractiveness by Product Type, 2024 to 2034

Figure 17: Global Market Attractiveness by End Use, 2024 to 2034

Figure 18: Global Market Attractiveness by Region, 2024 to 2034

Figure 19: North America Market Value (US$ Million) by Product Type, 2024 to 2034

Figure 20: North America Market Value (US$ Million) by End Use, 2024 to 2034

Figure 21: North America Market Value (US$ Million) by Country, 2024 to 2034

Figure 22: North America Market Value (US$ Million) Analysis by Country, 2019 to 2034

Figure 23: North America Market Volume (Units) Analysis by Country, 2019 to 2034

Figure 24: North America Market Value Share (%) and BPS Analysis by Country, 2024 to 2034

Figure 25: North America Market Y-o-Y Growth (%) Projections by Country, 2024 to 2034

Figure 26: North America Market Value (US$ Million) Analysis by Product Type, 2019 to 2034

Figure 27: North America Market Volume (Units) Analysis by Product Type, 2019 to 2034

Figure 28: North America Market Value Share (%) and BPS Analysis by Product Type, 2024 to 2034

Figure 29: North America Market Y-o-Y Growth (%) Projections by Product Type, 2024 to 2034

Figure 30: North America Market Value (US$ Million) Analysis by End Use, 2019 to 2034

Figure 31: North America Market Volume (Units) Analysis by End Use, 2019 to 2034

Figure 32: North America Market Value Share (%) and BPS Analysis by End Use, 2024 to 2034

Figure 33: North America Market Y-o-Y Growth (%) Projections by End Use, 2024 to 2034

Figure 34: North America Market Attractiveness by Product Type, 2024 to 2034

Figure 35: North America Market Attractiveness by End Use, 2024 to 2034

Figure 36: North America Market Attractiveness by Country, 2024 to 2034

Figure 37: Latin America Market Value (US$ Million) by Product Type, 2024 to 2034

Figure 38: Latin America Market Value (US$ Million) by End Use, 2024 to 2034

Figure 39: Latin America Market Value (US$ Million) by Country, 2024 to 2034

Figure 40: Latin America Market Value (US$ Million) Analysis by Country, 2019 to 2034

Figure 41: Latin America Market Volume (Units) Analysis by Country, 2019 to 2034

Figure 42: Latin America Market Value Share (%) and BPS Analysis by Country, 2024 to 2034

Figure 43: Latin America Market Y-o-Y Growth (%) Projections by Country, 2024 to 2034

Figure 44: Latin America Market Value (US$ Million) Analysis by Product Type, 2019 to 2034

Figure 45: Latin America Market Volume (Units) Analysis by Product Type, 2019 to 2034

Figure 46: Latin America Market Value Share (%) and BPS Analysis by Product Type, 2024 to 2034

Figure 47: Latin America Market Y-o-Y Growth (%) Projections by Product Type, 2024 to 2034

Figure 48: Latin America Market Value (US$ Million) Analysis by End Use, 2019 to 2034

Figure 49: Latin America Market Volume (Units) Analysis by End Use, 2019 to 2034

Figure 50: Latin America Market Value Share (%) and BPS Analysis by End Use, 2024 to 2034

Figure 51: Latin America Market Y-o-Y Growth (%) Projections by End Use, 2024 to 2034

Figure 52: Latin America Market Attractiveness by Product Type, 2024 to 2034

Figure 53: Latin America Market Attractiveness by End Use, 2024 to 2034

Figure 54: Latin America Market Attractiveness by Country, 2024 to 2034

Figure 55: Western Europe Market Value (US$ Million) by Product Type, 2024 to 2034

Figure 56: Western Europe Market Value (US$ Million) by End Use, 2024 to 2034

Figure 57: Western Europe Market Value (US$ Million) by Country, 2024 to 2034

Figure 58: Western Europe Market Value (US$ Million) Analysis by Country, 2019 to 2034

Figure 59: Western Europe Market Volume (Units) Analysis by Country, 2019 to 2034

Figure 60: Western Europe Market Value Share (%) and BPS Analysis by Country, 2024 to 2034

Figure 61: Western Europe Market Y-o-Y Growth (%) Projections by Country, 2024 to 2034

Figure 62: Western Europe Market Value (US$ Million) Analysis by Product Type, 2019 to 2034

Figure 63: Western Europe Market Volume (Units) Analysis by Product Type, 2019 to 2034

Figure 64: Western Europe Market Value Share (%) and BPS Analysis by Product Type, 2024 to 2034

Figure 65: Western Europe Market Y-o-Y Growth (%) Projections by Product Type, 2024 to 2034

Figure 66: Western Europe Market Value (US$ Million) Analysis by End Use, 2019 to 2034

Figure 67: Western Europe Market Volume (Units) Analysis by End Use, 2019 to 2034

Figure 68: Western Europe Market Value Share (%) and BPS Analysis by End Use, 2024 to 2034

Figure 69: Western Europe Market Y-o-Y Growth (%) Projections by End Use, 2024 to 2034

Figure 70: Western Europe Market Attractiveness by Product Type, 2024 to 2034

Figure 71: Western Europe Market Attractiveness by End Use, 2024 to 2034

Figure 72: Western Europe Market Attractiveness by Country, 2024 to 2034

Figure 73: Eastern Europe Market Value (US$ Million) by Product Type, 2024 to 2034

Figure 74: Eastern Europe Market Value (US$ Million) by End Use, 2024 to 2034

Figure 75: Eastern Europe Market Value (US$ Million) by Country, 2024 to 2034

Figure 76: Eastern Europe Market Value (US$ Million) Analysis by Country, 2019 to 2034

Figure 77: Eastern Europe Market Volume (Units) Analysis by Country, 2019 to 2034

Figure 78: Eastern Europe Market Value Share (%) and BPS Analysis by Country, 2024 to 2034

Figure 79: Eastern Europe Market Y-o-Y Growth (%) Projections by Country, 2024 to 2034

Figure 80: Eastern Europe Market Value (US$ Million) Analysis by Product Type, 2019 to 2034

Figure 81: Eastern Europe Market Volume (Units) Analysis by Product Type, 2019 to 2034

Figure 82: Eastern Europe Market Value Share (%) and BPS Analysis by Product Type, 2024 to 2034

Figure 83: Eastern Europe Market Y-o-Y Growth (%) Projections by Product Type, 2024 to 2034

Figure 84: Eastern Europe Market Value (US$ Million) Analysis by End Use, 2019 to 2034

Figure 85: Eastern Europe Market Volume (Units) Analysis by End Use, 2019 to 2034

Figure 86: Eastern Europe Market Value Share (%) and BPS Analysis by End Use, 2024 to 2034

Figure 87: Eastern Europe Market Y-o-Y Growth (%) Projections by End Use, 2024 to 2034

Figure 88: Eastern Europe Market Attractiveness by Product Type, 2024 to 2034

Figure 89: Eastern Europe Market Attractiveness by End Use, 2024 to 2034

Figure 90: Eastern Europe Market Attractiveness by Country, 2024 to 2034

Figure 91: South Asia and Pacific Market Value (US$ Million) by Product Type, 2024 to 2034

Figure 92: South Asia and Pacific Market Value (US$ Million) by End Use, 2024 to 2034

Figure 93: South Asia and Pacific Market Value (US$ Million) by Country, 2024 to 2034

Figure 94: South Asia and Pacific Market Value (US$ Million) Analysis by Country, 2019 to 2034

Figure 95: South Asia and Pacific Market Volume (Units) Analysis by Country, 2019 to 2034

Figure 96: South Asia and Pacific Market Value Share (%) and BPS Analysis by Country, 2024 to 2034

Figure 97: South Asia and Pacific Market Y-o-Y Growth (%) Projections by Country, 2024 to 2034

Figure 98: South Asia and Pacific Market Value (US$ Million) Analysis by Product Type, 2019 to 2034

Figure 99: South Asia and Pacific Market Volume (Units) Analysis by Product Type, 2019 to 2034

Figure 100: South Asia and Pacific Market Value Share (%) and BPS Analysis by Product Type, 2024 to 2034

Figure 101: South Asia and Pacific Market Y-o-Y Growth (%) Projections by Product Type, 2024 to 2034

Figure 102: South Asia and Pacific Market Value (US$ Million) Analysis by End Use, 2019 to 2034

Figure 103: South Asia and Pacific Market Volume (Units) Analysis by End Use, 2019 to 2034

Figure 104: South Asia and Pacific Market Value Share (%) and BPS Analysis by End Use, 2024 to 2034

Figure 105: South Asia and Pacific Market Y-o-Y Growth (%) Projections by End Use, 2024 to 2034

Figure 106: South Asia and Pacific Market Attractiveness by Product Type, 2024 to 2034

Figure 107: South Asia and Pacific Market Attractiveness by End Use, 2024 to 2034

Figure 108: South Asia and Pacific Market Attractiveness by Country, 2024 to 2034

Figure 109: East Asia Market Value (US$ Million) by Product Type, 2024 to 2034

Figure 110: East Asia Market Value (US$ Million) by End Use, 2024 to 2034

Figure 111: East Asia Market Value (US$ Million) by Country, 2024 to 2034

Figure 112: East Asia Market Value (US$ Million) Analysis by Country, 2019 to 2034

Figure 113: East Asia Market Volume (Units) Analysis by Country, 2019 to 2034

Figure 114: East Asia Market Value Share (%) and BPS Analysis by Country, 2024 to 2034

Figure 115: East Asia Market Y-o-Y Growth (%) Projections by Country, 2024 to 2034

Figure 116: East Asia Market Value (US$ Million) Analysis by Product Type, 2019 to 2034

Figure 117: East Asia Market Volume (Units) Analysis by Product Type, 2019 to 2034

Figure 118: East Asia Market Value Share (%) and BPS Analysis by Product Type, 2024 to 2034

Figure 119: East Asia Market Y-o-Y Growth (%) Projections by Product Type, 2024 to 2034

Figure 120: East Asia Market Value (US$ Million) Analysis by End Use, 2019 to 2034

Figure 121: East Asia Market Volume (Units) Analysis by End Use, 2019 to 2034

Figure 122: East Asia Market Value Share (%) and BPS Analysis by End Use, 2024 to 2034

Figure 123: East Asia Market Y-o-Y Growth (%) Projections by End Use, 2024 to 2034

Figure 124: East Asia Market Attractiveness by Product Type, 2024 to 2034

Figure 125: East Asia Market Attractiveness by End Use, 2024 to 2034

Figure 126: East Asia Market Attractiveness by Country, 2024 to 2034

Figure 127: Middle East and Africa Market Value (US$ Million) by Product Type, 2024 to 2034

Figure 128: Middle East and Africa Market Value (US$ Million) by End Use, 2024 to 2034

Figure 129: Middle East and Africa Market Value (US$ Million) by Country, 2024 to 2034

Figure 130: Middle East and Africa Market Value (US$ Million) Analysis by Country, 2019 to 2034

Figure 131: Middle East and Africa Market Volume (Units) Analysis by Country, 2019 to 2034

Figure 132: Middle East and Africa Market Value Share (%) and BPS Analysis by Country, 2024 to 2034

Figure 133: Middle East and Africa Market Y-o-Y Growth (%) Projections by Country, 2024 to 2034

Figure 134: Middle East and Africa Market Value (US$ Million) Analysis by Product Type, 2019 to 2034

Figure 135: Middle East and Africa Market Volume (Units) Analysis by Product Type, 2019 to 2034

Figure 136: Middle East and Africa Market Value Share (%) and BPS Analysis by Product Type, 2024 to 2034

Figure 137: Middle East and Africa Market Y-o-Y Growth (%) Projections by Product Type, 2024 to 2034

Figure 138: Middle East and Africa Market Value (US$ Million) Analysis by End Use, 2019 to 2034

Figure 139: Middle East and Africa Market Volume (Units) Analysis by End Use, 2019 to 2034

Figure 140: Middle East and Africa Market Value Share (%) and BPS Analysis by End Use, 2024 to 2034

Figure 141: Middle East and Africa Market Y-o-Y Growth (%) Projections by End Use, 2024 to 2034

Figure 142: Middle East and Africa Market Attractiveness by Product Type, 2024 to 2034

Figure 143: Middle East and Africa Market Attractiveness by End Use, 2024 to 2034

Figure 144: Middle East and Africa Market Attractiveness by Country, 2024 to 2034

Recommendations

Consumer Product

Incontinence Care Products Market

Published : February 2024

Healthcare

Pelvic Floor Stimulators Market

Published : June 2023

Healthcare

Urinary Collection Device Market

Published : December 2022

Healthcare

Nephrology and Urology Incontinence Devices Market

Published : June 2022

Explore Healthcare Insights

View Reports

Female Stress Urinary Incontinence Treatment Device Market