

- Market Size (2026)
- USD 285.0 Mn
- Forecast (2036)
- USD 712.8 Mn
- CAGR (2026 to 2036)
- 9.6%
How big is Fiber-Based Closures & Caps Market in 2026?
USD 285.0 million in 2026 and USD 712.8 million by 2036 at a 9.6% CAGR.
Demand for fiber-based closures and caps is projected to expand at 9.6% CAGR between 2026 and 2036. Market value is estimated to rise from USD 285.0 million in 2026 to USD 712.8 million by 2036. Closures often remain the most visible plastic element on paper bottles and cartons, making them a natural focus for sustainability initiatives. Replacing plastic is not straightforward, the challenge is significant given the scale of the existing market, with USA plastic closure imports reaching USD 1.561 billion in 2024. Fiber-based alternatives must therefore match the sealing performance and ease of use that brand owners and consumers already expect.
Adoption trends vary by region, largely reflecting differences in manufacturing capabilities and commercialization support. China benefits from extensive converter capacity, allowing brands to move more quickly from product development to filling-line testing. This manufacturing strength is reflected in the country's USD 2.106 billion in plastic closure exports during 2024, highlighting the scale of the market that fiber-based solutions aim to penetrate. In Europe, innovation is being driven through collaboration. Sweden-based Blue Ocean Closures is supporting local brand trials, while organizations such as PA Consulting and PulPac are helping UK-based programs advance fiber-forming technologies from development to production scale.
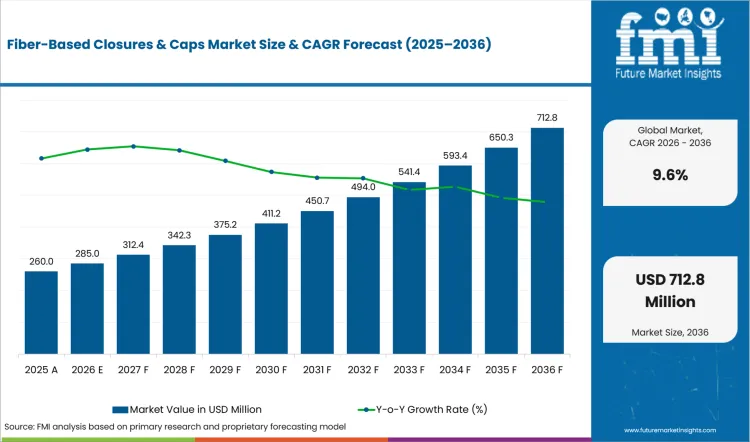
| Metric | Value |
|---|---|
| 2025 Market Size | USD 260.0 million |
| 2026 Market Size | USD 285 million |
| 2036 Market Size | USD 712.8 million |
| Forecast CAGR (2026 to 2036) | 9.6% |
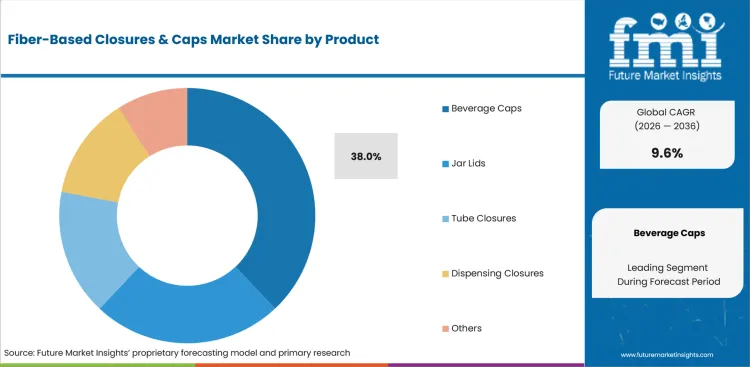
| Product Focus | Beverage Caps (38.0% share in 2026) |
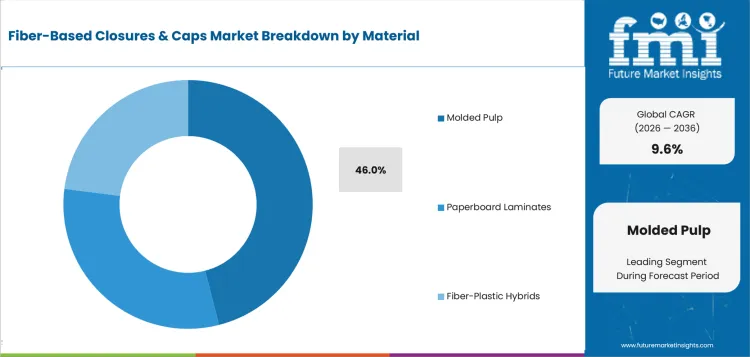
| Material Focus | Molded Pulp (46.0% share in 2026) |
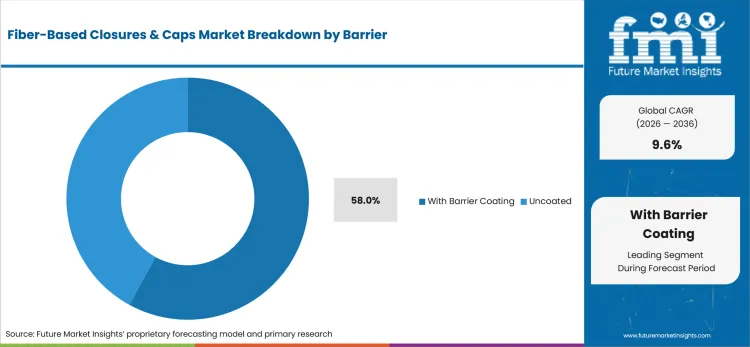
| Barrier Focus | With Barrier Coating (58.0% share in 2026) |
Summary of the Fiber-Based Closures & Caps Market
| Market Signal | Commercial Impact |
|---|---|
| Demand and Growth Drivers | Brand owners are testing fiber closures after reducing plastic across paper bottles and beverage cartons in several product programs. Commercial approval depends on sealing performance across installed capping equipment during routine production trials and planned storage.
|
| Product and Segment View | Beverage caps are emerging as an important early application for fiber-based closures because they are used frequently and remain highly visible to consumers. Success in this segment can help demonstrate that fiber closures can deliver performance levels comparable to traditional plastic caps.
|
| Geography and Growth Outlook | Regional adoption is being shaped by differences in manufacturing capabilities, testing requirements, and local innovation ecosystems. Countries offering strong development support and production expertise are moving notably from trials to commercial deployment.
|
| Competitive Landscape | Competition in the industry revolves around technology performance rather than company size. Suppliers are focusing on design, material innovation, and production compatibility to improve the commercial viability of fiber closures up.
|
| Analyst Perspective | The biggest challenge is ensuring that the fiber produced works reliably on equipment designed around plastic components. Commercial success depends on whether fiber closures can maintain sealing performance and production efficiency under real operating conditions.
|
Source: FMI's proprietary forecasting model and primary research
How is the fiber-based closures & caps market segmented?
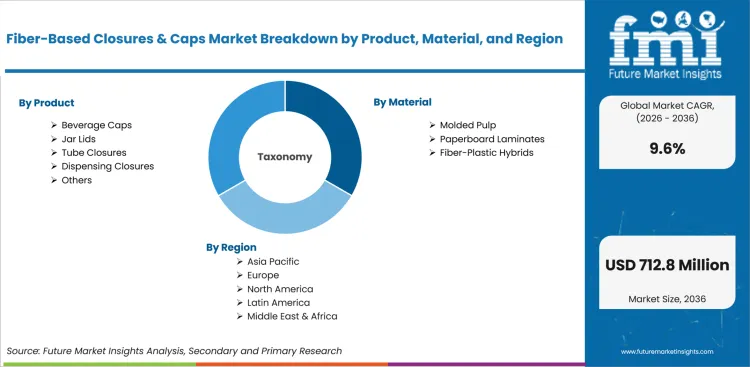
The fiber-based closures & caps industry is segmented by product, material, barrier, end use, sales channel, and region.
Product analysis covers beverage caps, jar lids, tube closures, dispensing closures, and other formats. Material analysis separates molded pulp, paperboard laminates, and fiber-plastic hybrids used across commercial cap structures. Barrier analysis distinguishes coated formats from uncoated closures under moisture and product-contact conditions during shelf-life qualification. End-use coverage includes food and beverage, cosmetics and personal care, household products, and pharmaceuticals. Sales channels include direct business contracts and distributors that manage regional order fulfillment for recurring customer programs. Regional coverage spans North America, Latin America, Europe, East Asia, South Asia and Pacific, Oceania, and the Middle East and Africa.
What supports demand for beverage caps within the product category?
Carton beverage programs expose closures to internal pressure and repeated opening during routine consumer use. Elopak invested in Blue Ocean Closures during March 2025 and secured rights to use its fiber caps on gable-top cartons. The agreement connects cap design with filling equipment and established beverage formats used across commercial programs. Fillers judge each cap by leak control and opening force at commercial line speed.
- By product category, beverage caps are forecast to represent 38.0% in 2026 because drink formats combine frequent use with demanding seal requirements. Fillers test torque retention after storage and distribution before approving a new closure for recurring production. A failed thread or pressure leak places the full package conversion at risk during recurring retail production.
- Beverage fillers are increasingly purchasing fiber cap trials led by public plastic-reduction commitments and package redesign programs. Each project aligns the cap with paper bottle formats and current capping equipment before commercial testing begins. Orders are projected to expand after applicator trials confirm reliable feeding across planned production speeds and storage periods.
How is molded pulp positioned within the material category?
Thread geometry determines whether molded pulp leaves the press with accurate sealing surfaces and repeatable wall thickness. Blue Ocean Closures reported shorter production cycles during October 2025 after refining its forming process. Shorter cycles improve the economics of commercial cap output but do not remove tolerance risk.
- By material, molded pulp is estimated to hold 46.0% in 2026 owing to its fit with rigid cap shapes and pressed-fiber forming. The material supports detailed geometry without a thick plastic body inside the finished closure structure. Commercial acceptance depends on consistent edges and threads because small defects interrupt applicator feeding during repeat production runs.
- Purchase activity for molded pulp closures is anticipated to rise driven by dry-forming processes that use compact tooling and familiar cellulose inputs. Developers test moisture control and release behavior before scaling output across commercial forming lines worldwide. Machine partnerships help fiber specialists connect forming speed with molded fiber pulp packaging requirements across customer bottle and jar programs in commercial production environments.
How does barrier coating shape demand within the barrier category?
Moisture exposure changes fiber dimensions at the thread and sealing surface during storage under changing warehouse humidity. Great Earth expanded the paper cap from Blue Ocean Closures across its supplement range during September 2025 after an earlier magnesium product pilot. Supplement formats expose closures to long storage periods where coating performance protects thread accuracy.
- In 2026, barrier-coated formats are expected to lead the barrier category with 58.0% share because coatings protect dimensional stability during product contact. The added layer must preserve thread accuracy after humidity exposure throughout customer shelf-life testing programs.
- Packaging teams are expected to favor barrier-coated closures over uncoated alternatives due to lower moisture risk across beverages and personal care products. Qualification remains demanding because the coating cannot weaken sealing or recycling claims during trials at customer plants. Successful designs support lower-plastic bottle designs without changing consumer opening behavior or line setup during commercial production.
What are the drivers, restraints, and opportunities in the fiber-based closures & caps market?
Brand conversion programs are projected to drive trials, moisture sensitivity is expected to delay approval, and installed-line compatibility is anticipated to create the clearest commercial opening.
- Driver: Brand conversion programs are projected to create trial demand after other plastic components are removed from paper bottles and cartons.
- Restraint: Moisture sensitivity is expected to extend qualification because dimensional drift can disrupt sealing and applicator feeding during commercial production.
- Opportunity: Installed-line compatibility is anticipated to create commercial openings where customers seek lower-plastic formats without replacing closure equipment.
Brand sustainability commitments are encouraging companies to evaluate fiber-based closures, and commercial adoption ultimately depends on production-line performance. Fiber alternatives are entering a mature market where plastic closures already benefit from established supply chains and proven reliability. This creates a high performance benchmark for new entrants, especially in beverage and supplement packaging where brands typically assess torque retention and filling-line compatibility before expanding trials. With European Union plastic closure imports reaching USD 1.028 billion in 2024, suppliers must demonstrate that fiber closures can protect product quality and maintain operational efficiency before securing repeat orders.
Moisture exposure remains one of the biggest barriers to wider adoption. Even minor dimensional changes can affect sealing performance, thread engagement and applicator efficiency during high-volume production. Companies are therefore investing in barrier technologies that protect the fiber structure while maintaining compatibility with paper recovery streams. The challenge is that changes intended to improve moisture resistance can also influence torque performance and sealing pressure, often extending qualification timelines and increasing development costs through multiple redesign cycles.
The strongest commercial opportunity lies in solutions that fit existing production infrastructure without requiring extensive equipment modifications. This advantage is becoming increasingly relevant as companies look for ways to reduce plastic use while maintaining operational continuity. Regulatory developments such as Regulation (EU) 2025/40 are reinforcing interest in recyclable packaging formats, while commercial examples are beginning to emerge. Live Puri's selection of Blue Ocean Closures' NutraCap for its vitamin range demonstrates how suppliers that can prove compatibility with existing applicators and packaging operations may be able to accelerate customer adoption and shorten conversion timelines.
Which country CAGRs are profiled in the fiber-based closures & caps market?
.webp "Top Country Growth Comparison Fiber Based Closures And Caps Market Cagr (2026 2036)")
| Country | CAGR |
|---|---|
| United States | 8.7% |
| Germany | 10.2% |
| United Kingdom | 9.8% |
| France | 9.1% |
| Sweden | 11.3% |
| Japan | 7.9% |
| China | 10.8% |
Source: FMI's proprietary forecasting model and primary research
How do country-level CAGRs compare in the fiber-based closures & caps market?
Country-level growth is determined by how quickly fiber closures can move from prototype development to commercial approval. Sweden benefits from close collaboration between closure developers and brand owners, helping accelerate testing and product refinement. China's extensive converting capacity supports faster transitions from cap forming to filling-line evaluation. In contrast, Germany and France place greater emphasis on recyclability claims and shelf-life validation during supplier qualification, whereas USA packaging companies prioritize applicator performance and production-line efficiency before approving new closure formats.
- The United States remains a performance-based sector where production efficiency often carries more weight than sustainability claims. Demand for fiber-based closures is expected to expand at a CAGR of 8.7% through 2036 as brands evaluate alternatives that can run on existing capping systems. USA plastic closure exports reached USD 936.98 million in 2024, highlighting the scale of the incumbent market that fiber solutions must challenge. As a result, packaging teams focus heavily on applicator fit, sealing reliability, and line-speed performance before approving broader adoption.
- German buyers typically look for proven performance before committing to a new packaging format. The market is projected to grow at a CAGR of 10.2% between 2026 and 2036, supported by sustainability targets and strong packaging engineering capabilities. Germany exported USD 1.221 billion worth of plastic closures in 2024, reflecting the high technical benchmark fiber-based alternatives must meet. Suppliers that provide strong documentation around recyclability, coating stability, and shelf-life performance are often better positioned during qualification.
- The United Kingdom is emerging as an important testing ground for fiber-based closure technologies. Demand is forecast to increase at a CAGR of 9.8% during the forecast period as brands pursue plastic-reduction goals while maintaining packaging performance. The country's USD 390.49 million in plastic closure imports during 2024 highlights the commercial opportunity available to successful alternatives. Support from organizations such as PA Consulting and PulPac is helping accelerate development and commercial trials.
- Consumer experience plays a major role in packaging decisions across France. The market is expected to expand at a CAGR of 9.1% from 2026 to 2036, driven by packaging redesign initiatives in food, beverage, and personal care applications. French plastic closure exports reached USD 822.89 million in 2024, demonstrating the scale of the established market that fiber solutions aim to penetrate. Brands continue to evaluate opening feel, surface quality, and packaging appearance alongside sustainability credentials.
- Sweden stands out as one of the innovation hubs for fiber-based closures. Sales in the industry are projected to rise at a CAGR of 11.3% over the forecast period, supported by close collaboration between technology developers, converters, and brand owners. While Swedish plastic closure exports totaled USD 95.01 million in 2024, companies such as Blue Ocean Closures and PulPac are helping accelerate the development of paper-based alternatives. This local ecosystem allows packaging teams to move more quickly from concept validation to commercial testing.
- Precision and consistency remain central to packaging qualification in Japan. Demand for fiber-based closure and caps is anticipated to grow at a CAGR of 7.9% from 2026 to 2036 as manufacturers gradually evaluate fiber-based closure technologies. Plastic closure imports reached USD 202.29 million in 2024, reflecting a market that places significant emphasis on quality standards and product reliability. Packaging companies typically conduct extensive testing before approving changes to established closure specifications.
- China's competitive advantage lies in its ability to move rapidly from development to commercialization. The market is forecast to expand at a CAGR of 10.8% through 2036, supported by extensive manufacturing capacity and strong packaging supply chains. Plastic closure imports totaled USD 153.69 million in 2024, while the country's broader production ecosystem provides suppliers with fast access to tooling, testing, and filling-line evaluation. This combination of scale and speed is helping accelerate fiber-closure development, although suppliers still face intense cost competition.
Who are the notable companies in the fiber-based closures & caps market?
Blue Ocean Closures, PulPac, SIG, Elopak, Neopac, AISA, PA Consulting, and OPTIMA Packaging Group are the notable companies shaping this market.
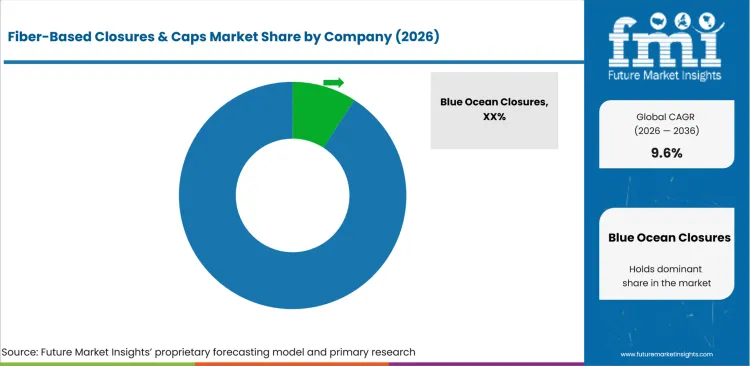
The market connects closure developers with fiber-forming specialists and packaging-system partners during each commercial program. A screw cap must match thread geometry and barrier needs before production engineers approve a filling-line trial. Specialist developers depend on material suppliers and equipment partners during tooling work and scale-up. System companies contribute applicator knowledge while engineering firms test forming speed and closure performance. Competitive review centers on sealing reliability and production support instead of broad company size. Pharmaceutical closure requirements add further pressure because packaging teams expect traceable materials and stable performance across repeated lots.
- Blue Ocean Closures and PulPac use distinct fiber-forming routes that target repeatable cap geometry. Blue Ocean Closures emphasizes pressed-fiber screw caps for supplements and beverages that preserve familiar opening behavior. PulPac applies Dry Molded Fiber technology with machine partners that support production-scale development across bottle and carton programs.
- SIG and Elopak connect closure development with installed beverage packaging systems used by major beverage brands. SIG contributes applicator knowledge for aseptic carton lines while Elopak links fiber cap trials with gable-top cartons. Their advantage depends on proving that new closures feed and seal without replacing established filling equipment.
- Neopac and AISA address tube formats using a fiber-based shoulder and closure developed for PaperX FiberTop. Neopac provides tube design and market access while AISA supplies SAESA production technology for package programs at customer plants. The pair competes on integration between material structure and commercial tube-forming equipment during repeated commercial production trials.
- PA Consulting and OPTIMA Packaging Group support the route from prototype tooling to industrial production. PA Consulting tests Dry Molded Fiber applications and customer use cases across development programs for customers. OPTIMA Packaging Group develops machinery for bottle packaging systems where filling accuracy and barrier integration determine commercial readiness.
Competitive Benchmarking: Fiber-Based Closures & Caps Market
| Company | Closure market relevance | Fiber development capability | Packaging-line support | Service reach |
|---|---|---|---|---|
| Blue Ocean Closures | High | High | High | Europe / Regional |
| PulPac | High | High | High | Global |
| SIG | High | Medium | High | Global |
| Elopak | Medium | Low | High | Global |
| Neopac | Medium | Medium | High | Europe, North America, and India / Regional |
| AISA | Medium | Low | High | Europe, South America, and India / Regional |
| PA Consulting | Medium | Medium | High | Global |
| OPTIMA Packaging Group | Medium | Medium | High | Global |
Scoring basis: High indicates substantial direct capability in the stated dimension. Medium indicates relevant but partial or indirect capability. Low indicates limited direct evidence for the stated dimension.
Source: Future Market Insights competitive analysis, 2026. Ratings reflect relative portfolio relevance and workflow fit. Service capability and geographic reach shape the remaining comparison.
Key Developments in the Fiber-Based Closures & Caps Market
- In June 2026, Blue Ocean Closures, introduced Paper-Plug as an integrated fiber opening concept for future paper bottles. The design combines a molded opening and plug with paper bottle development so brands can test a complete fiber-based system without a separate plastic neck finish; its wider role extends the work of Blue Ocean Closures beyond screw caps and reflects demand for components entering a common paper recovery route.
- In March 2026, PulPac, introduced a new generation of fiber caps for interpack 2026 after testing thread engagement and opening performance with development partners. The program extends Dry Molded Fiber into a demanding closure component and gives brands a route to evaluate production-scale caps with machine partners across integrated bottle systems before committing to wider commercial trials on established packaging lines.
- In July 2025, SIG, entered an exclusive partnership with PulPac to develop paper-based closure bases and caps for aseptic cartons. The planned use on existing filling machines and closure applicators links Dry Molded Fiber with an installed packaging platform and reflects demand for lower-plastic formats that preserve familiar customer operations across beverage programs during early production qualification at commercial scale across customer lines.
- In September 2025, Neopac, introduced PaperX FiberTop with a fiber-based body and closure developed alongside AISA and Blue Ocean Closures. The pilot connects tube design with SAESA production technology around a thin barrier structure and gives brands a commercial forming route before they approve cosmetic and oral-care applications across premium retail programs in several markets during practical qualification on established production lines.
Key Players in the Fiber-Based Closures & Caps Market
Fiber closure and forming developers
- Blue Ocean Closures
- PulPac
Beverage package system partners
- SIG
- Elopak
Tube and industrialization partners
- Neopac
- AISA
- PA Consulting
- OPTIMA Packaging Group
Fiber-Based Closures & Caps Market - Report Scope
| Coverage field | Report scope |
|---|---|
| Market breakdown | Product, material, barrier, end use, sales channel, country, and region |
| Quantitative Units | Revenue in USD million, market share in percentage terms, and CAGR in percentage terms |
| Market Definition | Fiber-based closures and caps designed to replace or reduce conventional plastic closure bodies across bottles, cartons, jars, tubes, and dispensing packs. |
| Regions Covered | North America, Latin America, Europe, East Asia, South Asia and Pacific, Oceania, and the Middle East and Africa |
| Countries Covered | United States, Germany, United Kingdom, France, Sweden, Japan, China, and 20+ additional countries |
| Key Companies Profiled | Blue Ocean Closures, PulPac, SIG, Elopak, Neopac, AISA, PA Consulting, and OPTIMA Packaging Group |
| Forecast Period | 2026 to 2036 |
| Approach | Hybrid bottom-up and top-down analysis using primary interviews, official evidence, segment reconciliation, and proprietary forecast modeling |
Source: Future Market Insights - analysis driven by proprietary forecasting models and primary research
Fiber-Based Closures & Caps Market - Research Methodology
| Method | Approach |
|---|---|
| Primary Research | Interviews with fiber closure developers and dry-forming specialists examine tooling limits and thread design under commercial production conditions. Packaging engineers and filling-line operators explain neck fit and applicator behavior across planned speeds. Brand packaging teams describe approval criteria for beverage and supplement formats before broader conversion. Regional service partners explain response times and order patterns that affect the route from prototype work to routine supply. |
| Desk Research | Official company pages establish active closure programs and the production partnerships supporting commercial scale-up. Government trade records measure plastic closure flows and provide an incumbent benchmark for each profiled country. European packaging regulation defines the context for recyclability and material reduction. Technical product pages and machine information support assessments of forming speed and equipment fit across active fiber closure programs. |
| Market Sizing and Forecasting | The model begins with verified market values for 2025 and 2026 before calculating the ten-year forecast. Product and material shares are reconciled against closure use cases and confirmed company activity. Country forecasts reflect packaging conversion pressure and access to forming support or filling-line engineering. |
| Data Validation | Demand indicators cover brand conversion programs and filling-line requirements that determine whether closure trials reach recurring orders. Supply indicators examine forming capability and applicator compatibility across closure developers and package-system partners. Primary interviews test whether published capabilities match production conditions and whether local support changes approval time. |
Source: Future Market Insights (FMI) analysis, based on proprietary forecasting model and primary research
Fiber-Based Closures & Caps Market by Segments
Fiber-Based Closures & Caps Market segmented by Product:
- Beverage caps
- Jar lids
- Tube closures
- Dispensing closures
- Others
Fiber-Based Closures & Caps Market segmented by Material:
- Molded pulp
- Paperboard laminates
- Fiber-plastic hybrids
Fiber-Based Closures & Caps Market segmented by Barrier:
- With barrier coating
- Uncoated
Fiber-Based Closures & Caps Market segmented by End Use:
- Food and beverage
- Cosmetics and personal care
- Household
- Pharmaceutical
Fiber-Based Closures & Caps Market segmented by Sales Channel:
- B2B direct
- Distributors
Fiber-Based Closures & Caps Market by Region:
- North America
- United States
- Canada
- Latin America
- Brazil
- Mexico
- Rest of Latin America
- Europe
- Germany
- United Kingdom
- France
- Sweden
- Italy
- Spain
- Rest of Europe
- East Asia
- China
- Japan
- South Korea
- South Asia and Pacific
- India
- ASEAN
- Rest of South Asia and Pacific
- Oceania
- Australia
- New Zealand
- Middle East and Africa
- GCC Countries
- South Africa
- Rest of Middle East and Africa
Research Sources and Bibliography
- Blue Ocean Closures. (2026, June 25). Launch of Paper-Plug: A new opening concept. Blue Ocean Closures.
- Blue Ocean Closures. (2026, February 6). Live Puri replaces metal closures with fiber-based NutraCap. Blue Ocean Closures.
- Blue Ocean Closures. (2025, October 15). Breakthrough: Fiber screw caps on a trajectory towards equal or lower in cost than fossil plastic. Blue Ocean Closures.
- Blue Ocean Closures. (2025, September 18). Great Earth shifts entire product range to paper closures. Blue Ocean Closures.
- Blue Ocean Closures. (2025, March 25). Elopak invests in Blue Ocean Closures. Blue Ocean Closures.
- Blue Ocean Closures. (2025, January 29). Nissha invests in Blue Ocean Closures AB. Blue Ocean Closures.
- PulPac. (2026, March 30). PulPac advances fiber closures and unveils plastic-like caps. PulPac.
- SIG. (2025, July 22). SIG and PulPac enter strategic partnership to unlock the potential of Dry Molded Fiber for large-scale production of paper-based closures. SIG.
- Neopac. (2025, September 17). Neopac unveils world’s first paper tube designed for full recyclability in the paper stream at IFPC Congress 2025. Neopac.
- AISA. (2026). A fully recyclable paper tube produced on SAESA technology. AISA.
- PA Consulting. (2025, September 16). How cutting-edge start-ups go from lab to market. PA Consulting.
- OPTIMA Packaging Group. (2026). Fiber-based packaging. OPTIMA Packaging Group.
- European Parliament and Council of the European Union. (2025, January 22). Regulation (EU) 2025/40 on packaging and packaging waste. EUR-Lex.
- World Bank. (n.d.). Stoppers, lids, caps and other closures of plastics imports by country in 2024. World Integrated Trade Solution.
This bibliography is provided for reader reference and uses primary government, standards-body, official trade body, and company sources.
This Report Answers
- What are the 2026 and 2036 values for the fiber-based closures and caps market?
- What compound annual growth rate is forecast for fiber-based closures and caps from 2026 to 2036?
- Which product and material segments shape demand for fiber-based closures across bottles, cartons, jars, and tubes?
- Which technical pressures support adoption or delay approval across commercial filling-line operations?
- How do forecast country growth rates differ across the seven profiled markets?
- Which competitive dimensions distinguish closure developers from package-system and equipment partners?
- How does Future Market Insights validate market values and country forecasts for this developing closure category?
- What should procurement teams examine before approving a fiber closure supplier for commercial production?
- How do barrier claims and recycling requirements affect supplier selection across paper-based packaging programs?
Frequently Asked Questions
What is driving growth in the Fiber-Based Closures & Caps Market?
Brand owners seek closures that reduce plastic across paper bottles and cartons without changing package function. Growth depends on proven sealing performance and smooth operation across installed applicators during recurring commercial production runs.
Who are the key players in the Fiber-Based Closures & Caps Market?
Blue Ocean Closures and PulPac compete on fiber forming technology for bottle and carton applications. SIG and Elopak compete on packaging-system knowledge and applicator support during customer trials on established filling lines.
What is a notable restraint in the Fiber-Based Closures & Caps Market?
Moisture exposure changes fiber dimensions around threads and sealing surfaces during extended warehouse storage conditions. Suppliers need extended barrier and shelf-life tests before customers approve recurring orders across commercial programs.
Why should executives track the Fiber-Based Closures & Caps Market?
Executives should track this category because closures remain a visible plastic component after wider package redesign. Supplier choices affect recycling claims and future spending on filling-line changes across beverage and household formats.
What business problem does the Fiber-Based Closures & Caps Market address?
Fiber closures address plastic reduction without sacrificing familiar opening and closing performance across bottles and jars. They also support package designs intended for recovery in paper collection streams after consumer use.
What should procurement leaders evaluate before selecting suppliers?
Procurement leaders should evaluate torque retention and neck-finish accuracy across repeated production lots before final supplier approval. They should also review barrier performance and technical response during customer filling-line trials under planned storage conditions.
What limits return on investment for purchasers?
Frequent tooling changes and slow qualification extend the period before a fiber cap reaches routine production. Leaks and applicator jams erase expected savings and delay wider package conversion across additional customer lines.
How do suppliers build long-term account confidence?
Suppliers build confidence by documenting stable cap performance across repeated storage and production conditions over time. Local engineering support helps packaging teams resolve faults before expanding conversion across additional lines at customer plants.
Preview the report firsthand - request a free sample
Get SampleGet the brochure for pricing and purchase details.
Get PDFTable of Content
- Key Takeaways
- Market Size and CAGR
- Top Growth Driver
- Fastest Growing Segment
- Leading Region
- Key Companies
- Emerging Opportunities
- Executive Summary
- Global Market Outlook
- Demand-side Trends
- Supply-side Trends
- Technology Roadmap Analysis
- Analysis and Recommendations
- Analyst Perspective (What is happening? Why now? What should investors know?)
- Key Questions Answered
- How large is the market?
- What is the CAGR?
- What are key trends?
- Which region dominates?
- Who are the leaders?
- Market Overview
- Market Coverage / Taxonomy
- Market Definition / Scope / Limitations
- Research Methodology
- Chapter Orientation
- Analytical Lens and Working Hypotheses
- Market Structure, Signals, and Trend Drivers
- Benchmarking and Cross-market Comparability
- Market Sizing, Forecasting, and Opportunity Mapping
- Research Design and Evidence Framework
- Desk Research Programme (Secondary Evidence)
- Expert Input and Fieldwork (Primary Evidence)
- Tooling, Models, and Reference Databases
- Data Engineering and Model Build
- Quality Assurance and Audit Trail
- Market Background
- Market Dynamics (Drivers, Restraints, Opportunity, Trends)
- Scenario Forecast (Optimistic, Likely, Conservative)
- Impact Analysis
- AI Impact
- Sustainability Impact
- Regulatory Impact
- Technology Impact
- Consumer / Buyer Analysis
- Purchase Drivers
- Adoption Barriers
- Buyer Journey
- Opportunity Map Analysis
- Product Life Cycle Analysis
- Supply Chain Analysis
- Investment Feasibility Matrix
- Value Chain Analysis
- PESTLE and Porter's Analysis
- Regulatory Landscape
- Regional Parent Market Outlook
- Production and Consumption Statistics
- Import and Export Statistics
- Global Market Analysis and Forecast, 2021 to 2036
- Historical Market Size Value (USD Million) Analysis, 2021 to 2025
- Current and Future Market Size Value (USD Million) Projections, 2026 to 2036
- Y-o-Y Growth Trend Analysis
- Absolute $ Opportunity Analysis
- Global Market Pricing Analysis, 2021 to 2036
- Global Market Analysis and Forecast, By Product, 2021 to 2036
- Introduction / Key Findings
- Historical Market Size Value (USD Million) Analysis By Product, 2021 to 2025
- Current and Future Market Size Value (USD Million) Analysis and Forecast By Product, 2026 to 2036
- Beverage Caps
- Jar Lids
- Tube Closures
- Dispensing Closures
- Others
- Beverage Caps
- Y-o-Y Growth Trend Analysis By Product, 2021 to 2025
- Absolute $ Opportunity Analysis By Product, 2026 to 2036
- Global Market Analysis and Forecast, By Material, 2021 to 2036
- Introduction / Key Findings
- Historical Market Size Value (USD Million) Analysis By Material, 2021 to 2025
- Current and Future Market Size Value (USD Million) Analysis and Forecast By Material, 2026 to 2036
- Molded Pulp
- Paperboard Laminates
- Fiber-Plastic Hybrids
- Molded Pulp
- Y-o-Y Growth Trend Analysis By Material, 2021 to 2025
- Absolute $ Opportunity Analysis By Material, 2026 to 2036
- Global Market Analysis and Forecast, By Barrier, 2021 to 2036
- Introduction / Key Findings
- Historical Market Size Value (USD Million) Analysis By Barrier, 2021 to 2025
- Current and Future Market Size Value (USD Million) Analysis and Forecast By Barrier, 2026 to 2036
- With Barrier Coating
- Uncoated
- With Barrier Coating
- Y-o-Y Growth Trend Analysis By Barrier, 2021 to 2025
- Absolute $ Opportunity Analysis By Barrier, 2026 to 2036
- Global Market Analysis and Forecast, By End Use, 2021 to 2036
- Introduction / Key Findings
- Historical Market Size Value (USD Million) Analysis By End Use, 2021 to 2025
- Current and Future Market Size Value (USD Million) Analysis and Forecast By End Use, 2026 to 2036
- Food & Beverage
- Cosmetics & Personal Care
- Household
- Pharma
- Food & Beverage
- Y-o-Y Growth Trend Analysis By End Use, 2021 to 2025
- Absolute $ Opportunity Analysis By End Use, 2026 to 2036
- Global Market Analysis and Forecast, By Sales Channel, 2021 to 2036
- Introduction / Key Findings
- Historical Market Size Value (USD Million) Analysis By Sales Channel, 2021 to 2025
- Current and Future Market Size Value (USD Million) Analysis and Forecast By Sales Channel, 2026 to 2036
- B2B Direct
- Distributors
- B2B Direct
- Y-o-Y Growth Trend Analysis By Sales Channel, 2021 to 2025
- Absolute $ Opportunity Analysis By Sales Channel, 2026 to 2036
- Global Market Analysis and Forecast, By Region, 2021 to 2036
- Introduction
- Historical Market Size Value (USD Million) Analysis By Region, 2021 to 2025
- Current Market Size Value (USD Million) Analysis and Forecast By Region, 2026 to 2036
- North America
- Latin America
- Western Europe
- Eastern Europe
- East Asia
- South Asia and Pacific
- Middle East & Africa
- Market Attractiveness Analysis By Region
- North America Market Analysis and Forecast, By Country, 2021 to 2036
- Historical Market Size Value (USD Million) Trend Analysis By Market Taxonomy, 2021 to 2025
- Market Size Value (USD Million) Forecast By Market Taxonomy, 2026 to 2036
- By Country
- USA
- Canada
- By Product
- By Material
- By Barrier
- By End Use
- By Sales Channel
- By Country
- Market Attractiveness Analysis
- By Country
- By Product
- By Material
- By Barrier
- By End Use
- By Sales Channel
- Key Takeaways
- Latin America Market Analysis and Forecast, By Country
- Historical Market Size Value (USD Million) Trend Analysis By Market Taxonomy, 2021 to 2025
- Market Size Value (USD Million) Forecast By Market Taxonomy, 2026 to 2036
- By Country
- Brazil
- Mexico
- Chile
- Rest of Latin America
- By Product
- By Material
- By Barrier
- By End Use
- By Sales Channel
- By Country
- Market Attractiveness Analysis
- By Country
- By Product
- By Material
- By Barrier
- By End Use
- By Sales Channel
- Key Takeaways
- Western Europe Market Analysis and Forecast, By Country
- Historical Market Size Value (USD Million) Trend Analysis By Market Taxonomy, 2021 to 2025
- Market Size Value (USD Million) Forecast By Market Taxonomy, 2026 to 2036
- By Country
- Germany
- UK
- Italy
- Spain
- France
- Nordic
- BENELUX
- Rest of Western Europe
- By Product
- By Material
- By Barrier
- By End Use
- By Sales Channel
- By Country
- Market Attractiveness Analysis
- By Country
- By Product
- By Material
- By Barrier
- By End Use
- By Sales Channel
- Key Takeaways
- Eastern Europe Market Analysis and Forecast, By Country
- Historical Market Size Value (USD Million) Trend Analysis By Market Taxonomy, 2021 to 2025
- Market Size Value (USD Million) Forecast By Market Taxonomy, 2026 to 2036
- By Country
- Russia
- Poland
- Hungary
- Balkan & Baltic
- Rest of Eastern Europe
- By Product
- By Material
- By Barrier
- By End Use
- By Sales Channel
- By Country
- Market Attractiveness Analysis
- By Country
- By Product
- By Material
- By Barrier
- By End Use
- By Sales Channel
- Key Takeaways
- East Asia Market Analysis and Forecast, By Country
- Historical Market Size Value (USD Million) Trend Analysis By Market Taxonomy, 2021 to 2025
- Market Size Value (USD Million) Forecast By Market Taxonomy, 2026 to 2036
- By Country
- China
- Japan
- South Korea
- By Product
- By Material
- By Barrier
- By End Use
- By Sales Channel
- By Country
- Market Attractiveness Analysis
- By Country
- By Product
- By Material
- By Barrier
- By End Use
- By Sales Channel
- Key Takeaways
- South Asia and Pacific Market Analysis and Forecast, By Country
- Historical Market Size Value (USD Million) Trend Analysis By Market Taxonomy, 2021 to 2025
- Market Size Value (USD Million) Forecast By Market Taxonomy, 2026 to 2036
- By Country
- India
- ASEAN
- Australia & New Zealand
- Rest of South Asia and Pacific
- By Product
- By Material
- By Barrier
- By End Use
- By Sales Channel
- By Country
- Market Attractiveness Analysis
- By Country
- By Product
- By Material
- By Barrier
- By End Use
- By Sales Channel
- Key Takeaways
- Middle East & Africa Market Analysis and Forecast, By Country
- Historical Market Size Value (USD Million) Trend Analysis By Market Taxonomy, 2021 to 2025
- Market Size Value (USD Million) Forecast By Market Taxonomy, 2026 to 2036
- By Country
- Kingdom of Saudi Arabia
- Other GCC Countries
- Türkiye
- South Africa
- Other African Union
- Rest of Middle East & Africa
- By Product
- By Material
- By Barrier
- By End Use
- By Sales Channel
- By Country
- Market Attractiveness Analysis
- By Country
- By Product
- By Material
- By Barrier
- By End Use
- By Sales Channel
- Key Takeaways
- Key Countries Market Analysis
- USA
- Pricing Analysis
- Market Share Analysis, 2025
- By Product
- By Material
- By Barrier
- By End Use
- By Sales Channel
- Canada
- Pricing Analysis
- Market Share Analysis, 2025
- By Product
- By Material
- By Barrier
- By End Use
- By Sales Channel
- Mexico
- Pricing Analysis
- Market Share Analysis, 2025
- By Product
- By Material
- By Barrier
- By End Use
- By Sales Channel
- Brazil
- Pricing Analysis
- Market Share Analysis, 2025
- By Product
- By Material
- By Barrier
- By End Use
- By Sales Channel
- Chile
- Pricing Analysis
- Market Share Analysis, 2025
- By Product
- By Material
- By Barrier
- By End Use
- By Sales Channel
- Germany
- Pricing Analysis
- Market Share Analysis, 2025
- By Product
- By Material
- By Barrier
- By End Use
- By Sales Channel
- UK
- Pricing Analysis
- Market Share Analysis, 2025
- By Product
- By Material
- By Barrier
- By End Use
- By Sales Channel
- Italy
- Pricing Analysis
- Market Share Analysis, 2025
- By Product
- By Material
- By Barrier
- By End Use
- By Sales Channel
- Spain
- Pricing Analysis
- Market Share Analysis, 2025
- By Product
- By Material
- By Barrier
- By End Use
- By Sales Channel
- France
- Pricing Analysis
- Market Share Analysis, 2025
- By Product
- By Material
- By Barrier
- By End Use
- By Sales Channel
- India
- Pricing Analysis
- Market Share Analysis, 2025
- By Product
- By Material
- By Barrier
- By End Use
- By Sales Channel
- ASEAN
- Pricing Analysis
- Market Share Analysis, 2025
- By Product
- By Material
- By Barrier
- By End Use
- By Sales Channel
- Australia & New Zealand
- Pricing Analysis
- Market Share Analysis, 2025
- By Product
- By Material
- By Barrier
- By End Use
- By Sales Channel
- China
- Pricing Analysis
- Market Share Analysis, 2025
- By Product
- By Material
- By Barrier
- By End Use
- By Sales Channel
- Japan
- Pricing Analysis
- Market Share Analysis, 2025
- By Product
- By Material
- By Barrier
- By End Use
- By Sales Channel
- South Korea
- Pricing Analysis
- Market Share Analysis, 2025
- By Product
- By Material
- By Barrier
- By End Use
- By Sales Channel
- Russia
- Pricing Analysis
- Market Share Analysis, 2025
- By Product
- By Material
- By Barrier
- By End Use
- By Sales Channel
- Poland
- Pricing Analysis
- Market Share Analysis, 2025
- By Product
- By Material
- By Barrier
- By End Use
- By Sales Channel
- Hungary
- Pricing Analysis
- Market Share Analysis, 2025
- By Product
- By Material
- By Barrier
- By End Use
- By Sales Channel
- Kingdom of Saudi Arabia
- Pricing Analysis
- Market Share Analysis, 2025
- By Product
- By Material
- By Barrier
- By End Use
- By Sales Channel
- Türkiye
- Pricing Analysis
- Market Share Analysis, 2025
- By Product
- By Material
- By Barrier
- By End Use
- By Sales Channel
- South Africa
- Pricing Analysis
- Market Share Analysis, 2025
- By Product
- By Material
- By Barrier
- By End Use
- By Sales Channel
- USA
- Market Structure Analysis
- Competition Dashboard
- Competition Benchmarking
- Market Share Analysis of Top Players
- By Regional
- By Product
- By Material
- By Barrier
- By End Use
- By Sales Channel
- Emerging Startups
- Innovation Benchmarking
- Competition Analysis
- Competition Deep Dive
- Blue Ocean Closures
- Overview
- Product Portfolio
- Profitability by Market Segments
- Sales Footprint
- Strategy Overview
- Marketing Strategy
- Product Strategy
- Channel Strategy
- PulPac
- Stora Enso
- Tetra Pak
- ALPLA Group
- Paboco
- Origin Materials
- Sonoco
- Huhtamaki
- SIG Group
- Blue Ocean Closures
- Case Studies
- Success Stories
- Recent Developments
- Competition Deep Dive
- Assumptions & Acronyms Used


