

- Market Size (2026)
- USD 199.0 Mn
- Forecast (2036)
- USD 601.7 Mn
- CAGR (2026 to 2036)
- 11.7%
How Big is the Flour Fortification Premix Market in 2026?
The flour fortification premix market is estimated at USD 199.0 million in 2026.
The flour fortification premix market was valued at USD 178.2 million in 2025 and is estimated to reach USD 199.0 million in 2026. The market is projected to reach USD 601.7 million by 2036, expanding at a compound annual growth rate (CAGR) of 11.7% between 2026 and 2036. Demand for premix is supported by national fortification laws, which require millers to add specified vitamins and minerals to qualifying batches of flour. The Food Fortification Initiative reported that 86 countries had cereal grain fortification legislation in August 2026, including 85 covering wheat flour[5]. Coverage nevertheless remains incomplete, with 23.3% of the world's wheat flour, maize flour and rice fortified in 2025[4]. New requirements also create demand in established markets, including the United Kingdom, where non-wholemeal wheat flour must contain 0.25 milligrams of folic acid per 100 grams from 13 December 2026[2][6], requiring millers to prepare revised formulations and secure regular supplies.
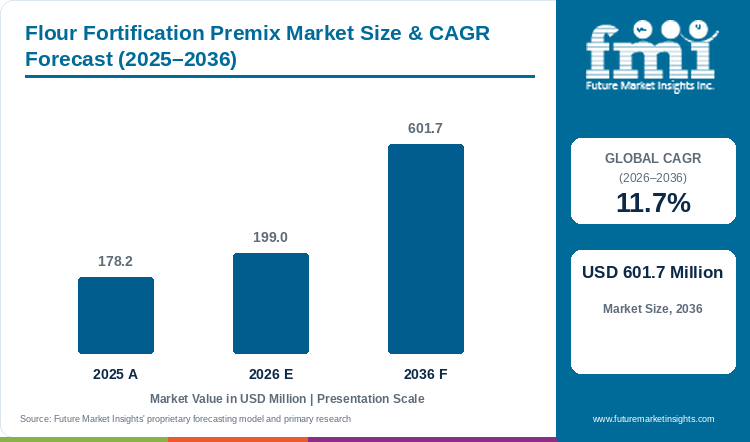
Table 1: Flour Fortification Premix Market Size and Forecast (USD million), 2025 to 2036
| Market size and forecast | Value |
|---|---|
| 2025 market size | USD 178.2 million |
| Estimated market size in 2026 | USD 199.0 million |
| Projected market size by 2036 | USD 601.7 million |
| CAGR (2026-2036) | 11.7% |
| Added revenue, 2026 to 2036 | USD 402.7 million |
Key Market Trends & Insights
- By grade: The Standard milling grade segment accounted for the largest share of the flour fortification premix market in 2026, representing 35.0% of total market revenue.
- By form: Powder / dry premixes held the leading market position with a share of 43.0% in 2026, as they suit the feeders already installed in flour mills.
- By application: Bread & rolls remained the largest application segment, accounting for 38.0% of the market in 2026.
Regional Highlights
- Fastest-growing country: The UAE is expected to record the highest growth rate among the eight profiled countries, with a projected CAGR of 13.0% between 2026 and 2036.
- Growth across other countries: Saudi Arabia is projected to expand at a CAGR of 12.6%, followed by South Korea at 12.3% and the USA at 12.0%. France is expected to register comparatively slower growth, with a CAGR of 10.8% during the forecast period.
The volume of flour produced in each country sets the base for premix consumption. According to UK Flour Millers, the UK milling industry processed 4.8 million tonnes of wheat and produced 3.8 million tonnes of flour in 2025[8]. Premix is added in small quantities, typically 200 to 600 grams per tonne of flour, depending on the nutrient combination and the concentration of the blend[9]. Global grain supply remains ample. In its December 2025 World Agricultural Supply and Demand Estimates, the United States Department of Agriculture (USDA) forecast world wheat consumption for 2025-26 at a record 823 million tonnes, while production was projected at 837.81 million tonnes[13]. Higher flour output can increase premix volumes in countries where flour enrichment is mandatory, although the amount of premix added to each tonne is set by national nutrient standards.
Public health programmes continue to shape the demand for premix. The World Health Organization's 2022 guideline links the choice of nutrients and fortification levels to national nutritional needs and the share of flour produced by industrial mills[1]. In the United Kingdom, where flour has been fortified with iron and other nutrients since the 1940s, the addition of folic acid to non-wholemeal wheat flour becomes mandatory from 13 December 2026[2][17]. The Food Standards Agency estimates that the measure will reduce neural tube defect rates by around 20.0%[6]. Such changes require millers to approve a revised premix formulation, update batch records and secure regular deliveries before the compliance date. FFI also reported that 21 countries made new or strengthened fortification commitments at the 2025 Nutrition for Growth Summit, and that it was supporting large-scale fortification programmes in 31 countries across five regions[4].
The supplier landscape includes global nutrition companies and specialist premix blenders. The GAIN Premix Facility, which helps fortification programmes procure quality-assured premix, has sourced approximately USD 86.0 million of fortificants and premix blends since 2009 for customers in 55 countries, and works with 45 suppliers across 62 approved production sites[7]. Large suppliers have also reported growth in their nutrition businesses. Glanbia reported like-for-like revenue growth of 6.8% in its Health & Nutrition segment in 2025, citing strong volume growth across its premix and flavour solutions businesses[11]. In its 2025 results, dsm-firmenich reported sales of EUR 2,102.0 million in its Health, Nutrition & Care business, compared with EUR 2,117.0 million in 2024, while organic sales growth reached 3.0% and adjusted EBITDA increased by 8.0% to EUR 407.0 million[10]. In India, Hexagon Nutrition, which exports to more than 75 countries and generates over half of its revenue from premix formulations, launched an initial public offering of INR 138.9 crore in June 2026[12].
Table 2: Supporting Industry Indicators for the Flour Fortification Premix Market, 2002 to 2026
| Indicator | Data point | Why it matters | Source |
|---|---|---|---|
| Mandatory legislation | 86 countries had legislation mandating fortification of at least one cereal grain in August 2026, including 85 for wheat flour, compared with 38 countries in 2002. | Each mandate creates a recurring premix requirement for every qualifying batch of flour. | [5] |
| Global coverage | An estimated 23.3% of the world's wheat flour, maize flour and rice was fortified in 2025, compared with 23.7% in 2024. | The flat coverage rate shows that a large share of milled grain remains unfortified. | [4] |
| New commitments | 21 countries made new or strengthened fortification commitments at the 2025 Nutrition for Growth Summit, while FFI supported programmes in 31 countries. | New commitments can lead to further mandates and premix tenders. | [4] |
| UK requirement | Non-wholemeal wheat flour must contain 0.25 mg of folic acid per 100 g from 13 December 2026. | Affected millers require a revised premix and a regular supply arrangement. | [2][6] |
| Health outcome | Folic acid fortification is estimated to reduce neural tube defect rates in the UK by around 20.0%. | The estimated health benefit supports the long-term continuation of the requirement. | [6] |
| Flour volume | UK mills produced 3.8 million tonnes of flour from 4.8 million tonnes of wheat in 2025. | Flour output sets the volume base for premix demand. | [8] |
| Industrial coverage | The UK has 49 industrial mills, with 95.4% of industrially milled flour fortified. The USA has 142 industrial mills, with 90.0% of output fortified. | High coverage in mature markets means growth depends on new nutrients and repeat orders. | [14][15] |
| Dosage | Premix is typically added at 200 to 600 grams per tonne of flour. | Premix is a small cost per tonne of flour but is essential for compliance. | [9] |
| Grain supply | USDA forecast 2025-26 world wheat consumption at a record 823 million tonnes and production at 837.81 million tonnes. | Wheat consumption indicates the potential volume of flour available for fortification. | [13] |
| Premix procurement | The GAIN Premix Facility has sourced approximately USD 86.0 million of fortificants and premix blends since 2009 across 55 countries. | The figure provides an external benchmark for donor-supported premix purchasing. | [7] |
| Supplier results | Glanbia's Health & Nutrition segment recorded 6.8% like-for-like revenue growth in 2025, with strong premix volumes. | The results provide an indication of commercial demand for nutrient premixes. | [11] |
| Supplier results | dsm-firmenich's Health, Nutrition & Care sales reached EUR 2,102.0 million in 2025, with organic growth of 3.0%. | The figure reflects demand conditions for one of the largest vitamin suppliers. | [10] |
| Capital markets | Hexagon Nutrition launched an INR 138.9 crore IPO in June 2026, with premix formulations generating over half of its revenue. | The listing indicates investor interest in specialist premix suppliers. | [12] |
Demand Intensity Analysis
A comparison of FMI's market estimate with global grain data provides a measure of premix value relative to wheat consumption. The USDA forecast world wheat consumption for 2025-26 at 823 million tonnes[13]. FMI estimated the flour fortification premix market at USD 178.2 million in 2025, which is equivalent to approximately USD 0.2 for every tonne of wheat consumed worldwide. The figure is low because wheat consumption includes animal feed and industrial use, and because only a portion of food flour is fortified. FFI estimates that 23.3% of the world's wheat flour, maize flour and rice was fortified in 2025[4].
Flour production in the United Kingdom provides a basis for estimating physical premix requirements. UK mills produced 3.8 million tonnes of flour in 2025[8]. At the typical addition rate of 200 to 600 grams per tonne[9], this volume would require approximately 760 to 2,280 tonnes of premix each year if all flour were treated. With 49 industrial mills in the country[15], the average mill produces approximately 77,600 tonnes of flour annually, corresponding to approximately 15.5 to 46.5 tonnes of premix per mill. These are upper-bound estimates, as wholemeal flour is excluded from the folic acid requirement[6] and actual addition rates depend on the concentration of each blend.
Donor-supported procurement provides another reference point. The GAIN Premix Facility has sourced approximately USD 86.0 million of fortificants and premix blends since 2009[7]. If spread evenly over the 17 years from 2009 to 2025, this represents an average of approximately USD 5.1 million per year, or about 2.8% of FMI's 2025 market estimate. Although the GAIN figure also covers premix for foods other than flour, the comparison indicates that most premix demand is purchased commercially by millers and bakeries rather than through donor-supported programmes.
A similar comparison can be made between projected market growth and the expansion of fortification legislation. The number of countries mandating fortification of at least one cereal grain increased from 38 in 2002 to 86 in 2026[5], equivalent to an average annual increase of approximately 3.5%. FMI expects the market to grow at a CAGR of 11.7% between 2026 and 2036. The difference of approximately 8.2 percentage points implies that the forecast relies on factors beyond new mandates, including higher coverage within existing programmes, additional nutrients such as folic acid, and changes in premix prices and product mix. The market is projected to reach 3.0 times its 2026 value by 2036.
Table 3: Demand Intensity Metrics for the Flour Fortification Premix Market, Industry Data Against 2025 and 2026 Market Values
| Demand intensity metric | Value | Basis |
|---|---|---|
| FMI market value, 2025 | USD 178.2 million | FMI estimate of premix revenue. |
| World wheat consumption, 2025-26 | 823 million tonnes | USDA forecast, December 2025. |
| FMI market value per tonne of wheat consumed | USD 0.2 | The calculation divides USD 178.2 million by 823 million tonnes. |
| UK flour production, 2025 | 3.8 million tonnes | UK Flour Millers. |
| Theoretical UK premix requirement | 760 to 2,280 tonnes per year | 3.8 million tonnes of flour multiplied by 200 to 600 grams per tonne. |
| Average flour output per UK industrial mill | 77,600 tonnes | 3.8 million tonnes divided by 49 industrial mills. |
| GAIN Premix Facility average annual sourcing | USD 5.1 million | USD 86.0 million spread evenly over 2009 to 2025. |
| GAIN average as a share of FMI 2025 value | 2.8% | USD 5.1 million divided by USD 178.2 million. |
| Countries with cereal fortification mandates | 38 in 2002; 86 in 2026 | FFI legislation tracking. |
| Average annual growth in mandating countries | 3.5% | Compound growth from 38 to 86 countries over 24 years. |
| FMI value CAGR, 2026 to 2036 | 11.7% | FMI market forecast. |
| Implied growth from coverage, nutrients, price and mix | 8.2 percentage points | Difference between FMI value CAGR and growth in mandating countries. |
| Standard milling grade revenue, 2026 | USD 69.7 million | 35.0% of the USD 199.0 million market. |
| Market expansion multiple | 3.0 times | Projected 2036 market value relative to 2026. |
Analyst Perspective
"Mandates set the minimum demand for premix, but repeat orders depend on whether a blend feeds evenly, meets the nutrient specification and arrives on schedule."
- Nandini Roy Choudhury, Principal Analyst at Future Market Insights
How is the flour fortification premix market segmented?
The flour fortification premix market is segmented by grade, form, application, claim and sales channel. Grade covers Standard milling grade, Fine / patisserie grade, Organic certified and Identity-preserved specialty. Form includes Powder / dry, Liquid, Paste / semi-solid and Granules / pieces. Application comprises Bread & rolls, Cakes & muffins, Biscuits & cookies, Viennoiserie & pastry and Other bakery & snacks. Claim includes Conventional, Clean label, Organic and Non-GMO / identity preserved. Sales Channel covers Direct to industrial bakeries, Ingredient distributors, Foodservice & artisan supply and Online B2B.
Why does Standard milling grade anchor the Grade category?
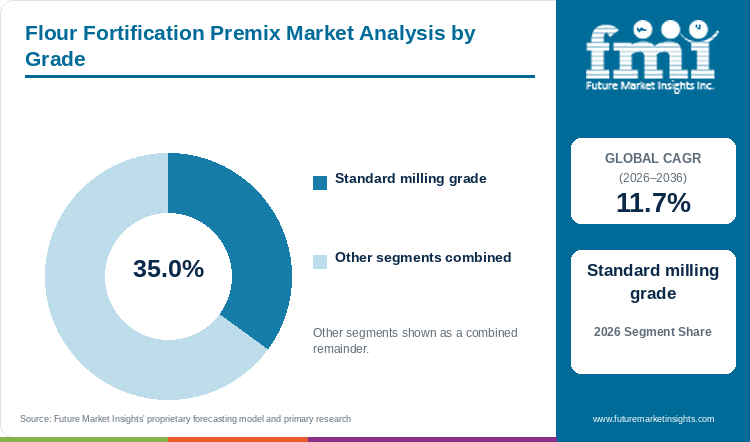
Standard milling grade holds 35.0% of Grade in 2026.
Fortification rules often target the flour types sold in the largest volumes. For instance, the UK folic acid requirement covers non-wholemeal wheat flour, while wholemeal flour is excluded[6]. This concentrates mandated premix demand in standard grades, which generated approximately USD 69.7 million in 2026. Mills producing a consistent standard grade can keep feeder settings unchanged and compare nutrient tests across batches. Functional flours and specialty grades require more frequent checks, as their extraction rates and handling properties vary. Organic certified and Identity-preserved specialty blends also require separate sourcing records and segregated storage, which adds to the cost of qualification.
- Standard milling grade holds 35.0% of Grade in 2026.
- A consistent extraction profile allows mills to keep feeder settings and compare nutrient tests across production runs.
What keeps Powder / dry ahead within Form?
Powder / dry contributes 43.0% of Form in 2026.
Flour mills commonly add nutrients through dry feeders, typically at rates of 200 to 600 grams of premix per tonne of flour[9]. Powder / dry products fit this equipment without modification, which helps explain why the format generated approximately USD 85.6 million in 2026. At such low addition rates, small differences in particle size or density can cause the blend to separate, while absorbed moisture can affect flow through the feeder. Mills therefore test nutrient distribution in the finished flour and store opened packs away from humidity. Liquid and Paste / semi-solid formats require separate dosing and storage equipment, which limits their use in conventional mills. Granules / pieces can improve handling for certain nutrients, provided they disperse evenly in the flour.
- Powder / dry contributes 43.0% of Form in 2026.
- Typical addition rates of 200 to 600 grams per tonne make even dispersion a key purchasing criterion.
How do Bread & rolls lead Application demand?
Bread & rolls represent 38.0% of Application in 2026.
Bread is produced daily in large volumes, which creates regular demand for flour with a consistent nutrient specification. Bread & rolls generated approximately USD 75.6 million of premix revenue in 2026, more than any other application. The premix must withstand mixing and baking without affecting the colour or flavour of the finished loaf, so a change of nutrient source can require new baking trials. Cakes & muffins contain higher levels of fat and sugar, while Biscuits & cookies and Viennoiserie & pastry have their own texture requirements. Large bread producers often hold a reserve of the approved premix and agree replacement lead times with suppliers to avoid interruptions in flour supply.
- Bread & rolls represent 38.0% of Application in 2026.
- A change of nutrient source should be tested in the finished bread, including its colour and flavour.
Why does Conventional retain the largest Claim allocation?
Conventional holds 55.0% of Claim in 2026.
For most mills, the choice of a conventional blend rests on three factors: nutrient content, stability over the storage period and cost per tonne of treated flour. Conventional premixes held the majority of the Claim segment in 2026, with revenue of approximately USD 109.5 million. Additional claims introduce further requirements. Organic certification depends on the supply chain of each ingredient, while Non-GMO / identity preserved positioning requires full traceability. A claim may apply to the premix, the flour or the packaged food, so purchasing teams need to specify which product carries it. Conventional formulations avoid these additional conditions but must still meet the nutrient specification and carry accurate ingredient information.
- Conventional holds 55.0% of Claim in 2026.
- Any declared claim must be compatible with the nutrient forms required in the flour.
Why is Direct to industrial bakeries the largest Sales Channel?
Direct to industrial bakeries accounts for 54.0% of Sales Channel in 2026.
Industrial bakeries often involve the premix manufacturer before a blend enters routine production, and direct supply generated approximately USD 107.5 million in 2026, more than half of revenue in the Sales Channel segment. Some bakeries blend flour at their own sites, while others rely on mills to add nutrients upstream. Direct supply helps both parties agree who controls the recipe and which product version is recorded. This is particularly important when a manufacturer changes a carrier or nutrient source, as the bakery can assess the change before accepting the next delivery. Ingredient distributors remain important for smaller orders and artisan accounts. Online B2B platforms simplify price comparison and reordering, although a new blend still requires samples, documentation and feeder trials.
- Direct to industrial bakeries accounts for 54.0% of Sales Channel in 2026.
- Advance notice of ingredient changes gives bakeries time to assess a revised blend.
What are the drivers, restraints and opportunities in the flour fortification premix market?
Expanding fortification mandates create recurring premix orders, although incomplete coverage and dosing costs restrain demand, while country-specific formulations create a service opportunity.
Expanding fortification mandates create recurring premix orders
The growth in fortification legislation is the main driver of premix demand. According to FFI, 86 countries had legislation mandating the fortification of at least one industrially milled cereal grain in August 2026, compared with 38 countries in 2002[5]. Each mandate creates a premix requirement that recurs with every qualifying batch of flour, so purchases follow flour output for as long as the requirement remains in force. New commitments continue to emerge. At the 2025 Nutrition for Growth Summit, 21 countries made new or strengthened fortification commitments[4]. Established markets are also adding nutrients. The UK requirement to add folic acid to non-wholemeal wheat flour from December 2026 will create new premix demand in a market that already fortifies 95.4% of its industrially milled flour[6][15].
Incomplete coverage and dosing costs restrain premix demand
Despite the growth in legislation, fortification coverage has not increased in recent years. FFI estimates that 23.3% of the world's wheat flour, maize flour and rice was fortified in 2025, compared with 23.7% in 2024[4]. Coverage depends on enforcement and on the share of flour produced in industrial mills, as monitoring is more difficult for small mills. Operating costs also affect supplier choice. Only a small quantity of premix enters each batch of flour, yet uneven addition can place the entire batch outside specification. A blend that separates during transport or feeds erratically can result in additional sampling, delayed release or rejected flour. As a result, a lower-priced premix may take time to gain approval, as its performance must be demonstrated on the mill's own equipment.
Country-specific formulations create a service opportunity
Changes in nutrient requirements create opportunities for suppliers that offer technical support alongside the premix. A new requirement often involves revised batch records, storage instructions and purchasing specifications as well as a new formulation. The UK folic acid transition illustrates this process, as millers must update recipes, labels and supplier approvals before December 2026[2]. For food premix businesses, helping customers manage such changes can be as valuable as supplying the formulation itself. Specialist suppliers are also attracting investment. For instance, Hexagon Nutrition, which exports to more than 75 countries, launched an INR 138.9 crore IPO in June 2026, with premix formulations accounting for over half of its revenue[12]. Similar opportunities arise when a flour producer adds a grade or develops products for export markets with different nutrient standards.
Which country CAGRs are profiled in the flour fortification premix market?
Table 4: Country growth outlook for the flour fortification premix market
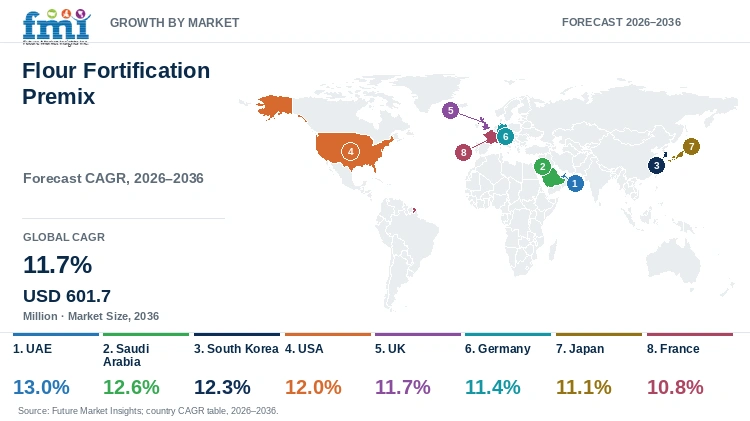
| Country | CAGR |
|---|---|
| UAE | 13.0% |
| Saudi Arabia | 12.6% |
| South Korea | 12.3% |
| USA | 12.0% |
| UK | 11.7% |
| Germany | 11.4% |
| Japan | 11.1% |
| France | 10.8% |
UAE
- Although wheat flour fortification in the UAE is voluntary, FFI notes that the country fortifies more than half of its industrially milled wheat flour[16]. The UAE is also the fastest-growing market among the profiled countries, with a projected CAGR of 13.0% between 2026 and 2036. Mills serving both domestic bakeries and export customers may require several nutrient recipes, so clear labelling of each blend is important to prevent the wrong premix from being used during a changeover. Moisture control is also relevant in a hot and humid climate, as absorbed moisture can affect how a dry blend feeds. Suppliers that offer manageable initial order sizes and support with nutrient testing are well placed to win new accounts.
Saudi Arabia
- According to FFI, Saudi Arabia was among the first places to fortify flour with vitamin D[16]. The market is projected to grow at a CAGR of 12.6% between 2026 and 2036. Large industrial mills place a high value on delivery reliability, as changing a premix means repeating feeder checks and batch documentation. Mills supplying different flour products may require separate blends, so clear lot identification is necessary to keep production schedules simple. Suppliers that respond quickly to technical questions when a delivery or recipe changes are better placed to retain accounts.
South Korea
- With a projected CAGR of 12.3% between 2026 and 2036, South Korea ranks third among the profiled countries. It does not appear on FFI's list of countries with mandatory cereal fortification[5], so demand comes mainly from bakeries and food manufacturers developing nutritionally positioned products. A premix for such products must preserve the flavour and appearance that consumers expect, and small dough trials allow the bakery to assess these effects before scaling up. Continued purchasing depends on whether the finished product remains in the retail range. Once approved, the formulation must be consistent enough for the bakery to use each new premix lot without adjusting the recipe.
USA
- The United States is one of two countries, alongside Costa Rica, with fortification legislation covering wheat flour, maize flour and rice[5]. According to FFI, the country has 142 industrial mills, and 90.0% of industrially milled flour is fortified[14]. With coverage already high, the projected CAGR of 12.0% between 2026 and 2036 depends mainly on bakery groups extending approved blends to additional sites and flour grades. Approval at one plant does not guarantee the same performance at another, as feeders and flour-handling systems differ between sites. A common change-notification procedure allows each site to review supplier changes and decide whether further checks are required.
UK
- UK flour has been fortified with iron and other nutrients since the 1940s[17], and FFI estimates that 95.4% of industrially milled flour is fortified across 49 industrial mills[15]. From 13 December 2026, non-wholemeal wheat flour must also contain 0.25 milligrams of folic acid per 100 grams[2][6]. The UK milling industry produced 3.8 million tonnes of flour in 2025[8], providing a large volume base for the new requirement, and the market is forecast to grow at a CAGR of 11.7% through 2036. Approval of the first folic acid blend is followed by regular replenishment, so suppliers that support incoming checks during the transition and maintain stable availability are well placed to retain accounts.
Germany
- The addition of vitamins and minerals to food is permitted across the European Union under Regulation (EC) No 1925/2006[17], but Germany does not appear on FFI's list of countries with mandatory cereal fortification[5]. Demand comes mainly from millers and bakeries developing differentiated flour ranges, and the market is projected to grow at a CAGR of 11.4% between 2026 and 2036. A premix must perform in the selected flour grade without changing familiar sensory properties, and small trial batches allow customers to refine recipes without large stock commitments. Once regular production begins, attention shifts to consistent deliveries and simple release checks.
Japan
- Japanese flour producers often use only modest quantities of premix in each run. Japan does not appear on FFI's list of countries with mandatory cereal fortification[5], so demand comes mainly from voluntary fortification of selected products, and the market is projected to grow at a CAGR of 11.1% between 2026 and 2036. Smaller pack sizes help reduce the amount of opened stock that must be protected between batches. Samples need to be tested in the intended recipe, as small changes in colour or flavour can affect product acceptance. Consistent lot quality and clear ingredient records allow customers to continue purchasing without repeated adjustments.
France
- France's fine bakery sector leaves little room for an unexpected colour or flavour from a nutrient blend. The country does not appear on FFI's list of countries with mandatory cereal fortification[5], and it is expected to register the slowest growth among the profiled countries, with a CAGR of 10.8% through 2036. French customers developing products with a specific nutritional objective must evaluate the premix in the finished recipe before approval. The nutrient composition and any claims made for the finished food also need to be clearly separated in the customer's records. Further demand may arise when customers add new flour grades, provided the new formulation can be introduced without affecting existing products.
Who are the notable companies in the flour fortification premix market?
dsm-firmenich; Hexagon Nutrition; Mühlenchemie / SternVitamin; Prinova; Glanbia Nutritionals
The GAIN Premix Facility lists dsm-firmenich, Hexagon Nutrition, Mühlenchemie / SternVitamin, Prinova and Glanbia Nutritionals among its dry-premix suppliers for fortified foods[3]. The facility works with 45 suppliers across 62 approved production sites[7]. Recent financial results indicate stable demand for nutrition ingredients. For instance, dsm-firmenich reported 2025 sales of EUR 2,102.0 million in Health, Nutrition & Care, with organic growth of 3.0%[10], while Glanbia reported 6.8% like-for-like revenue growth in its Health & Nutrition segment, supported by strong premix volumes[11]. Where a bakery group buys flour together with other bakery ingredients, the nutrient requirement must also fit the dough specification.
Differences between suppliers become clearer over successive deliveries. Consistent batch records simplify the release of fortified flour, while technical support becomes more valuable when a flour grade or nutrient requirement changes. As a result, blends with similar ingredient costs can create very different amounts of work for the customer.
Competitive Benchmarking: Flour Fortification Premix Market
Table 5: Company capabilities in the flour fortification premix market
| Company | Relevant offering | Purchasing consideration |
|---|---|---|
| dsm-firmenich | Dry micronutrient premix blending | Match nutrient recipe to flour specification |
| Hexagon Nutrition | Wheat-flour fortification premixes | Confirm nutrient forms and dose instructions |
| Mühlenchemie / SternVitamin | Flour improvement and vitamin-mineral premixes | Coordinate flour behavior with enrichment needs |
| Prinova | Nutrient premixes and flour-enrichment blends | Agree blend composition and delivery format |
| Glanbia Nutritionals | Dry micronutrient premix blending | Qualify the selected blend and production site |
Key Developments in the Flour Fortification Premix Market
- The folic acid requirement for non-wholemeal wheat flour was set out in consolidated bread and flour guidance published by UK authorities in April 2025, ahead of its introduction on 13 December 2026[2].
- Sales in dsm-firmenich's Health, Nutrition & Care business reached EUR 2,102.0 million in 2025, with organic growth of 3.0% and adjusted EBITDA of EUR 407.0 million, according to the results released in February 2026[10].
- Strong volume growth across premix and flavour solutions supported a 6.8% like-for-like increase in Glanbia's Health & Nutrition revenue for 2025, as the company reported in February 2026[11].
- Hexagon Nutrition's INR 138.9 crore initial public offering opened in June 2026 as an offer for sale, with the upper end of the price band valuing the company at approximately INR 553.0 crore[12].
- The Food Standards Agency's July 2026 guidance confirmed the amount of folic acid to be added to non-wholemeal wheat flour from December 2026, specifying 0.25 milligrams per 100 grams[6].
- Legislation requiring the fortification of at least one cereal grain was in place in 86 countries by August 2026, according to FFI, with wheat flour included in the requirements of 85 countries[5].
- An estimated 23.3% of the world's wheat flour, maize flour and rice was fortified in 2025, while 21 countries made new or strengthened commitments at the 2025 Nutrition for Growth Summit, as recorded in FFI's 2025 annual report[4].
Key Players in the Flour Fortification Premix Market
- dsm-firmenich
- Hexagon Nutrition
- Mühlenchemie / SternVitamin
- Prinova
- Glanbia Nutritionals
Flour Fortification Premix Market - Report Scope
Table 6: Report scope for the flour fortification premix market
| Coverage field | Report scope |
|---|---|
| Market breakdown | Grade; Form; Application; Claim; Sales Channel |
| Quantitative Units | USD Million |
| Market Definition | Revenue from flour fortification premixes sold within the five defined segment axes. Includes qualifying micronutrient blends sold for incorporation into flour and excludes downstream flour and finished bakery revenue, standalone bakery enzymes or emulsifiers, and other adjacent ingredients. Bundled supply is counted only for its separately identifiable qualifying premix component. |
| Regions Covered | North America; Latin America; Western Europe; Eastern Europe; East Asia; South Asia and Pacific; Middle East and Africa |
| Countries Covered | UAE; Saudi Arabia; South Korea; USA; UK; Germany; Japan; France |
| Key Companies Profiled | dsm-firmenich; Hexagon Nutrition; Mühlenchemie / SternVitamin; Prinova; Glanbia Nutritionals |
| Forecast Period | 2026 to 2036 |
| Approach | Market assessment supported by official technical and regulatory publications, company product information and country operating conditions. |
Flour Fortification Premix Market - Research Methodology
Table 7: Research approach for the flour fortification premix market
| Method | Approach |
|---|---|
| Market definition | The assessment separates qualifying ingredient revenue from finished bakery products and unrelated formulation inputs. |
| Secondary evidence | Government publications, regulatory material, technical literature and first-party product documentation establish the operating context. |
| Commercial assessment | Product performance, supply continuity and customer qualification requirements are considered within each segment and country profile. |
| Comparability | Market values, segment shares and country forecasts use the stated revenue boundary, units and forecast period. |
Flour Fortification Premix Market by Segments
Grade
- Standard milling grade
- Fine / patisserie grade
- Organic certified
- Identity-preserved specialty
Form
- Powder / dry
- Liquid
- Paste / semi-solid
- Granules / pieces
Application
- Bread & rolls
- Cakes & muffins
- Biscuits & cookies
- Viennoiserie & pastry
- Other bakery & snacks
Claim
- Conventional
- Clean label
- Organic
- Non-GMO / identity preserved
Sales Channel
- Direct to industrial bakeries
- Ingredient distributors
- Foodservice & artisan supply
- Online B2B
Flour Fortification Premix Market by Region
- North America
- United States
- Canada
- Latin America
- Brazil
- Mexico
- Argentina
- Chile
- Western Europe
- Germany
- France
- United Kingdom
- Italy
- Spain
- Benelux
- Nordics
- Eastern Europe
- Poland
- Czech Republic
- Romania
- Hungary
- East Asia
- China
- Japan
- South Korea
- South Asia and Pacific
- India
- ASEAN
- Australia and New Zealand
- Middle East and Africa
- GCC Countries
- South Africa
- Türkiye
- Israel
Research Sources and Bibliography
- [1] World Health Organization. (2022, June 3). Guideline: Fortification of wheat flour with vitamins and minerals as a public health strategy.
- [2] Department for Environment, Food & Rural Affairs, & Food Standards Agency. (2025, April 23). Bread and flour: Labelling and composition.
- [3] Global Alliance for Improved Nutrition. (n.d.). Current suppliers.
- [4] Food Fortification Initiative. (2026). 2025 annual report: Resilient by design.
- [5] Food Fortification Initiative. (2026, August). Global progress.
- [6] Food Standards Agency. (2026, July 10). Folic acid.
- [7] GAIN Premix Facility. (n.d.). Key results.
- [8] UK Flour Millers. (2026). Annual review.
- [9] Francksen, D. (2026, August 21). Milling and Grain. Fortification in the mill: The science, the mandate and the opportunity.
- [10] dsm-firmenich. (2026, February 12). dsm-firmenich reports full year 2025 results.
- [11] Glanbia plc. (2026, February 25). 2025 full year results.
- [12] INDmoney. (2026, June 5). Hexagon Nutrition IPO review: Strong margins, global exports, but is the valuation fair?
- [13] Milling Middle East & Africa. (2025, December 17). USDA lifts 2025-26 global wheat stocks forecast as higher output offsets record demand.
- [14] Food Fortification Initiative. (n.d.). United States of America: Country profile.
- [15] Food Fortification Initiative. (n.d.). United Kingdom of Great Britain and Northern Ireland: Country profile.
- [16] Food Fortification Initiative. (n.d.). Middle East.
- [17] Food Fortification Initiative. (n.d.). Europe.
Future Market Insights. (2026). Flour Fortification Premix Market: Global Industry Analysis and Opportunity Assessment 2036.
This Report Answers
- What is the flour fortification premix market worth in 2026 and what is forecast for 2036?
- Which nutrition-policy and industrial-purchasing pressures sustain flour fortification premix orders?
- Why does Standard milling grade lead the Grade category?
- Why does Powder / dry lead the Form category?
- How do the profiled country CAGRs differ between 2026 and 2036?
- Which premix suppliers support flour enrichment and recurring mill requirements?
Frequently Asked Questions
How big is the flour fortification premix market in 2026, and what is forecast for 2036?
The market is valued at USD 199.0 million in 2026 and is forecast to reach USD 601.7 million by 2036. These values cover premix revenue only and exclude flour and finished bakery sales.
What CAGR is forecast for the flour fortification premix market from 2026 to 2036?
The market is forecast to grow at a CAGR of 11.7% from 2026 to 2036, supported by new fortification mandates, additional nutrients such as folic acid and repeat orders from mills.
Which Grade segment leads the flour fortification premix market in 2026?
Standard milling grade leads with 35.0% in 2026, as fortification rules often target the flour types produced in the largest volumes.
Which Form segment has the largest share in 2026?
Powder / dry leads with 43.0% in 2026. Dry premix is added through existing mill feeders, typically at 200 to 600 grams per tonne of flour.
Which profiled countries show the highest growth rates?
The UAE leads at 13.0%, followed by Saudi Arabia at 12.6% and South Korea at 12.3% from 2026 to 2036. These are growth rates rather than rankings by market size.
Which companies are profiled in the flour fortification premix market?
The report profiles dsm-firmenich, Hexagon Nutrition, Mühlenchemie / SternVitamin, Prinova and Glanbia Nutritionals.
Preview the report firsthand - request a free sample
Get SampleGet the brochure for pricing and purchase details.
Get PDFTable of Content
- Key Takeaways
- Market Size and CAGR
- Top Growth Driver
- Fastest Growing Segment
- Leading Region
- Key Companies
- Emerging Opportunities
- Executive Summary
- Global Market Outlook
- Demand-side Trends
- Supply-side Trends
- Technology Roadmap Analysis
- Analysis and Recommendations
- Analyst Perspective (What is happening? Why now? What should investors know?)
- Key Questions Answered
- How large is the market?
- What is the CAGR?
- What are key trends?
- Which region dominates?
- Who are the leaders?
- Market Overview
- Market Coverage / Taxonomy
- Market Definition / Scope / Limitations
- Research Methodology
- Chapter Orientation
- Analytical Lens and Working Hypotheses
- Market Structure, Signals, and Trend Drivers
- Benchmarking and Cross-market Comparability
- Market Sizing, Forecasting, and Opportunity Mapping
- Research Design and Evidence Framework
- Desk Research Programme (Secondary Evidence)
- Expert Input and Fieldwork (Primary Evidence)
- Tooling, Models, and Reference Databases
- Data Engineering and Model Build
- Quality Assurance and Audit Trail
- Market Background
- Market Dynamics (Drivers, Restraints, Opportunity, Trends)
- Scenario Forecast (Optimistic, Likely, Conservative)
- Impact Analysis
- AI Impact
- Sustainability Impact
- Regulatory Impact
- Technology Impact
- Consumer / Buyer Analysis
- Purchase Drivers
- Adoption Barriers
- Buyer Journey
- Opportunity Map Analysis
- Product Life Cycle Analysis
- Supply Chain Analysis
- Investment Feasibility Matrix
- Value Chain Analysis
- PESTLE and Porter's Analysis
- Regulatory Landscape
- Regional Parent Market Outlook
- Production and Consumption Statistics
- Import and Export Statistics
- Global Market Analysis and Forecast, 2021 to 2036
- Historical Market Size Value (USD Million) Analysis, 2021 to 2025
- Current and Future Market Size Value (USD Million) Projections, 2026 to 2036
- Y-o-Y Growth Trend Analysis
- Absolute $ Opportunity Analysis
- Global Market Pricing Analysis, 2021 to 2036
- Global Market Analysis and Forecast, By Grade, 2021 to 2036
- Introduction / Key Findings
- Historical Market Size Value (USD Million) Analysis By Grade, 2021 to 2025
- Current and Future Market Size Value (USD Million) Analysis and Forecast By Grade, 2026 to 2036
- Standard milling grade
- Fine / patisserie grade
- Organic certified
- Identity-preserved specialty
- Y-o-Y Growth Trend Analysis By Grade, 2021 to 2025
- Absolute $ Opportunity Analysis By Grade, 2026 to 2036
- Global Market Analysis and Forecast, By Form, 2021 to 2036
- Introduction / Key Findings
- Historical Market Size Value (USD Million) Analysis By Form, 2021 to 2025
- Current and Future Market Size Value (USD Million) Analysis and Forecast By Form, 2026 to 2036
- Powder / dry
- Liquid
- Paste / semi-solid
- Granules / pieces
- Y-o-Y Growth Trend Analysis By Form, 2021 to 2025
- Absolute $ Opportunity Analysis By Form, 2026 to 2036
- Global Market Analysis and Forecast, By Application, 2021 to 2036
- Introduction / Key Findings
- Historical Market Size Value (USD Million) Analysis By Application, 2021 to 2025
- Current and Future Market Size Value (USD Million) Analysis and Forecast By Application, 2026 to 2036
- Bread & rolls
- Cakes & muffins
- Biscuits & cookies
- Viennoiserie & pastry
- Other bakery & snacks
- Y-o-Y Growth Trend Analysis By Application, 2021 to 2025
- Absolute $ Opportunity Analysis By Application, 2026 to 2036
- Global Market Analysis and Forecast, By Claim, 2021 to 2036
- Introduction / Key Findings
- Historical Market Size Value (USD Million) Analysis By Claim, 2021 to 2025
- Current and Future Market Size Value (USD Million) Analysis and Forecast By Claim, 2026 to 2036
- Conventional
- Clean label
- Organic
- Non-GMO / identity preserved
- Y-o-Y Growth Trend Analysis By Claim, 2021 to 2025
- Absolute $ Opportunity Analysis By Claim, 2026 to 2036
- Global Market Analysis and Forecast, By Sales Channel, 2021 to 2036
- Introduction / Key Findings
- Historical Market Size Value (USD Million) Analysis By Sales Channel, 2021 to 2025
- Current and Future Market Size Value (USD Million) Analysis and Forecast By Sales Channel, 2026 to 2036
- Direct to industrial bakeries
- Ingredient distributors
- Foodservice & artisan supply
- Online B2B
- Y-o-Y Growth Trend Analysis By Sales Channel, 2021 to 2025
- Absolute $ Opportunity Analysis By Sales Channel, 2026 to 2036
- Global Market Analysis and Forecast, By Region, 2021 to 2036
- Introduction
- Historical Market Size Value (USD Million) Analysis By Region, 2021 to 2025
- Current Market Size Value (USD Million) Analysis and Forecast By Region, 2026 to 2036
- North America
- Latin America
- Western Europe
- Eastern Europe
- East Asia
- South Asia and Pacific
- Middle East and Africa
- Market Attractiveness Analysis By Region
- North America Market Analysis and Forecast, By Country, 2021 to 2036
- Historical Market Size Value (USD Million) Trend Analysis By Market Taxonomy, 2021 to 2025
- Market Size Value (USD Million) Forecast By Market Taxonomy, 2026 to 2036
- By Country
- United States
- Canada
- By Grade
- By Form
- By Application
- By Claim
- By Sales Channel
- By Country
- Market Attractiveness Analysis
- By Country
- By Grade
- By Form
- By Application
- By Claim
- By Sales Channel
- Key Takeaways
- Latin America Market Analysis and Forecast, By Country
- Historical Market Size Value (USD Million) Trend Analysis By Market Taxonomy, 2021 to 2025
- Market Size Value (USD Million) Forecast By Market Taxonomy, 2026 to 2036
- By Country
- Brazil
- Mexico
- Argentina
- Chile
- By Grade
- By Form
- By Application
- By Claim
- By Sales Channel
- By Country
- Market Attractiveness Analysis
- By Country
- By Grade
- By Form
- By Application
- By Claim
- By Sales Channel
- Key Takeaways
- Western Europe Market Analysis and Forecast, By Country
- Historical Market Size Value (USD Million) Trend Analysis By Market Taxonomy, 2021 to 2025
- Market Size Value (USD Million) Forecast By Market Taxonomy, 2026 to 2036
- By Country
- Germany
- France
- United Kingdom
- Italy
- Spain
- Benelux
- Nordics
- By Grade
- By Form
- By Application
- By Claim
- By Sales Channel
- By Country
- Market Attractiveness Analysis
- By Country
- By Grade
- By Form
- By Application
- By Claim
- By Sales Channel
- Key Takeaways
- Eastern Europe Market Analysis and Forecast, By Country
- Historical Market Size Value (USD Million) Trend Analysis By Market Taxonomy, 2021 to 2025
- Market Size Value (USD Million) Forecast By Market Taxonomy, 2026 to 2036
- By Country
- Poland
- Czech Republic
- Romania
- Hungary
- By Grade
- By Form
- By Application
- By Claim
- By Sales Channel
- By Country
- Market Attractiveness Analysis
- By Country
- By Grade
- By Form
- By Application
- By Claim
- By Sales Channel
- Key Takeaways
- East Asia Market Analysis and Forecast, By Country
- Historical Market Size Value (USD Million) Trend Analysis By Market Taxonomy, 2021 to 2025
- Market Size Value (USD Million) Forecast By Market Taxonomy, 2026 to 2036
- By Country
- China
- Japan
- South Korea
- By Grade
- By Form
- By Application
- By Claim
- By Sales Channel
- By Country
- Market Attractiveness Analysis
- By Country
- By Grade
- By Form
- By Application
- By Claim
- By Sales Channel
- Key Takeaways
- South Asia and Pacific Market Analysis and Forecast, By Country
- Historical Market Size Value (USD Million) Trend Analysis By Market Taxonomy, 2021 to 2025
- Market Size Value (USD Million) Forecast By Market Taxonomy, 2026 to 2036
- By Country
- India
- ASEAN
- Australia and New Zealand
- By Grade
- By Form
- By Application
- By Claim
- By Sales Channel
- By Country
- Market Attractiveness Analysis
- By Country
- By Grade
- By Form
- By Application
- By Claim
- By Sales Channel
- Key Takeaways
- Middle East and Africa Market Analysis and Forecast, By Country
- Historical Market Size Value (USD Million) Trend Analysis By Market Taxonomy, 2021 to 2025
- Market Size Value (USD Million) Forecast By Market Taxonomy, 2026 to 2036
- By Country
- GCC Countries
- South Africa
- Türkiye
- Israel
- By Grade
- By Form
- By Application
- By Claim
- By Sales Channel
- By Country
- Market Attractiveness Analysis
- By Country
- By Grade
- By Form
- By Application
- By Claim
- By Sales Channel
- Key Takeaways
- Key Countries Market Analysis
- United States
- Pricing Analysis
- Market Share Analysis, 2025
- By Grade
- By Form
- By Application
- By Claim
- By Sales Channel
- Canada
- Pricing Analysis
- Market Share Analysis, 2025
- By Grade
- By Form
- By Application
- By Claim
- By Sales Channel
- Mexico
- Pricing Analysis
- Market Share Analysis, 2025
- By Grade
- By Form
- By Application
- By Claim
- By Sales Channel
- Brazil
- Pricing Analysis
- Market Share Analysis, 2025
- By Grade
- By Form
- By Application
- By Claim
- By Sales Channel
- Chile
- Pricing Analysis
- Market Share Analysis, 2025
- By Grade
- By Form
- By Application
- By Claim
- By Sales Channel
- Germany
- Pricing Analysis
- Market Share Analysis, 2025
- By Grade
- By Form
- By Application
- By Claim
- By Sales Channel
- United Kingdom
- Pricing Analysis
- Market Share Analysis, 2025
- By Grade
- By Form
- By Application
- By Claim
- By Sales Channel
- Italy
- Pricing Analysis
- Market Share Analysis, 2025
- By Grade
- By Form
- By Application
- By Claim
- By Sales Channel
- Spain
- Pricing Analysis
- Market Share Analysis, 2025
- By Grade
- By Form
- By Application
- By Claim
- By Sales Channel
- France
- Pricing Analysis
- Market Share Analysis, 2025
- By Grade
- By Form
- By Application
- By Claim
- By Sales Channel
- India
- Pricing Analysis
- Market Share Analysis, 2025
- By Grade
- By Form
- By Application
- By Claim
- By Sales Channel
- ASEAN
- Pricing Analysis
- Market Share Analysis, 2025
- By Grade
- By Form
- By Application
- By Claim
- By Sales Channel
- Australia and New Zealand
- Pricing Analysis
- Market Share Analysis, 2025
- By Grade
- By Form
- By Application
- By Claim
- By Sales Channel
- China
- Pricing Analysis
- Market Share Analysis, 2025
- By Grade
- By Form
- By Application
- By Claim
- By Sales Channel
- Japan
- Pricing Analysis
- Market Share Analysis, 2025
- By Grade
- By Form
- By Application
- By Claim
- By Sales Channel
- South Korea
- Pricing Analysis
- Market Share Analysis, 2025
- By Grade
- By Form
- By Application
- By Claim
- By Sales Channel
- Poland
- Pricing Analysis
- Market Share Analysis, 2025
- By Grade
- By Form
- By Application
- By Claim
- By Sales Channel
- Hungary
- Pricing Analysis
- Market Share Analysis, 2025
- By Grade
- By Form
- By Application
- By Claim
- By Sales Channel
- Türkiye
- Pricing Analysis
- Market Share Analysis, 2025
- By Grade
- By Form
- By Application
- By Claim
- By Sales Channel
- South Africa
- Pricing Analysis
- Market Share Analysis, 2025
- By Grade
- By Form
- By Application
- By Claim
- By Sales Channel
- UAE
- Pricing Analysis
- Market Share Analysis, 2025
- By Grade
- By Form
- By Application
- By Claim
- By Sales Channel
- Saudi Arabia
- Pricing Analysis
- Market Share Analysis, 2025
- By Grade
- By Form
- By Application
- By Claim
- By Sales Channel
- United States
- Market Structure Analysis
- Competition Dashboard
- Competition Benchmarking
- Market Share Analysis of Top Players
- By Regional
- By Grade
- By Form
- By Application
- By Claim
- By Sales Channel
- Emerging Startups
- Innovation Benchmarking
- Competition Analysis
- Competition Deep Dive
- dsm-firmenich
- Overview
- Product Portfolio
- Profitability by Market Segments
- Sales Footprint
- Strategy Overview
- Marketing Strategy
- Product Strategy
- Channel Strategy
- Hexagon Nutrition
- Mühlenchemie / SternVitamin
- Prinova
- Glanbia Nutritionals
- dsm-firmenich
- Case Studies
- Success Stories
- Recent Developments
- Competition Deep Dive
- Assumptions & Acronyms Used


