

- Market Size (2026)
- USD 950.0 Mn
- Forecast (2036)
- USD 1800.1 Mn
- CAGR (2026 to 2036)
- 6.6%
How big is the Wheat Fortification Premix Market in 2026?
USD 950.0 million in 2026 and USD 1,800.1 million by 2036 at a 6.6% CAGR.
Mandatory flour enrichment is moving wheat fortification premix buying from ingredient purchase toward controlled nutrient delivery. Food Fortification Initiative reports that 94 countries have legislation mandating fortification of at least one industrially milled cereal grain, which ties food premix demand to dosing control and certificate discipline. Millers are expected to screen suppliers on nutrient dispersion and issue response before routine orders expand.
Flour millers and bakery processors carry the main adoption burden in routine commercial production. Public nutrition programs and private-label food manufacturers also shape supplier qualification across tender and retail accounts. GAIN Premix Facility reported in June 2026 that it worked with 44 suppliers across approved production sites, which shows the screening depth buyers expect before a premix enters routine purchase.
Premix use becomes more valuable once nutrient formulation connects to mill dosing and bakery performance. Mature markets are expected to emphasize certificate packs and stability files during routine supplier qualification decisions. Higher-growth markets are likely to emphasize scalable supply and local service during commercial rollout planning. Procurement teams are expected to favor vendors that prove control across formulation and plant-level handling inside food fortification programs before launch risks reach buyer teams.
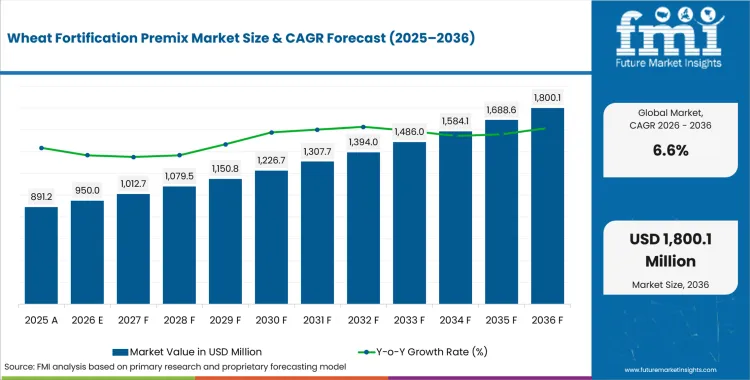
| Metric | Value |
|---|---|
| 2025 Market Size | USD 891.2 million |
| 2026 Market Size | USD 950.0 million |
| 2036 Market Size | USD 1,800.1 million |
| Forecast CAGR (2026-2036) | 6.6% |
| Leading Product Type | Premix |
| Premix Share (2026) | 37.0% |
| Leading Source | Plant |
| Plant Share (2026) | 34.5% |
| Leading Application | Bakery |
| Bakery Share (2026) | 41.0% |
| Fastest-growing Profiled Country | India |
| India CAGR by 2036 | 5.9% |
Summary of the Wheat Fortification Premix Market
| Market Signal | Commercial Impact |
|---|---|
| Demand and Growth Drivers | Industry growth is projected to be driven by fortification compliance and mill risk control across industrial wheat flour production. Another driver is bakery demand for certificate-backed premixes that reduce dosing errors before recipe rollout.
|
| Product and Segment View | Premix format and bakery application are expected to guide 2026 segment demand. Plant sourcing remains part of the approval screen for buyers that need traceable ingredient records.
|
| Geography and Growth Outlook | South Asia and East Asia are expected to remain active expansion zones for wheat fortification premix suppliers. Developed markets are likely to grow through audit routines and mature bakery procurement systems over time
|
| Competitive Landscape | Competition is projected to focus on nutrient formulation and mill service across public-health and bakery accounts. Traceable ingredients and application support are expected to decide supplier shortlists in higher-volume tenders during procurement.
|
| Analyst Perspective | The primary adoption factor is expected to be documented dosage control across fortified wheat flour production. Supplier accountability is expected to strengthen when technical service reduces batch variation and nutrient-dosing errors.
|
Source: FMI's proprietary forecasting model and primary research
How is the wheat fortification premix market segmented?
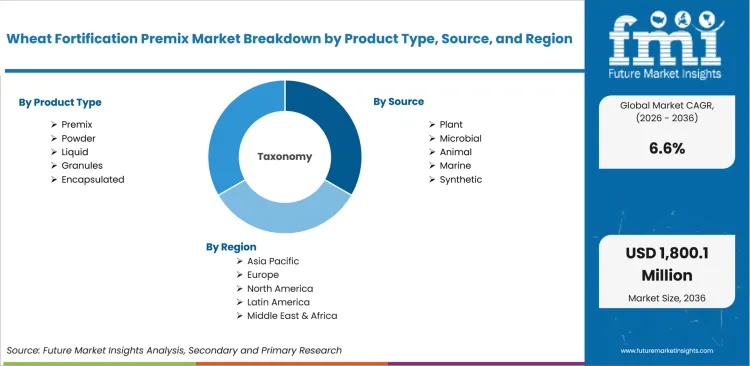
The wheat fortification premix market industry is segmented by product type, source, application, end user, and region.
The wheat fortification premix market is segmented by product type, source, application, end user, and region. By product type, the market covers powder, liquid, granules, encapsulated, and premix. By source, it covers plant, microbial, animal, marine, and synthetic inputs. By application, it covers bakery, beverages, dairy, snacks, and infant nutrition. By end user, demand comes from food manufacturers, foodservice, private label, nutraceutical brands, and retail. Regional coverage includes North America, Latin America, Europe, East Asia, South Asia and Pacific, and the Middle East and Africa, supported by related food fortifying agents demand in staple food systems.
How does premix shape demand within the product type category?
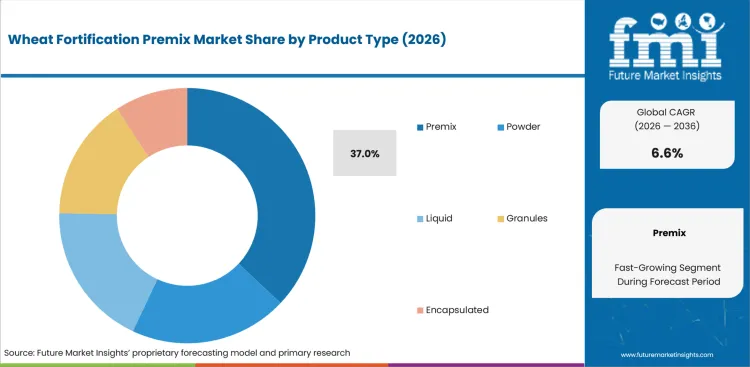
Product type selection is expected to influence dosing accuracy before mills approve broader fortification programs. Premix formats carry procurement weight due to fewer separate micronutrient inputs and simpler plant handling. Food Fortification Initiative lists 69 countries that have legislation for wheat flour alone, which keeps qualification work tied to repeatable blends. Suppliers therefore need dispersion proof and certificate control before commercial mill orders expand.
- Premix is expected to account for 37.0% market share in 2026, supported by buyers that prefer one standardized blend for flour dosing. Food Fortification Initiative reported that 17 countries have legislation for wheat flour and maize flour, which extends the practical base for premix qualification.
- The executive case for premix centers on fewer operating handoffs: procurement teams qualify one blend and mill teams receive clearer dosage records. GAIN Premix Facility states that its supplier list covers 61 approved production sites, which raises expectations for traceable certificates and repeatable issue resolution.
What supports demand for plant source choices?
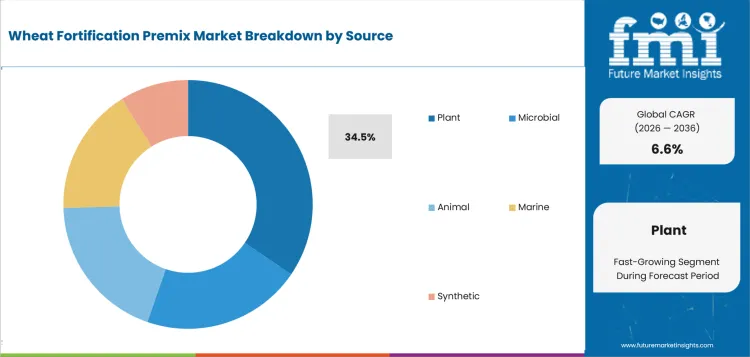
Source decisions are expected to shape buyer trust before a fortified wheat product reaches retail or tender accounts. Plant inputs fit clean-label briefs and reduce animal-derived concerns in some food systems. FAO forecast world cereal utilization at 2.969 billion tonnes for 2026/27, which shows the scale behind staple processing decisions. Buyers still need stability proof before a new carrier moves into commercial production.
- Plant is projected to represent 34.5% of the market in 2026, driven by traceability needs and broader ingredient-origin screening. plant-based premix sourcing is supported by FAO's June 2025 forecast for cereal stocks at 873 million tonnes, which keeps supply planning visible for staple processors.
- Brand and bakery teams gain from plant source choices due to clearer ingredient narratives and fewer label conflicts. USDA ERS reported USA food spending of USD 2.51 trillion in 2025, which shows why large buyers apply formal quality controls before ingredient substitution.
How do buyers evaluate bakery within the application category?
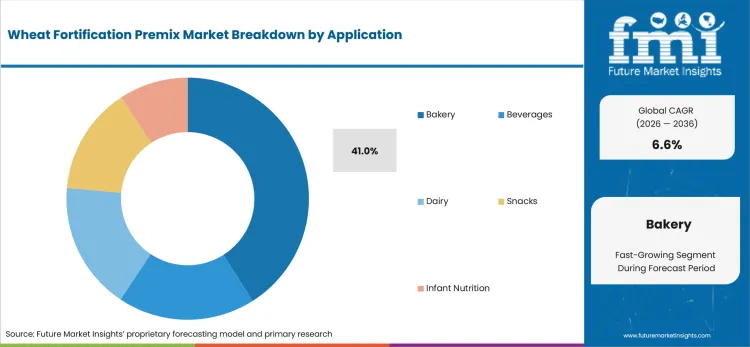
Application selection is expected to influence whether premix remains a compliance input or becomes part of routine product design. Bakery products expose premix performance to repeated mixing and heat pressure during commercial production. Shelf-life expectations add another approval screen for fortified flour applications in bread and roll programs. Bakery buyers therefore evaluate nutrient stability and dough behavior before suppliers enter routine production discussions.
- Bakery is anticipated to hold 41.0% share in 2026, attributable to routine wheat flour use in bread production. bakery ingredients planning is supported by SternVitamin applications covering bread and rolls, which keeps premix use tied to daily flour-based production.
- For bakery buyers, fortified premix reduces claim risk attributable to consistent dispersion inside routine flour systems. The practical value lies in keeping nutrition claims and dough performance aligned during repeated production runs. Related dough based premixes planning also favors suppliers that connect nutrient delivery to product quality.
What drives food manufacturers within the end user category?
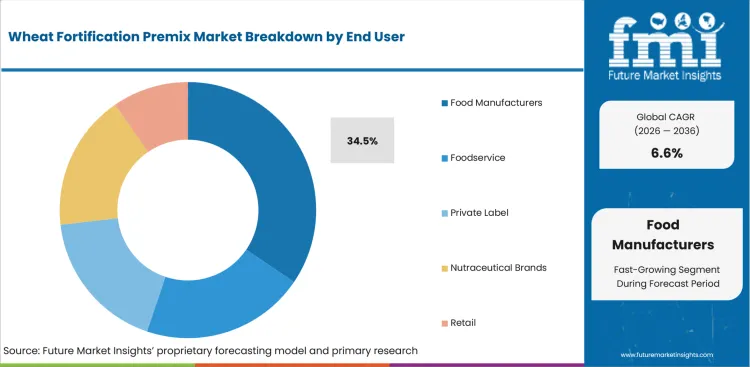
End user demand is expected to reflect who carries operating risk after a premix purchase. Food manufacturers own batch release and label compliance across fortified product programs. Customer audit response adds a further pressure point during supplier review and commercial rollout planning. Access to Nutrition Initiative reported in September 2025 that its VitaMin assessment evaluated 11 fortificant producers, which points to closer scrutiny of upstream supplier practice. Manufacturers need suppliers that reduce formulation friction during repeated plant trials and documented customer approvals.
- Food manufacturers are forecast to capture 34.5% share in 2026, owing to their control of formulation and batch release. customized premix programs are supported by Prinova's custom nutrient premixes across complex formulations, which fits manufacturers that manage several fortified product lines.
- The buying decision for food manufacturers is about accountable implementation: quality managers need one supplier path for specifications and samples. Hexagon Nutrition states that its wheat flour premix simplifies processing and quality control, which aligns supplier selection with plant routines and documented claim support.
What are the drivers, restraints, and opportunities in the wheat fortification premix market?
Near-term purchases are being shaped by fortification compliance, mill dosing constraint, and bakery application support outlined below.
- Driver: Fortification programs are expected to push millers toward premixes that provide uniform nutrient dispersion and inspection-ready certificates.
- Restraint: Adoption is anticipated to slow in mills that lack dosing equipment and affordable micronutrient testing routines.
- Opportunity: Bakery-specific technical support is likely to open supplier access in accounts that need nutrient claims and product quality alignment.
Millers are expected to increase buying activity if fortification briefs connect nutrient design to predictable plant handling. FSSAI identifies wheat flour among fortified staple foods, which reinforces the role of official standards in buyer review. Suppliers that explain dosing checks and certificate documents in operational terms are likely to gain trial access before larger supply contracts.
Quality teams are likely to slow approvals in accounts that cannot verify dispersion and storage stability before purchase. Micronutrient testing also adds cost for mills that operate outside large industrial networks. GAIN Premix Facility supplier screening shows why buyers treat audit readiness and approved production sites as procurement filters instead of optional service claims.
Implementation barriers are projected to create a route for vendors that bundle premix design and application service. Bakery processors need nutrient delivery that works during mixing and heat exposure. Suppliers that connect mill dosing support to product performance are positioned to build repeat purchase discussions in bread and packaged wheat accounts.
Which country CAGRs are profiled in the wheat fortification premix market?
.webp "Top Country Growth Comparison Wheat Fortification Premix Market Cagr (2026 2036)")
| Country | CAGR |
|---|---|
| United States | 4.0% |
| China | 5.0% |
| India | 5.9% |
| Germany | 3.4% |
| United Kingdom | 3.6% |
| Japan | 2.8% |
| South Korea | 3.8% |
Source: FMI's proprietary forecasting model and primary research
How do country-level CAGRs compare in the wheat fortification premix market?
Country CAGR profiles in the wheat fortification premix market reflect fortification policy attention and milling structure. Bakery procurement discipline then shapes supplier conversion across mature accounts that require stable evidence files. India and China show more active expansion signals due to food processing scale and public nutrition priorities. The United States and South Korea remain steady adoption environments shaped by audit routines and packaged food production. Germany, the United Kingdom, and Japan show measured purchasing cycles where documentation depth guides account conversion.
- The United States is projected to grow at 4.0% CAGR from 2026 to 2036 due to mature bakery procurement and supplier documentation routines. USDA ERS reported USA food spending of USD 2.51 trillion in 2025, which supports formal quality checks before ingredient substitution. Midwest milling and bakery buyers are expected to favor suppliers that provide certificates and repeatable technical support.
- China demand is anticipated to advance at 5.0% CAGR over the assessment period, supported by large packaged food capacity and localized service needs. USDA FAS reported in April 2026 that China food processing sales reached USD 2.09 trillion in 2025, which keeps supplier qualification tied to reliable scale support. Coastal bakery clusters are likely to test premix suppliers on consistency before broader contracts.
- India is forecast to rise at 5.9% CAGR from 2026 to 2036, attributable to fortified staple policy attention and wheat processing scale. USDA FAS reported in March 2026 that India had more than 42 thousand food processing units, which supports supplier opportunity in structured flour programs. Northern and western milling corridors are expected to value affordable dosing support and local service response.
- Germany is estimated to post 3.4% CAGR over the forecast period, owing to careful quality review and bakery-sector documentation needs. USDA FAS reported in March 2026 that Germany’s food processing sector included around 6 thousand companies, which supports a measured but service-intensive adoption base. Millers in Bavaria and North Rhine-Westphalia are anticipated to favor suppliers that fit established quality systems.
- The United Kingdom outlook is projected to record 3.6% CAGR during the assessment period, driven by retail bakery standards and documented reformulation work. ONS reported in July 2025 that UK manufacturers’ sales by product covered 2024 output values, which keeps food processors attentive to verifiable product files. Bakery and private-label buyers are expected to favor suppliers that reduce approval friction.
- In Japan, wheat fortification premix demand is predicted to advance at 2.8% CAGR from 2026 to 2036 due to conservative claims review and precise processing expectations. USDA FAS reported in April 2026 that Japan’s food processing industry remained highly dependent on imported inputs, which raises supplier continuity requirements. Tokyo and Kansai food processors are predicted to prefer stable specification packs.
- South Korea is expected to post 3.8% CAGR over the forecast period, supported by packaged food routines and formal ingredient review. USDA FAS reported in May 2026 that Korea maintained detailed food ingredient import and labeling requirements, which supports demand for clear premix documentation. Seoul-area processors are expected to favor vendors that combine regulatory awareness and rapid issue resolution.
Who are the notable companies in the wheat fortification premix market?
dsm-firmenich, BASF, Glanbia Nutritionals, Prinova, SternVitamin, Mühlenchemie, and Hexagon Nutrition are the notable companies shaping this market.
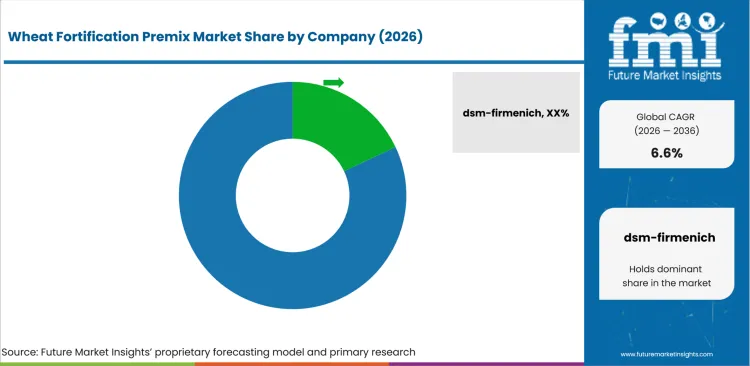
Competition in the wheat fortification premix market is split by nutrition science and flour technical service. Custom blending control forms a separate decision point for manufacturers that manage several fortified wheat products. The consumer decision is expected to center on which supplier reduces dosing risk and documentation work.
- dsm-firmenich and BASF focus on nutrition science and public-health collaboration, which addresses buyers needing technical depth in micronutrient design. Program buyers use these portfolios to reduce qualification work before tender or mill rollout discussions.
- Buyers choosing Mühlenchemie or SternVitamin are typically looking for flour fortification expertise due to mill behavior and bakery-performance needs. Their application knowledge helps quality teams lower production risk before commercial orders.
- Glanbia Nutritionals and Prinova gain preference in custom-blend environments due to premix design breadth and manufacturing support. Procurement teams use these suppliers in accounts whose internal R&D needs help translating formulas into stable plant routines.
- In regional fortification channels, Hexagon Nutrition is prominent due to local supply access and product knowledge. Millers value supplier proximity in programs that need affordable dosing support and quick issue handling.
Competitive Benchmarking: Wheat Fortification Premix Market
| Company | Fortification Fit | Application Support | Service Reach | Regional Access |
|---|---|---|---|---|
| dsm-firmenich | High | Strong | Global | High |
| BASF | Strong | Medium | Global | Strong |
| Glanbia Nutritionals | High | Strong | Global | Strong |
| Prinova | High | Strong | Global | High |
| SternVitamin | Strong | High | Global | Strong |
| Mühlenchemie | High | High | Global | Strong |
| Hexagon Nutrition | Strong | Medium | Regional | Country-specific |
Source: Future Market Insights competitive analysis, 2026. Ratings reflect relative portfolio relevance and workflow fit across wheat fortification premix accounts. Service capability and geographic reach shape remaining comparison points.
Key Players in the Wheat Fortification Premix Market
Nutrition and micronutrient suppliers
- dsm-firmenich
- BASF
- Glanbia Nutritionals
- Prinova
Flour fortification and bakery specialists
- Mühlenchemie
- SternVitamin
Regional fortification suppliers
- Hexagon Nutrition
Wheat Fortification Premix Market - Report Scope
| Coverage field | Report scope |
|---|---|
| Market breakdown | Wheat Fortification Premix Market Breakdown by product type, source, application, end user, and region |
| Market Definition | Micronutrient premix products used by flour millers, food manufacturers, bakeries, and nutrition programs to fortify wheat flour and wheat-based foods. |
| Regions Covered | North America, Latin America, Europe, East Asia, South Asia and Pacific, Middle East and Africa |
| Countries Covered | United States, China, India, Germany, United Kingdom, Japan, South Korea and additional country markets |
| Key Companies Profiled | dsm-firmenich, BASF, Glanbia Nutritionals, Prinova, SternVitamin, Mühlenchemie, Hexagon Nutrition |
| Forecast Period | 2026 to 2036 |
| Approach | Hybrid methodology using segment adoption, buyer use cases, country CAGRs, supplier portfolios, and verified public-source signals |
Source: Future Market Insights - analysis driven by proprietary forecasting models and primary research
Wheat Fortification Premix Market - Research Methodology
| Method | Approach |
|---|---|
| Primary Research | FMI analysts reviewed inputs from flour millers, food manufacturers, premix suppliers, bakery processors, procurement heads, and nutrition program buyers. Supplier interviews focused on dosing accuracy, certificate review, micronutrient stability, tender participation, and adoption barriers across industrial milling accounts. |
| Desk Research | Desk research covered official fortification sources, national food processing indicators, regulatory references, company product information, and public nutrition program data. Product relevance was checked against wheat flour fortification, premix blending, bakery application fit, ingredient traceability, and channel suitability across public and private accounts. |
| Market Sizing and Forecasting | The model combined fortified flour demand, premix adoption, product type mix, source preference, application use, and country-level food processing signals. Forecast assumptions were adjusted for mandatory fortification activity, plant-source preference, bakery demand, manufacturer qualification needs, and documentation requirements. |
| Data Validation | Forecasts were checked against fortification coverage rates, flour milling activity, supplier product portfolios, food processing statistics, and country-level staple food consumption indicators. Company portfolios were reviewed to avoid inclusion of adjacent food ingredient products without direct relevance to wheat flour fortification premixes. |
Source: Future Market Insights (FMI) analysis, based on proprietary forecasting model and primary research
Wheat Fortification Premix Market by Segments
Wheat Fortification Premix Market segmented by Product Type:
- Powder
- Liquid
- Granules
- Encapsulated
- Premix
Wheat Fortification Premix Market Segmented by Source:
- Plant
- Microbial
- Animal
- Marine
- Synthetic
Wheat Fortification Premix Market Segmented by Application:
- Bakery
- Beverages
- Dairy
- Snacks
- Infant Nutrition
Wheat Fortification Premix Market Segmented by End User:
- Food Manufacturers
- Foodservice
- Private Label
- Nutraceutical Brands
- Retail
Wheat Fortification Premix Market by Region:
- North America
- United States
- Canada
- Mexico
- Latin America
- Brazil
- Chile
- Rest of Latin America
- Western Europe
- Germany
- United Kingdom
- Italy
- Spain
- France
- Nordic
- BENELUX
- Rest of Western Europe
- Eastern Europe
- Russia
- Poland
- Hungary
- Balkan & Baltic
- Rest of Eastern Europe
- East Asia
- China
- Japan
- South Korea
- South Asia and Pacific
- India
- ASEAN
- Australia & New Zealand
- Rest of South Asia and Pacific
- Middle East & Africa
- Kingdom of Saudi Arabia
- Other GCC Countries
- Türkiye
- South Africa
- Other African Union
- Rest of Middle East & Africa
Research Sources and Bibliography
- Food Fortification Initiative. (2026, June). Global Progress. Food Fortification Initiative.
- Food Fortification Initiative. (2025, May). World Flour Day 2022: Celebrating Flour Fortification’s Legacy. Food Fortification Initiative.
- GAIN Premix Facility. (2026, June). Current suppliers. Global Alliance for Improved Nutrition.
- Food and Agriculture Organization of the United Nations. (2025, June). FAO Food Price Index dips in May amid lower cereal, sugar and vegetable oil prices.
- USA Department of Agriculture Economic Research Service. (2026, April). Ag and Food Statistics: Charting the Essentials - Food Prices and Spending.
- Office for National Statistics. (2025, July). UK manufacturers’ sales by product: 2024.
- USA Department of Agriculture Foreign Agricultural Service. (2026, April). Food Processing Ingredients Annual: Japan.
- USA Department of Agriculture Foreign Agricultural Service. (2026, May). FAIRS Country Report Annual: Korea - Republic of.
- Food Safety and Standards Authority of India. (2026, June). Fortified Food.
- BASF. (2024, February). Bridging the health gaps.
- Glanbia Nutritionals. (2025, March). Custom Premix Solutions Guide.
- SternVitamin. (2026, June). Bakery Fortification | Custom Vitamin Premix Solutions.
- Prinova. (2026, June). Custom Nutrient Premixes & Market Ready Blends.
- Hexagon Nutrition. (2026, June). Wheat Flour Fortification | Premix for Fortified Flour.
- Access to Nutrition Initiative. (2025, September). VitaMin Premix Supplier Assessment 2025.
This bibliography is provided for reader reference and uses primary government, standards-body, official trade body, and company sources.
This Report Answers
- What is the expected value of the wheat fortification premix market in 2026 and 2036?
- What CAGR is forecast for the wheat fortification premix market from 2026 to 2036?
- Which segments shape product type and source demand alongside application and end user demand?
- Which buyer pressures are expected to support wheat fortification premix adoption?
- How do country CAGRs differ across the profiled markets?
- Which companies compete across micronutrient supply and flour fortification application support?
- What evidence should buyers request when qualifying a wheat fortification premix supplier?
- What buyer factors should suppliers address before broader account expansion?
- How do dosing records and documentation affect supplier selection?
Frequently Asked Questions
Why should executives track the Wheat Fortification Premix Market?
Executives should track this market due to the shift from ingredient buying toward fortification compliance and dosage control. Supplier accountability is becoming a separate approval factor for millers and food manufacturers.
What business problem does the Wheat Fortification Premix Market address?
It helps flour millers and food manufacturers deliver micronutrients in wheat products using controlled blends that support quality records and repeat production.
What should procurement leaders evaluate before selecting suppliers?
Procurement leaders should evaluate micronutrient dispersion and certificate accuracy before supplier approval. Batch consistency, technical service, and regional supply continuity should be reviewed during account expansion.
What limits return on investment for buyers?
Return on investment is expected to weaken if mills lack dosing equipment and affordable testing routines. Clear ownership for quality review also affects implementation timing across mill and bakery buyer teams.
How do suppliers build executive confidence?
Suppliers build confidence by providing verified ingredient records and milling support before wider account expansion. Bakery application evidence and practical documentation help tender and retail accounts approve wider purchasing.
Preview the report firsthand - request a free sample
Get SampleGet the brochure for pricing and purchase details.
Get PDFTable of Content
- Key Takeaways
- Market Size and CAGR
- Top Growth Driver
- Fastest Growing Segment
- Leading Region
- Key Companies
- Emerging Opportunities
- Executive Summary
- Global Market Outlook
- Demand-side Trends
- Supply-side Trends
- Technology Roadmap Analysis
- Analysis and Recommendations
- Analyst Perspective (What is happening? Why now? What should investors know?)
- Key Questions Answered
- How large is the market?
- What is the CAGR?
- What are key trends?
- Which region dominates?
- Who are the leaders?
- Market Overview
- Market Coverage / Taxonomy
- Market Definition / Scope / Limitations
- Research Methodology
- Chapter Orientation
- Analytical Lens and Working Hypotheses
- Market Structure, Signals, and Trend Drivers
- Benchmarking and Cross-market Comparability
- Market Sizing, Forecasting, and Opportunity Mapping
- Research Design and Evidence Framework
- Desk Research Programme (Secondary Evidence)
- Expert Input and Fieldwork (Primary Evidence)
- Tooling, Models, and Reference Databases
- Data Engineering and Model Build
- Quality Assurance and Audit Trail
- Market Background
- Market Dynamics (Drivers, Restraints, Opportunity, Trends)
- Scenario Forecast (Optimistic, Likely, Conservative)
- Impact Analysis
- AI Impact
- Sustainability Impact
- Regulatory Impact
- Technology Impact
- Consumer / Buyer Analysis
- Purchase Drivers
- Adoption Barriers
- Buyer Journey
- Opportunity Map Analysis
- Product Life Cycle Analysis
- Supply Chain Analysis
- Investment Feasibility Matrix
- Value Chain Analysis
- PESTLE and Porter's Analysis
- Regulatory Landscape
- Regional Parent Market Outlook
- Production and Consumption Statistics
- Import and Export Statistics
- Global Market Analysis and Forecast, 2021 to 2036
- Historical Market Size Value (USD Million) Analysis, 2021 to 2025
- Current and Future Market Size Value (USD Million) Projections, 2026 to 2036
- Y-o-Y Growth Trend Analysis
- Absolute $ Opportunity Analysis
- Global Market Pricing Analysis, 2021 to 2036
- Global Market Analysis and Forecast, By Product Type , 2021 to 2036
- Introduction / Key Findings
- Historical Market Size Value (USD Million) Analysis By Product Type , 2021 to 2025
- Current and Future Market Size Value (USD Million) Analysis and Forecast By Product Type , 2026 to 2036
- Premix
- Powder
- Liquid
- Granules
- Encapsulated
- Premix
- Y-o-Y Growth Trend Analysis By Product Type , 2021 to 2025
- Absolute $ Opportunity Analysis By Product Type , 2026 to 2036
- Global Market Analysis and Forecast, By Source, 2021 to 2036
- Introduction / Key Findings
- Historical Market Size Value (USD Million) Analysis By Source, 2021 to 2025
- Current and Future Market Size Value (USD Million) Analysis and Forecast By Source, 2026 to 2036
- Plant
- Microbial
- Animal
- Marine
- Synthetic
- Plant
- Y-o-Y Growth Trend Analysis By Source, 2021 to 2025
- Absolute $ Opportunity Analysis By Source, 2026 to 2036
- Global Market Analysis and Forecast, By Application, 2021 to 2036
- Introduction / Key Findings
- Historical Market Size Value (USD Million) Analysis By Application, 2021 to 2025
- Current and Future Market Size Value (USD Million) Analysis and Forecast By Application, 2026 to 2036
- Bakery
- Beverages
- Dairy
- Snacks
- Infant Nutrition
- Bakery
- Y-o-Y Growth Trend Analysis By Application, 2021 to 2025
- Absolute $ Opportunity Analysis By Application, 2026 to 2036
- Global Market Analysis and Forecast, By End User, 2021 to 2036
- Introduction / Key Findings
- Historical Market Size Value (USD Million) Analysis By End User, 2021 to 2025
- Current and Future Market Size Value (USD Million) Analysis and Forecast By End User, 2026 to 2036
- Food Manufacturers
- Foodservice
- Private Label
- Nutraceutical Brands
- Retail
- Food Manufacturers
- Y-o-Y Growth Trend Analysis By End User, 2021 to 2025
- Absolute $ Opportunity Analysis By End User, 2026 to 2036
- Global Market Analysis and Forecast, By Region , 2021 to 2036
- Introduction
- Historical Market Size Value (USD Million) Analysis By Region, 2021 to 2025
- Current Market Size Value (USD Million) Analysis and Forecast By Region, 2026 to 2036
- North America
- Latin America
- Western Europe
- Eastern Europe
- East Asia
- South Asia and Pacific
- Middle East & Africa
- Market Attractiveness Analysis By Region
- North America Market Analysis and Forecast, By Country , 2021 to 2036
- Historical Market Size Value (USD Million) Trend Analysis By Market Taxonomy, 2021 to 2025
- Market Size Value (USD Million) Forecast By Market Taxonomy, 2026 to 2036
- By Country
- USA
- Canada
- Mexico
- By Product Type
- By Source
- By Application
- By End User
- By Country
- Market Attractiveness Analysis
- By Country
- By Product Type
- By Source
- By Application
- By End User
- Key Takeaways
- Latin America Market Analysis and Forecast, By Country
- Historical Market Size Value (USD Million) Trend Analysis By Market Taxonomy, 2021 to 2025
- Market Size Value (USD Million) Forecast By Market Taxonomy, 2026 to 2036
- By Country
- Brazil
- Chile
- Rest of Latin America
- By Product Type
- By Source
- By Application
- By End User
- By Country
- Market Attractiveness Analysis
- By Country
- By Product Type
- By Source
- By Application
- By End User
- Key Takeaways
- Western Europe Market Analysis and Forecast, By Country
- Historical Market Size Value (USD Million) Trend Analysis By Market Taxonomy, 2021 to 2025
- Market Size Value (USD Million) Forecast By Market Taxonomy, 2026 to 2036
- By Country
- Germany
- UK
- Italy
- Spain
- France
- Nordic
- BENELUX
- Rest of Western Europe
- By Product Type
- By Source
- By Application
- By End User
- By Country
- Market Attractiveness Analysis
- By Country
- By Product Type
- By Source
- By Application
- By End User
- Key Takeaways
- Eastern Europe Market Analysis and Forecast, By Country
- Historical Market Size Value (USD Million) Trend Analysis By Market Taxonomy, 2021 to 2025
- Market Size Value (USD Million) Forecast By Market Taxonomy, 2026 to 2036
- By Country
- Russia
- Poland
- Hungary
- Balkan & Baltic
- Rest of Eastern Europe
- By Product Type
- By Source
- By Application
- By End User
- By Country
- Market Attractiveness Analysis
- By Country
- By Product Type
- By Source
- By Application
- By End User
- Key Takeaways
- East Asia Market Analysis and Forecast, By Country
- Historical Market Size Value (USD Million) Trend Analysis By Market Taxonomy, 2021 to 2025
- Market Size Value (USD Million) Forecast By Market Taxonomy, 2026 to 2036
- By Country
- China
- Japan
- South Korea
- By Product Type
- By Source
- By Application
- By End User
- By Country
- Market Attractiveness Analysis
- By Country
- By Product Type
- By Source
- By Application
- By End User
- Key Takeaways
- South Asia and Pacific Market Analysis and Forecast, By Country
- Historical Market Size Value (USD Million) Trend Analysis By Market Taxonomy, 2021 to 2025
- Market Size Value (USD Million) Forecast By Market Taxonomy, 2026 to 2036
- By Country
- India
- ASEAN
- Australia & New Zealand
- Rest of South Asia and Pacific
- By Product Type
- By Source
- By Application
- By End User
- By Country
- Market Attractiveness Analysis
- By Country
- By Product Type
- By Source
- By Application
- By End User
- Key Takeaways
- Middle East & Africa Market Analysis and Forecast, By Country
- Historical Market Size Value (USD Million) Trend Analysis By Market Taxonomy, 2021 to 2025
- Market Size Value (USD Million) Forecast By Market Taxonomy, 2026 to 2036
- By Country
- Kingdom of Saudi Arabia
- Other GCC Countries
- Türkiye
- South Africa
- Other African Union
- Rest of Middle East & Africa
- By Product Type
- By Source
- By Application
- By End User
- By Country
- Market Attractiveness Analysis
- By Country
- By Product Type
- By Source
- By Application
- By End User
- Key Takeaways
- Key Countries Market Analysis
- USA
- Pricing Analysis
- Market Share Analysis, 2025
- By Product Type
- By Source
- By Application
- By End User
- Canada
- Pricing Analysis
- Market Share Analysis, 2025
- By Product Type
- By Source
- By Application
- By End User
- Mexico
- Pricing Analysis
- Market Share Analysis, 2025
- By Product Type
- By Source
- By Application
- By End User
- Brazil
- Pricing Analysis
- Market Share Analysis, 2025
- By Product Type
- By Source
- By Application
- By End User
- Chile
- Pricing Analysis
- Market Share Analysis, 2025
- By Product Type
- By Source
- By Application
- By End User
- Germany
- Pricing Analysis
- Market Share Analysis, 2025
- By Product Type
- By Source
- By Application
- By End User
- UK
- Pricing Analysis
- Market Share Analysis, 2025
- By Product Type
- By Source
- By Application
- By End User
- Italy
- Pricing Analysis
- Market Share Analysis, 2025
- By Product Type
- By Source
- By Application
- By End User
- Spain
- Pricing Analysis
- Market Share Analysis, 2025
- By Product Type
- By Source
- By Application
- By End User
- France
- Pricing Analysis
- Market Share Analysis, 2025
- By Product Type
- By Source
- By Application
- By End User
- India
- Pricing Analysis
- Market Share Analysis, 2025
- By Product Type
- By Source
- By Application
- By End User
- ASEAN
- Pricing Analysis
- Market Share Analysis, 2025
- By Product Type
- By Source
- By Application
- By End User
- Australia & New Zealand
- Pricing Analysis
- Market Share Analysis, 2025
- By Product Type
- By Source
- By Application
- By End User
- China
- Pricing Analysis
- Market Share Analysis, 2025
- By Product Type
- By Source
- By Application
- By End User
- Japan
- Pricing Analysis
- Market Share Analysis, 2025
- By Product Type
- By Source
- By Application
- By End User
- South Korea
- Pricing Analysis
- Market Share Analysis, 2025
- By Product Type
- By Source
- By Application
- By End User
- Russia
- Pricing Analysis
- Market Share Analysis, 2025
- By Product Type
- By Source
- By Application
- By End User
- Poland
- Pricing Analysis
- Market Share Analysis, 2025
- By Product Type
- By Source
- By Application
- By End User
- Hungary
- Pricing Analysis
- Market Share Analysis, 2025
- By Product Type
- By Source
- By Application
- By End User
- Kingdom of Saudi Arabia
- Pricing Analysis
- Market Share Analysis, 2025
- By Product Type
- By Source
- By Application
- By End User
- Türkiye
- Pricing Analysis
- Market Share Analysis, 2025
- By Product Type
- By Source
- By Application
- By End User
- South Africa
- Pricing Analysis
- Market Share Analysis, 2025
- By Product Type
- By Source
- By Application
- By End User
- USA
- Market Structure Analysis
- Competition Dashboard
- Competition Benchmarking
- Market Share Analysis of Top Players
- By Regional
- By Product Type
- By Source
- By Application
- By End User
- Emerging Startups
- Innovation Benchmarking
- Competition Analysis
- Competition Deep Dive
- dsm-firmenich
- Overview
- Product Portfolio
- Profitability by Market Segments (Product/Region/Sales Channel)
- Sales Footprint
- Strategy Overview
- Marketing Strategy
- Product Strategy
- Channel Strategy
- BASF
- Glanbia Nutritionals
- Prinova
- Mühlenchemie
- SternVitamin
- Hexagon Nutrition
- dsm-firmenich
- Case Studies
- Success Stories
- Recent Developments
- Competition Deep Dive
- Assumptions & Acronyms Used


