

- Market Size (2026)
- USD 780.0 Mn
- Forecast (2036)
- USD 1396.9 Mn
- CAGR (2026 to 2036)
- 6.0%
How big is the Premix For Edible Oils Market in 2026?
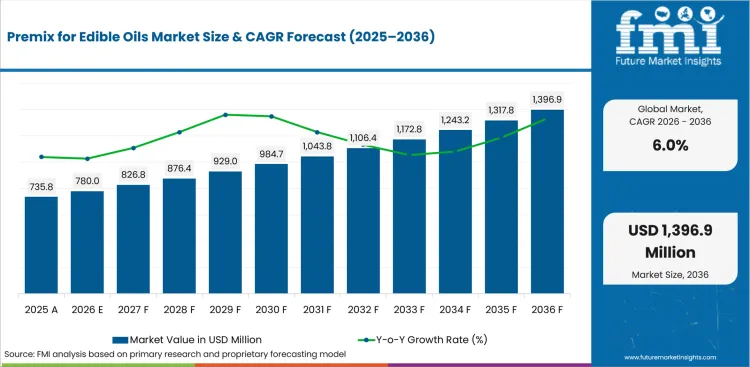
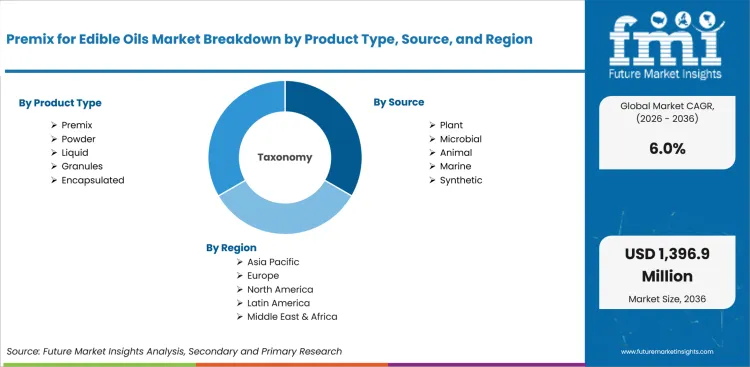
USD 780.0 million in 2026 and USD 1,396.9 million by 2036 at a 6.0% CAGR.
Oil fortification and packaged-food reformulation are moving premix decisions closer to plant operations for food manufacturers. WHO published its 2025 guideline on fortification of edible oils and fats with vitamins A and D, which is expected to raise documentation pressure across processor accounts. Processors that track edible oils and fats now treat premix approval like a production-risk decision instead of a simple additive purchase.
Food manufacturers, private-label packers and fortification agencies are expected to require clearer proof before buying premix systems. Application teams need dispersion records and quality files that protect edible-oil clarity during routine filling. Supplier support tied to food premix programs is likely to reduce handoffs between R&D teams and plant quality managers during launch approval.
Premix value is projected to rise if formulation files connect micronutrient stability and batch handling inside one workflow. Mature markets are likely to weight audit records and traceability depth during supplier approval cycles. Higher-growth markets are expected to weight access and training capacity during early distributor rollout decisions. Procurement teams comparing food fortification suppliers are likely to favor partners that reduce trial failures before annual contracts expand.
| Metric | Value |
|---|---|
| 2025 Market Size | USD 735.8 million |
| 2026 Market Size | USD 780.0 million |
| 2036 Market Size | USD 1,396.9 million |
| Forecast CAGR (2026-2036) | 6.0% |
| Leading Product Type | Premix |
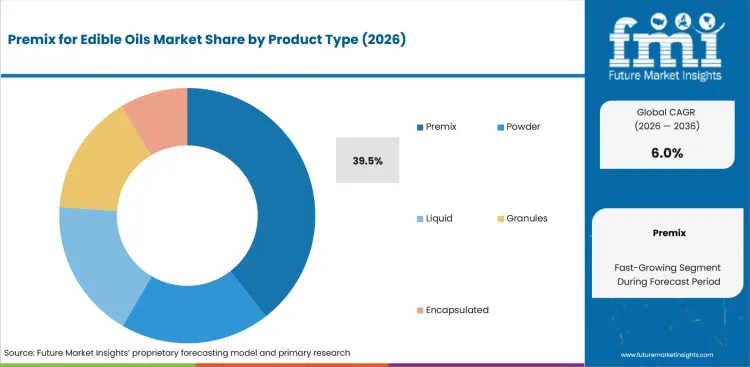
| Premix Share (2026) | 39.5% |
| Leading Source | Plant |
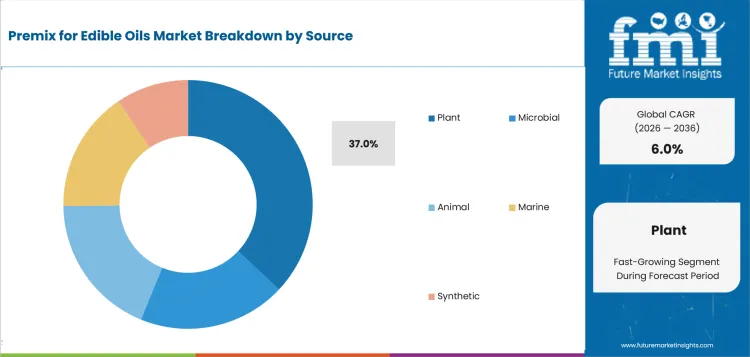
| Plant Share (2026) | 37.0% |
| Leading Application | Edible Oils |
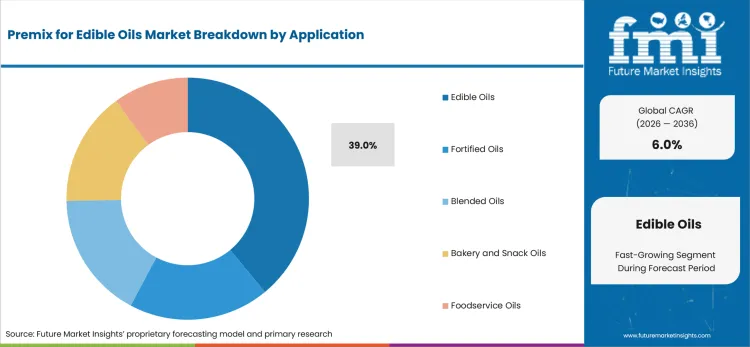
| Edible Oils Share (2026) | 39.0% |
| Fastest-growing Profiled Country | India |
| India CAGR by 2036 | 5.4% |
Summary of the Premix for Edible Oils Market
| Market Signal | Commercial Impact |
|---|---|
| Demand and Growth Drivers | Edible-oil processors are expected to move premix selection toward documented fortification performance and line-ready handling proof. Fortification files are likely to create urgency before brands extend purchase commitments across oil programs.
|
| Product and Segment View | Premix, plant source and edible oils are expected to lead their respective categories in 2026. Food manufacturers add demand depth, supported by processor control over production approvals and line trials during commercial scale-up.
|
| Geography and Growth Outlook | India and China are expected to show faster premix adoption due to edible-oil policy activity and processing scale. The United States and South Korea are likely to grow through documentation-led processor demand.
|
| Competitive Landscape | Competition is expected to focus on vitamin stability, oil-system fit and application support across processor accounts. Suppliers that combine premix files and field service are likely to receive better trial access.
|
| Analyst Perspective | The primary adoption factor is the quality of evidence behind oil-compatible dosage and stability. Suppliers are expected to retain accounts if they reduce testing burden for processors during approval cycles.
|
Source: FMI's proprietary forecasting model and primary research
How is the premix for edible oils market segmented?
The premix for edible oils industry is segmented by product type, source, application, end user, and region.
The premix for edible oils market is segmented by product type, source, application, end user, and region. By product type, the market covers powder, liquid, granules, encapsulated, and premix formats. By source, it covers plant, microbial, animal, marine, and synthetic inputs. By application, it covers edible oils, fortified oils, blended oils, bakery and snack oils, and foodservice oils. By end user, demand covers food manufacturers, foodservice, private label, nutraceutical brands, and retail buyers. Regional coverage includes North America, Latin America, Western Europe, Eastern Europe, East Asia, South Asia and Pacific, and the Middle East and Africa across adjacent fats and oils demand pools.
How does premix shape demand within the product type category?
Product format is expected to decide how quickly processors move from pilot batches to routine oil production. Premix formats reduce weighing steps and help quality teams control micronutrient addition during filling. WHO issued its 2025 edible-oil fortification guideline for vitamins A and D in public health programs. Processors therefore need suppliers that document dispersion behavior before procurement extends across oil brands.
- Premix is expected to account for 39.5% of product type demand in 2026, supported by easier dosing and fewer blending decisions. WHO released its edible-oil fortification guideline in October 2025, and the guideline is expected to raise supplier pressure around vitamin stability records.
- The executive case for premix centers on lower production friction: buyers reduce weighing variation and simplify quality checks. Oil refiners assessing mineral premix alternatives are likely to prefer vendors that provide application files and line-trial support before annual contracts expand.
What supports demand for plant source choices within the source category?
Source choice is projected to affect traceability, allergen review and consumer-facing label language for edible-oil programs. Plant-sourced inputs fit oil-compatible formulation narratives and reduce approval friction for retailers during processor qualification reviews. OECD-FAO reported in 2025 that vegetable-oil food use is projected to rise at 0.5 percent annually. Source records therefore influence premix qualification before labels reach larger buyers across brand approvals.
- Plant is projected to hold 37.0% of source demand in 2026, driven by oil compatibility and traceable ingredient positioning. OECD-FAO projected vegetable-oil food consumption at 27 kg per person in China and Brazil by 2034, which supports source planning for edible-oil processors.
- Brand teams in packaged foods gain from plant sources due to cleaner ingredient narratives and easier consumer explanation. Suppliers connected to sustainable palm oil programs are likely to receive attention if procurement teams review source history and oil-batch documentation together.
How do buyers evaluate edible oils within the application category?
Application choice is anticipated to define whether a premix becomes a routine production input or a limited formulation tool. Edible oils need fat-soluble ingredient behavior and clean dispersion during refining or filling at commercial scale. Fortification adds another control point for batch records during processor audits and retail review cycles. Food companies therefore need premix partners that understand oil clarity and plant-floor handling during commercial rollout.
- Edible oils are anticipated to represent 39.0% of application demand in 2026, attributable to vitamin A and D fortification programs. Processors therefore keep batch records and nutrient-dosage documentation central to supplier qualification.
- For quality teams, edible oils reduce approval ambiguity due to a clear link between premix dosing and finished-pack claims. Packaging managers also review edible oil cans requirements before selecting premix systems that protect label accuracy and batch traceability.
What drives food manufacturers within the end user category?
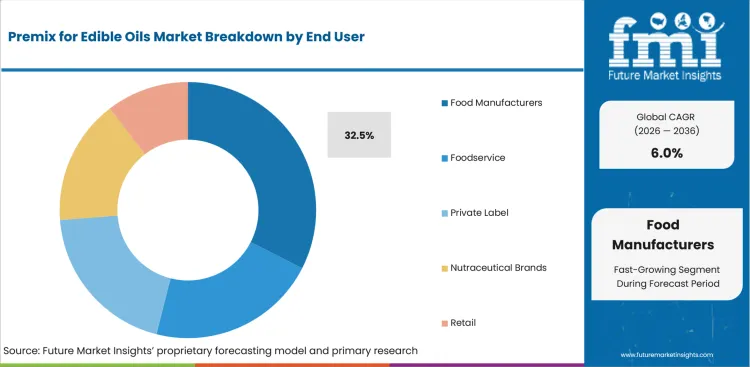
End-user demand is expected to concentrate in accounts that own formulation risk and finished-product quality. Food manufacturers control oil processing, label approval and retailer specifications inside one operating system. They need premixes that reduce failed trial batches and support quality documentation before suppliers receive repeat orders. Supplier value therefore rises if technical teams match ingredient files to plant operating limits during approval reviews.
- Food manufacturers are forecast to hold 32.5% of end-user demand in 2026, owing to direct control over production approval. USDA ERS reported grain and oilseed milling at 10.4% of food and beverage manufacturing sales, which supports the processor relevance of oil-linked premix systems.
- Manufacturing buyers gain from premix suppliers if documentation and trial support reduce internal approval time. Accounts benchmarking USA food premix demand are likely to prioritize suppliers that combine formulation assistance and repeatable batch records before contract scaling.
What are the drivers, restraints, and opportunities in the premix for edible oils market?
Near-term purchases are being shaped by fortification proof, formulation constraint, and processor service expansion outlined below.
- Driver: Edible-oil fortification programs are expected to push processors toward premixes that carry dosage evidence and plant-floor guidance.
- Restraint: Adoption is likely to slow in accounts that lack stability data or documented handling limits for oil systems.
- Opportunity: Processor-backed application service is projected to open access for suppliers that support trials and quality reviews.
Food manufacturers are expected to raise buying activity when fortification projects connect nutritional claims to stable oil processing. Suppliers that provide application support and customer-specific formulation work can reduce approval friction before broader edible-oil programs launch.
Quality teams are likely to delay adoption in accounts that lack stability evidence during heat exposure and storage. Processor quality systems keep supplier files and batch controls central during edible-oil premix qualification.
Implementation barriers create opportunities for vendors that combine application service with documentation support. Buyers are more likely to expand programs when suppliers provide localized product transfer, processor training and evidence for oil-system compatibility.
Which country CAGRs are profiled in the premix for edible oils market?
.webp "Top Country Growth Comparison Premix For Edible Oils Market Cagr (2026 2036)")
| Country | CAGR |
|---|---|
| United States | 3.6% |
| China | 4.5% |
| India | 5.4% |
| Germany | 3.1% |
| United Kingdom | 3.3% |
| Japan | 2.6% |
| South Korea | 3.5% |
Source: FMI's proprietary forecasting model and primary research
How do country-level CAGRs compare in the premix for edible oils market?
Country-level CAGR differences in the premix for edible oils market are expected to reflect processor scale and fortification policy. Documentation discipline also shapes adoption instead of a simple ranking. India at 5.4% CAGR and China at 4.5% CAGR form the higher-growth tier for policy-linked premix demand. The United States at 3.6% CAGR and South Korea at 3.5% CAGR form the mid-tier. Germany, the United Kingdom and Japan show steadier adoption patterns tied to tighter procurement review.
- By 2036, the United States is projected to grow at 3.6% CAGR due to processor documentation and retail scale. The USA Census Bureau reported retail and food services sales of USD 763.7 billion in the latest month. Large retail channels are expected to make edible-oil processors tighten specifications before premix adoption expands across private-label accounts. DSM-Firmenich and BASF are positioned to gain traction in accounts that need vitamin stability files and oil-system documentation.
- China's demand outlook is anticipated to advance at 4.5% CAGR over the assessment period, supported by packaged-food and online channel scale. The National Bureau of Statistics reported that online retail sales reached 15,972.2 billion yuan in 2025. Urban food brands are likely to demand channel-ready oil formulations that keep nutrient claims consistent during retail expansion. Suppliers that provide local technical files are predicted to receive stronger procurement consideration.
- India is forecast to rise at 5.4% CAGR over the forecast period, attributable to edible-oil policy support and processor upgrades. Press Information Bureau reported a National Mission on Edible Oils outlay of Rs 10,103 crore in 2024. Domestic oilseed and fortification programs are expected to increase demand for premixes that help refiners manage micronutrient dosage. Food processors are expected to prioritize suppliers that support plant trials before wider procurement.
- Adoption in Germany is estimated to post 3.1% CAGR over the forecast period, owing to price sensitivity and quality discipline. Destatis reported wholesale prices for edible fats and oils down 7.8% year over year in April 2026. Lower input prices are expected to intensify supplier comparison around premix performance and service costs. Custom premix suppliers are likely to gain discussion space in accounts that demand EU-ready documentation.
- The United Kingdom outlook is projected to record 3.3% CAGR over the assessment period, driven by retail channel recovery and private-label review cycles. Office for National Statistics reported retail sales volumes rose 1.2% in the latest month. Retailers are expected to push oil processors toward cleaner batch records and launch files for fortified oils. Private-label programs are expected to favor suppliers that combine dosage guidance and packaging-ready evidence.
- In Japan, premix for edible oils demand is predicted to advance at 2.6% CAGR over the forecast period due to conservative approval and B2B ordering discipline. METI reported domestic B-to-B e-commerce reached 514.4 trillion yen in 2024. Processor buying is likely to remain selective and documentation-heavy. Suppliers that support measured product transfer are likely to gain repeat discussion in accounts requiring controlled rollout.
- South Korea is estimated to post 3.5% CAGR over the forecast period, supported by mobile commerce and processed-food channel discipline. Statistics Korea reported online shopping transaction value at 25.5770 trillion won in March 2026. Digital retail is expected to increase pressure on label consistency and faster replenishment for edible-oil products. Local technical distributors are expected to receive attention before broader product rollout.
Who are the notable companies in the premix for edible oils market?
DSM-Firmenich, BASF, Glanbia Nutritionals, Prinova, SternVitamin, Hexagon Nutrition, and Vitablend are the notable companies shaping this market.
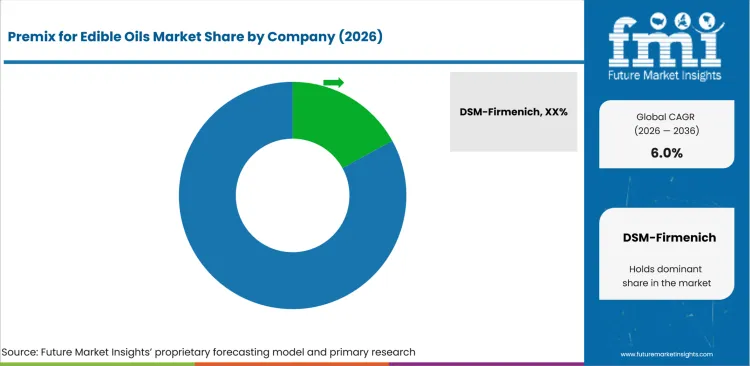
Competition in the premix for edible oils market is expected to split by vitamin expertise, custom blending and application support. DSM-Firmenich and BASF are more suited to vitamin-led fortification accounts that demand formal stability evidence. Glanbia Nutritionals and Prinova gain preference in custom premix programs that need blending flexibility. Hexagon Nutrition and Vitablend are commonly selected in fortified-food accounts that need flexible blending. Industry expansion is expected when suppliers lower trial risk before commercial rollout.
- DSM-Firmenich and BASF focus on vitamin systems that address edible-oil fortification and dosage confidence. Buyers use these portfolios to reduce technical uncertainty before large processor accounts approve broader supply programs.
- Buyers choosing Glanbia Nutritionals or Prinova are typically looking for custom premix fit driven by batch documentation and blending flexibility. These companies help quality teams compare ingredient files before commercial orders expand across processor networks.
- SternVitamin, Hexagon Nutrition and Vitablend gain preference in fortified-food environments supported by premix design and application service. Processor teams use these suppliers if internal teams need practical guidance before reformulation moves into production.
Competitive Benchmarking: Premix for Edible Oils Market
| Company | Vitamin Fit | Oil-System Fit | Geographic Reach | Channel Access |
|---|---|---|---|---|
| DSM-Firmenich | High | High | Global | High |
| BASF | High | High | Global | High |
| Glanbia Nutritionals | High | Medium | Global | High |
| Prinova | High | High | Global | High |
| SternVitamin | High | High | Global | High |
| Hexagon Nutrition | High | Medium | Regional | High |
| Vitablend | High | High | Global | High |
Source: Future Market Insights competitive analysis, 2026. Ratings reflect relative portfolio relevance and workflow fit. Service capability and geographic reach shape the remaining comparison.
Key Developments in the Premix for Edible Oils Market
- In March 2025, DSM-Firmenich partnered with MedAccess to secure vitamin A pricing for edible-oil fortification in low and middle income countries. The collaboration covers stable pricing and supply for a micronutrient used in edible-oil fortification. The move points to a procurement environment in which price assurance and supply continuity influence fortification program planning.
Key Players in the Premix for Edible Oils Market
Vitamin and fortification specialists
- DSM-Firmenich
- BASF
- SternVitamin
- Hexagon Nutrition
- Vitablend
Custom premix and nutrition suppliers
- Glanbia Nutritionals
- Prinova
Premix for Edible Oils Market - Report Scope
| Coverage field | Report scope |
|---|---|
| Market breakdown | Premix for Edible Oils Market Breakdown by product type, source, application, end user, and region |
| Market Definition | Premix for edible oils covers micronutrient and functional blends used by oil processors, food manufacturers and fortification programs to improve edible-oil dosage control. |
| Regions Covered | North America, Latin America, Western Europe, Eastern Europe, East Asia, South Asia and Pacific, and the Middle East and Africa |
| Countries Covered | United States, China, India, Germany, United Kingdom, Japan, South Korea, and additional country markets |
| Key Companies Profiled | DSM-Firmenich, BASF, Glanbia Nutritionals, Prinova, SternVitamin, Hexagon Nutrition, and Vitablend |
| Forecast Period | 2026 to 2036 |
| Approach | Hybrid methodology using segment adoption, buyer use cases, country CAGRs, supplier portfolios, and verified public-source signals |
Source: Future Market Insights - analysis driven by proprietary forecasting models and primary research
Premix for Edible Oils Market - Research Methodology
| Method | Approach |
|---|---|
| Primary Research | FMI analysts reviewed inputs from edible-oil processors and food manufacturers. The review also covered fortification buyers and premix blenders. Interviews focused on micronutrient stability and oil-system compatibility. Analysts also tested dosage control, line-trial barriers and documentation needs. The work tested buyer views on plant sourcing and supplier service expectations. |
| Desk Research | Desk research covered WHO guidance and OECD-FAO outlooks. Analysts also reviewed FDA traceability updates and official country statistics. Product relevance was checked against edible-oil fortification use cases and oil-compatible premix formats. Batch documentation and channel requirements were reviewed separately. Company inclusion required visible activity in premixes or food ingredient application support. |
| Market Sizing and Forecasting | The model combined finished edible-oil demand and fortification adoption. It also considered premix format mix and plant-source preference. Country-level retail access signals were added to the model. Forecast assumptions were adjusted for processor scale and application support needs. Segment shares were cross-checked against product handling fit and buyer approval pathways. |
| Data Validation | Forecasts were checked against official retail activity and supplier portfolios. Country-level food system indicators were used for demand reasonableness checks. Company portfolios were reviewed to avoid counting adjacent ingredients without direct relevance. |
Source: Future Market Insights (FMI) analysis, based on proprietary forecasting model and primary research
Premix for Edible Oils Market by Segments
Premix for Edible Oils Market segmented by Product Type:
- Powder
- Liquid
- Granules
- Encapsulated
- Premix
Premix for Edible Oils Market segmented by Source:
- Plant
- Microbial
- Animal
- Marine
- Synthetic
Premix for Edible Oils Market segmented by Application:
- Edible Oils
- Fortified Oils
- Blended Oils
- Bakery and Snack Oils
- Foodservice Oils
Premix for Edible Oils Market segmented by End User:
- Food Manufacturers
- Foodservice
- Private Label
- Nutraceutical Brands
- Retail
Premix for Edible Oils Market by Region:
- North America
- United States
- Canada
- Mexico
- Latin America
- Brazil
- Chile
- Rest of Latin America
- Western Europe
- Germany
- United Kingdom
- Italy
- Spain
- France
- Nordic
- BENELUX
- Rest of Western Europe
- Eastern Europe
- Russia
- Poland
- Hungary
- Balkan & Baltic
- Rest of Eastern Europe
- East Asia
- China
- Japan
- South Korea
- South Asia and Pacific
- India
- ASEAN
- Australia & New Zealand
- Rest of South Asia and Pacific
- Middle East and Africa
- Kingdom of Saudi Arabia
- Other GCC Countries
- Türkiye
- South Africa
- Other African Union
- Rest of Middle East and Africa
Research Sources and Bibliography
- World Health Organization. (2025, October). WHO guideline on fortification of edible oils and fats with vitamins A and D for public health. World Health Organization.
- Organisation for Economic Co-operation and Development and Food and Agriculture Organization of the United Nations. (2025, July). OECD-FAO Agricultural Outlook 2025-2034. OECD Publishing.
- USA Food and Drug Administration. (2026, June). FSMA Final Rule on Requirements for Additional Traceability Records for Certain Foods. USA Food and Drug Administration.
- USA Census Bureau. (2026, June). Advance Monthly Sales for Retail and Food Services, May 2026. USA Census Bureau.
- National Bureau of Statistics of China. (2026, January). Total Retail Sales of Consumer Goods in December 2025. National Bureau of Statistics of China.
- Press Information Bureau, Government of India. (2025, December). National Mission on Edible Oils. Government of India.
- German Federal Statistical Office. (2026, May). Wholesale prices in April 2026: +6.3% on April 2025. Destatis.
- Office for National Statistics. (2026, June). Retail sales, Great Britain: May 2026. Office for National Statistics.
- Ministry of Economy, Trade and Industry. (2025, August). Results of FY2024 E-Commerce Market Survey Compiled. Government of Japan.
- Ministry of Data and Statistics Republic of Korea. (2026, May). Online Shopping in March 2026. Ministry of Data and Statistics Republic of Korea.
- dsm-firmenich. (2025, March). dsm-firmenich partners with MedAccess to secure vitamin A pricing for edible oil fortification in low to middle income countries. dsm-firmenich.
- BASF. (2025, September). Joint News Release: BASF and Louis Dreyfus Company Complete Sale and Purchase Transaction for BASF’s Food and Health Performance Ingredients Business. BASF.
- Access to Nutrition Initiative. (2025, May). Edible Oil Supplier Index 2025. Access to Nutrition Initiative.
This bibliography is provided for reader reference and uses primary government, standards-body, official trade body, and company sources.
This Report Answers
- What value is expected for the premix for edible oils market in 2026 and 2036?
- What CAGR is forecast for the premix for edible oils market from 2026 to 2036?
- Which product type, source, application and end-user segments shape demand across the parent categories?
- Which buyer pressures are expected to support premix adoption across edible-oil processors and fortification accounts?
- How do country CAGRs differ across the profiled markets and their processor adoption conditions?
- Which companies compete across vitamin expertise, custom premix design and application service for processors?
- Which regulatory and fortification trends shape supplier qualification in edible-oil premix programs?
- What buyer factors should suppliers address before broader processor account expansion across edible-oil programs?
- How do documentation and oil-system stability reviews affect supplier selection in edible-oil premix programs?
Frequently Asked Questions
Why should executives track the Premix for Edible Oils Market?
Executives should track this market due to its link between edible-oil fortification, processor quality control and supplier documentation risk.
What business problem does the Premix for Edible Oils Market address?
The market addresses inconsistent micronutrient addition and batch approval friction across edible-oil processing and packaged-food operations.
What should procurement leaders evaluate before selecting suppliers?
Procurement leaders should evaluate vitamin stability files, oil-system compatibility, batch records, application service and continuity of supply.
What is expected to limit return on investment for buyers?
Return on investment is expected to be limited by weak stability data, poor handling guidance and delayed quality approval.
How are suppliers expected to build executive confidence?
Suppliers are expected to build confidence by providing validated stability records, line-trial support and processor-ready documentation.
Which segment is expected to shape product type demand?
Premix is expected to shape product type demand due to simpler dosing and fewer blending decisions for edible-oil processors.
Preview the report firsthand - request a free sample
Get SampleGet the brochure for pricing and purchase details.
Get PDFTable of Content
- Key Takeaways
- Market Size and CAGR
- Top Growth Driver
- Fastest Growing Segment
- Leading Region
- Key Companies
- Emerging Opportunities
- Executive Summary
- Global Market Outlook
- Demand-side Trends
- Supply-side Trends
- Technology Roadmap Analysis
- Analysis and Recommendations
- Analyst Perspective (What is happening? Why now? What should investors know?)
- Key Questions Answered
- How large is the market?
- What is the CAGR?
- What are key trends?
- Which region dominates?
- Who are the leaders?
- Market Overview
- Market Coverage / Taxonomy
- Market Definition / Scope / Limitations
- Research Methodology
- Chapter Orientation
- Analytical Lens and Working Hypotheses
- Market Structure, Signals, and Trend Drivers
- Benchmarking and Cross-market Comparability
- Market Sizing, Forecasting, and Opportunity Mapping
- Research Design and Evidence Framework
- Desk Research Programme (Secondary Evidence)
- Expert Input and Fieldwork (Primary Evidence)
- Tooling, Models, and Reference Databases
- Data Engineering and Model Build
- Quality Assurance and Audit Trail
- Market Background
- Market Dynamics (Drivers, Restraints, Opportunity, Trends)
- Scenario Forecast (Optimistic, Likely, Conservative)
- Impact Analysis
- AI Impact
- Sustainability Impact
- Regulatory Impact
- Technology Impact
- Consumer / Buyer Analysis
- Purchase Drivers
- Adoption Barriers
- Buyer Journey
- Opportunity Map Analysis
- Product Life Cycle Analysis
- Supply Chain Analysis
- Investment Feasibility Matrix
- Value Chain Analysis
- PESTLE and Porter's Analysis
- Regulatory Landscape
- Regional Parent Market Outlook
- Production and Consumption Statistics
- Import and Export Statistics
- Global Market Analysis and Forecast, 2021 to 2036
- Historical Market Size Value (USD Million) Analysis, 2021 to 2025
- Current and Future Market Size Value (USD Million) Projections, 2026 to 2036
- Y-o-Y Growth Trend Analysis
- Absolute $ Opportunity Analysis
- Global Market Pricing Analysis, 2021 to 2036
- Global Market Analysis and Forecast, By Product Type, 2021 to 2036
- Introduction / Key Findings
- Historical Market Size Value (USD Million) Analysis By Product Type, 2021 to 2025
- Current and Future Market Size Value (USD Million) Analysis and Forecast By Product Type, 2026 to 2036
- Premix
- Powder
- Liquid
- Granules
- Encapsulated
- Premix
- Y-o-Y Growth Trend Analysis By Product Type, 2021 to 2025
- Absolute $ Opportunity Analysis By Product Type, 2026 to 2036
- Global Market Analysis and Forecast, By Source, 2021 to 2036
- Introduction / Key Findings
- Historical Market Size Value (USD Million) Analysis By Source, 2021 to 2025
- Current and Future Market Size Value (USD Million) Analysis and Forecast By Source, 2026 to 2036
- Plant
- Microbial
- Animal
- Marine
- Synthetic
- Plant
- Y-o-Y Growth Trend Analysis By Source, 2021 to 2025
- Absolute $ Opportunity Analysis By Source, 2026 to 2036
- Global Market Analysis and Forecast, By Application, 2021 to 2036
- Introduction / Key Findings
- Historical Market Size Value (USD Million) Analysis By Application, 2021 to 2025
- Current and Future Market Size Value (USD Million) Analysis and Forecast By Application, 2026 to 2036
- Edible Oils
- Fortified Oils
- Blended Oils
- Bakery and Snack Oils
- Foodservice Oils
- Edible Oils
- Y-o-Y Growth Trend Analysis By Application, 2021 to 2025
- Absolute $ Opportunity Analysis By Application, 2026 to 2036
- Global Market Analysis and Forecast, By End User, 2021 to 2036
- Introduction / Key Findings
- Historical Market Size Value (USD Million) Analysis By End User, 2021 to 2025
- Current and Future Market Size Value (USD Million) Analysis and Forecast By End User, 2026 to 2036
- Food Manufacturers
- Foodservice
- Private Label
- Nutraceutical Brands
- Retail
- Food Manufacturers
- Y-o-Y Growth Trend Analysis By End User, 2021 to 2025
- Absolute $ Opportunity Analysis By End User, 2026 to 2036
- Global Market Analysis and Forecast, By Region, 2021 to 2036
- Introduction
- Historical Market Size Value (USD Million) Analysis By Region, 2021 to 2025
- Current Market Size Value (USD Million) Analysis and Forecast By Region, 2026 to 2036
- North America
- Latin America
- Western Europe
- Eastern Europe
- East Asia
- South Asia and Pacific
- Middle East & Africa
- Market Attractiveness Analysis By Region
- North America Market Analysis and Forecast, By Country, 2021 to 2036
- Historical Market Size Value (USD Million) Trend Analysis By Market Taxonomy, 2021 to 2025
- Market Size Value (USD Million) Forecast By Market Taxonomy, 2026 to 2036
- By Country
- USA
- Canada
- Mexico
- By Product Type
- By Source
- By Application
- By End User
- By Country
- Market Attractiveness Analysis
- By Country
- By Product Type
- By Source
- By Application
- By End User
- Key Takeaways
- Latin America Market Analysis and Forecast, By Country
- Historical Market Size Value (USD Million) Trend Analysis By Market Taxonomy, 2021 to 2025
- Market Size Value (USD Million) Forecast By Market Taxonomy, 2026 to 2036
- By Country
- Brazil
- Chile
- Rest of Latin America
- By Product Type
- By Source
- By Application
- By End User
- By Country
- Market Attractiveness Analysis
- By Country
- By Product Type
- By Source
- By Application
- By End User
- Key Takeaways
- Western Europe Market Analysis and Forecast, By Country
- Historical Market Size Value (USD Million) Trend Analysis By Market Taxonomy, 2021 to 2025
- Market Size Value (USD Million) Forecast By Market Taxonomy, 2026 to 2036
- By Country
- Germany
- UK
- Italy
- Spain
- France
- Nordic
- BENELUX
- Rest of Western Europe
- By Product Type
- By Source
- By Application
- By End User
- By Country
- Market Attractiveness Analysis
- By Country
- By Product Type
- By Source
- By Application
- By End User
- Key Takeaways
- Eastern Europe Market Analysis and Forecast, By Country
- Historical Market Size Value (USD Million) Trend Analysis By Market Taxonomy, 2021 to 2025
- Market Size Value (USD Million) Forecast By Market Taxonomy, 2026 to 2036
- By Country
- Russia
- Poland
- Hungary
- Balkan & Baltic
- Rest of Eastern Europe
- By Product Type
- By Source
- By Application
- By End User
- By Country
- Market Attractiveness Analysis
- By Country
- By Product Type
- By Source
- By Application
- By End User
- Key Takeaways
- East Asia Market Analysis and Forecast, By Country
- Historical Market Size Value (USD Million) Trend Analysis By Market Taxonomy, 2021 to 2025
- Market Size Value (USD Million) Forecast By Market Taxonomy, 2026 to 2036
- By Country
- China
- Japan
- South Korea
- By Product Type
- By Source
- By Application
- By End User
- By Country
- Market Attractiveness Analysis
- By Country
- By Product Type
- By Source
- By Application
- By End User
- Key Takeaways
- South Asia and Pacific Market Analysis and Forecast, By Country
- Historical Market Size Value (USD Million) Trend Analysis By Market Taxonomy, 2021 to 2025
- Market Size Value (USD Million) Forecast By Market Taxonomy, 2026 to 2036
- By Country
- India
- ASEAN
- Australia & New Zealand
- Rest of South Asia and Pacific
- By Product Type
- By Source
- By Application
- By End User
- By Country
- Market Attractiveness Analysis
- By Country
- By Product Type
- By Source
- By Application
- By End User
- Key Takeaways
- Middle East & Africa Market Analysis and Forecast, By Country
- Historical Market Size Value (USD Million) Trend Analysis By Market Taxonomy, 2021 to 2025
- Market Size Value (USD Million) Forecast By Market Taxonomy, 2026 to 2036
- By Country
- Kingdom of Saudi Arabia
- Other GCC Countries
- Türkiye
- South Africa
- Other African Union
- Rest of Middle East & Africa
- By Product Type
- By Source
- By Application
- By End User
- By Country
- Market Attractiveness Analysis
- By Country
- By Product Type
- By Source
- By Application
- By End User
- Key Takeaways
- Key Countries Market Analysis
- USA
- Pricing Analysis
- Market Share Analysis, 2025
- By Product Type
- By Source
- By Application
- By End User
- Canada
- Pricing Analysis
- Market Share Analysis, 2025
- By Product Type
- By Source
- By Application
- By End User
- Mexico
- Pricing Analysis
- Market Share Analysis, 2025
- By Product Type
- By Source
- By Application
- By End User
- Brazil
- Pricing Analysis
- Market Share Analysis, 2025
- By Product Type
- By Source
- By Application
- By End User
- Chile
- Pricing Analysis
- Market Share Analysis, 2025
- By Product Type
- By Source
- By Application
- By End User
- Germany
- Pricing Analysis
- Market Share Analysis, 2025
- By Product Type
- By Source
- By Application
- By End User
- UK
- Pricing Analysis
- Market Share Analysis, 2025
- By Product Type
- By Source
- By Application
- By End User
- Italy
- Pricing Analysis
- Market Share Analysis, 2025
- By Product Type
- By Source
- By Application
- By End User
- Spain
- Pricing Analysis
- Market Share Analysis, 2025
- By Product Type
- By Source
- By Application
- By End User
- France
- Pricing Analysis
- Market Share Analysis, 2025
- By Product Type
- By Source
- By Application
- By End User
- India
- Pricing Analysis
- Market Share Analysis, 2025
- By Product Type
- By Source
- By Application
- By End User
- ASEAN
- Pricing Analysis
- Market Share Analysis, 2025
- By Product Type
- By Source
- By Application
- By End User
- Australia & New Zealand
- Pricing Analysis
- Market Share Analysis, 2025
- By Product Type
- By Source
- By Application
- By End User
- China
- Pricing Analysis
- Market Share Analysis, 2025
- By Product Type
- By Source
- By Application
- By End User
- Japan
- Pricing Analysis
- Market Share Analysis, 2025
- By Product Type
- By Source
- By Application
- By End User
- South Korea
- Pricing Analysis
- Market Share Analysis, 2025
- By Product Type
- By Source
- By Application
- By End User
- Russia
- Pricing Analysis
- Market Share Analysis, 2025
- By Product Type
- By Source
- By Application
- By End User
- Poland
- Pricing Analysis
- Market Share Analysis, 2025
- By Product Type
- By Source
- By Application
- By End User
- Hungary
- Pricing Analysis
- Market Share Analysis, 2025
- By Product Type
- By Source
- By Application
- By End User
- Kingdom of Saudi Arabia
- Pricing Analysis
- Market Share Analysis, 2025
- By Product Type
- By Source
- By Application
- By End User
- Türkiye
- Pricing Analysis
- Market Share Analysis, 2025
- By Product Type
- By Source
- By Application
- By End User
- South Africa
- Pricing Analysis
- Market Share Analysis, 2025
- By Product Type
- By Source
- By Application
- By End User
- USA
- Market Structure Analysis
- Competition Dashboard
- Competition Benchmarking
- Market Share Analysis of Top Players
- By Regional
- By Product Type
- By Source
- By Application
- By End User
- Emerging Startups
- Innovation Benchmarking
- Competition Analysis
- Competition Deep Dive
- DSM-Firmenich
- Overview
- Product Portfolio
- Profitability by Market Segments (Product/Region/Sales Channel)
- Sales Footprint
- Strategy Overview
- Marketing Strategy
- Product Strategy
- Channel Strategy
- BASF
- SternVitamin
- Hexagon Nutrition
- Vitablend
- Glanbia Nutritionals
- Prinova
- DSM-Firmenich
- Case Studies
- Success Stories
- Recent Developments
- Competition Deep Dive
- Assumptions & Acronyms Used


