

- Market Size (2026)
- USD 8.8 Bn
- Forecast (2036)
- USD 14.6 Bn
- CAGR (2026 to 2036)
- 5.2%
How big is the Food & Beverage Grade CO2 (Carbon Dioxide) Market in 2026?
USD 8.8 billion in 2026 and USD 14.6 billion by 2036 at a 5.2% CAGR.
Sales of food & beverage grade CO2 are projected to expand from USD 8.8 billion in 2026 to USD 14.6 billion by 2036. The industry is tied to the same purification and distribution discipline used across food grade industrial gases. Beverage plants and packaged-food processors buy gas after the source, impurity limits and delivery route are documented. Growth is therefore expected to depend on repeat supply reliability instead of broad industrial gas demand.
The FDA Substances Added to Food inventory lists carbon dioxide with 21 CFR 184.1240. EUR-Lex published Commission Regulation (EU) 2025/2058 in October 2025, and the entry includes E 290 carbon dioxide in the food-additive framework. These rules make documentation a buying condition because each plant must connect purity records with HACCP controls and the intended use.
-market-value-analysis.webp "Food & Beverage Grade Co2 (carbon Dioxide) Market Value Analysis")
Key Takeaways of Food & Beverage Grade CO2 (Carbon Dioxide) Market
- Demand for food and beverage grade CO2 is shaped by carbonation, modified-atmosphere packaging, dry ice, and chilling applications, with purity records, source traceability, and delivery continuity influencing supplier selection.
- By source, Ammonia/Fertilizer holds 56.3% share in 2026, while Beer/Beverage Carbonation accounts for 46.5% share in 2026 within application, reflecting large-scale recovered CO2 streams and recurring consumption across beverage filling operations.
- Beverage Grade represents 52.0% share in 2026, while Bulk Liquid accounts for 48.0% share in 2026 within supply mode, reflecting strict impurity requirements for drinks and the storage efficiency of tank-based delivery for high-volume users.
- China records the highest country CAGR at 6.7% through 2036, followed by the Netherlands at 6.3% and the United States at 5.9%, reflecting differences in beverage production, local CO2 recovery, food processing activity, and distribution infrastructure.
- Competition centers on Linde, Air Liquide, Messer, Nippon Gases, Air Products, and SOL Group, with competitive positioning spanning food-grade gas portfolios, recovery assets, purification capabilities, bulk delivery, and regional distribution networks.
Analyst Perspective
"The food & beverage grade CO2 (carbon dioxide) market is increasingly shaped by purity consistency and supply reliability rather than production capacity alone. Beverage and food processors are evaluating impurity control, delivery performance, and source traceability because quality variation can disrupt sensitive production processes. Suppliers that maintain stable specifications, transparent quality controls, and dependable delivery will strengthen long-term customer confidence."
- Nandini Roy Choudhury, Principal Analyst at Future Market Insights
Source: FMI's proprietary forecasting model and primary research
How is the Food & Beverage Grade CO2 (Carbon Dioxide) Market segmented?
The food & beverage grade CO2 (carbon dioxide) industry is segmented by source, application, grade and purity, supply mode, end use, and region.
The segmentation framework separates the way CO2 is recovered from the point where it is used. Source analysis covers ammonia/fertilizer and bioethanol fermentation together with natural gas and recovered CO2. Application analysis follows beer and beverage carbonation through MAP packaging, dry ice handling and chilling. Grade and purity categories separate beverage grade from food processing grade and specialty high-purity gas. Supply mode compares bulk liquid with cylinders, onsite recovery and merchant delivery across industrial gases purchasing. End-use analysis covers breweries and soft drink plants together with packaged food processors and cold-chain users. Regional analysis shows where regulation, local source access and route density change qualification cost.
Why does ammonia/fertilizer lead the source category?
-market-analysis-by-source.webp "Food & Beverage Grade Co2 (carbon Dioxide) Market Analysis By Source")
Ammonia/Fertilizer remains the largest source category because ammonia and fertilizer operations generate concentrated CO2 streams that can be recovered and purified at scale. The source still needs strict contaminant control before it reaches beverage plants. The commercial value appears when purification records and delivery performance remain stable across repeated batches.
- Ammonia/Fertilizer is expected to hold 56.3% share in 2026 due to its position as a high-volume recovered gas stream. Food-use acceptance depends on purification results and a clear change-control file.
- Gas companies using this source need impurity testing and source-change records that match beverage audit requirements. Large accounts approve routine delivery only after the same specification holds across several shipments.
What supports beer/beverage carbonation within the application category?
-market-analysis-by-application.webp "Food & Beverage Grade Co2 (carbon Dioxide) Market Analysis By Application")
Beer and beverage carbonation is the central use case because CO2 affects taste, pressure and foam stability together. Beverage plants use CO2 throughout production, so delivery gaps can stop filling lines. The application connects directly with ready-to-drink beverages and on-premise beer systems.
- Beer/Beverage Carbonation is forecast to represent 46.5% share in 2026 owing to continuous consumption across breweries and soft drink plants. The category needs steady tank pressure and predictable refills.
- The application benefits from growth in drink cans because carbonation pressure and package performance must be checked together. Suppliers that support both gas quality and delivery timing gain stronger account retention.
How is beverage grade positioned within the grade and purity category?
Beverage Grade is expected to lead because carbonation requires low impurity limits and clear sensory control. The grade is not interchangeable with broad industrial CO2 when benzene, sulfur and odor controls are part of the purchasing file. Food certification provides a wider comparison for routine supplier review.
- Beverage Grade is estimated to account for 52.0% share in 2026 since beverage applications carry strict taste and impurity requirements. This share reflects repeated use in carbonated drinks and beer.
- Food Processing Grade remains relevant for MAP, chilling and dry ice handling. These uses still need food-use documentation even when the performance test differs from beverage carbonation.
Why does bulk Liquid lead the supply mode category?
Bulk liquid supply is favored by large beverage and packaged food sites because it reduces cylinder handling and gives plants a steadier storage base. The format works best where route density supports scheduled tank delivery. Cylinder supply remains important for smaller users and emergency top-ups.
- Bulk Liquid is projected to hold 48.0% share in 2026 as high-volume plants move toward tank-based delivery. The format lowers handling effort and improves planning during seasonal demand peaks.
- Onsite recovery is expected to gain interest at large fermentation sites. Adoption still depends on purification cost and stable plant utilization before capital approval becomes practical.
What makes beverage producers central within end use?
Beverage producers account for the most visible commercial demand because CO2 is used directly in product performance and filling-line control. Soft drinks and beer require consistent gas before production schedules are locked. Sparkling water and non alcoholic RTD beverages add further demand. Packaged food processors add demand through MAP and cold-chain applications.
- Beverage Producers are expected to capture 42.0% share in 2026 since carbonation is a repeated production input. The segment values supply continuity more than one-time spot availability.
- Packaged food processors are expected to increase qualification work as MAP and dry ice uses expand. Food and beverage additives procurement shows a similar shift toward documentation and application proof.
What are the drivers, restraints, and opportunities in the Food & Beverage Grade CO2 (Carbon Dioxide) Market?
Purity documentation, beverage production demand and recovered-source reliability are shaping purchase decisions across food and beverage CO2 accounts.
- Driver: Beverage carbonation and MAP packaging require CO2 that passes food-use specifications before regular purchase orders are released.
- Restraint: Source dependence creates exposure to outages at ethanol, ammonia and natural gas processing sites that feed merchant CO2 networks.
- Opportunity: Better recovery controls help gas producers win accounts that need stronger audit evidence across multiple food and beverage plants.
Demand is expected to rise where beverage and packaged-food plants connect CO2 purchasing with product quality. The market connection becomes stronger when processors use carbonation, MAP or dry ice at a scale that justifies qualified gas contracts.
Supply risk is expected to restrain purchasing because food-grade CO2 often depends on byproduct recovery from other industrial processes. Ethanol and ammonia plants may reduce output or pause operations for maintenance, which can tighten regional availability. Procurement teams are expected to assign more value to dual sourcing and nearby storage. Delivered price becomes harder to manage when spot replacement gas must travel farther.
The main opportunity is expected to come from higher-confidence qualification. Trace impurity testing, source records and HACCP documentation can shorten the review cycle for beverage plants that switch gas providers. That advantage supports dry ice demand in chilled food distribution and cold-chain handling. Commercial expansion is expected to favor companies that prove purity and availability together.
Which country CAGRs are profiled in the Food & Beverage Grade CO2 (Carbon Dioxide) Market?
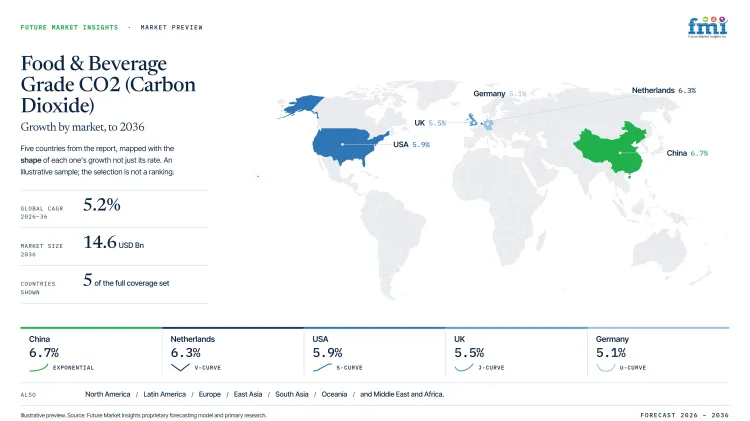
| Country | CAGR |
|---|---|
| USA | 5.9% |
| Germany | 5.1% |
| UK | 5.5% |
| China | 6.7% |
| Netherlands | 6.3% |
How do country-level CAGRs compare in the Food & Beverage Grade CO2 (Carbon Dioxide) Market?
A global growth rate represents the weighted average of all markets included in the analysis. It can sit above some country rates and below others depending on their market weights. The global CAGR of 5.2% falls within the profiled country range. This indicates that markets outside the chart may include both slower and quicker development rates. The five countries presented are illustrative examples and their comparison with the global figure makes this variation visible.
- The countries are distinguished less by their CAGRs and more by the spacing between their development models. The full range between China and Germany is 1.6 percentage points. Each neighboring position is separated by 0.4 percentage points. This creates a compressed comparison without a pronounced gap between country groups.
- China and the Netherlands form a closely aligned upper cluster. China benefits from expanding beverage output and packaged consumption channels that support larger delivery routes. The Netherlands follows through compact logistics and dense food retail activity which improve delivery efficiency.
- The USA occupies the central position through ethanol-linked recovery capacity and a broad packaged-food base. The UK remains close in CAGR terms but follows a different commercial route through beverage regulation and flexible production requirements. Germany is positioned outside the upper cluster as brewery demand faces volume pressure and supplier changes require careful purity review.
- Markets with broadly similar CAGRs can therefore create different entry conditions for food-grade CO2 suppliers. Commercial timing depends on nearby recovery sources and route density while qualification depends on impurity controls and documented supply continuity.
The full report examines these differences across every market included in the study. The full report provides country-level CAGR analysis across North America, Latin America, Europe, East Asia, South Asia, Oceania and the Middle East and Africa.
Country-wise Analysis
- USA combines recovery capacity tied to ethanol production with beverage and packaged-food plants that need qualified bulk delivery across several states. Food and beverage grade CO2 demand in the USA is forecast to rise at 5.9% CAGR from 2026 to 2036. The USA Energy Information Administration reported in September 2025 that 191 USA fuel ethanol plants had annual capacity of 18,477 million gallons at the start of 2025. The capacity base gives gas producers a measurable source network for fermentation-derived CO2. Suppliers should still qualify each stream carefully because food-use buyers purchase traceable purity and delivery reliability.
- Germany combines brewery demand with a food-processing base that reviews purity records before gas supplier changes. Adoption in Germany is projected to advance at 5.1% CAGR through 2036. Destatis reported in February 2026 that German beer producers and storage establishments sold roughly 7.8 billion litres of beer in 2025. The same release reported a 6.0% sales decline from 2024, so carbonation demand needs to be read with volume pressure in mind. Supplier selection should focus on reliable recovery, impurity checks and stable delivery routes.
- UK demand is shaped by beverage production, packaged-food output and soft drink rules that influence formulation decisions. The UK is expected to record 5.5% CAGR during the forecast period. The Office for National Statistics reported in July 2026 that output for food products, beverages and tobacco rose 1.7% in the three months to May 2026. HMRC reported in February 2026 that provisional SDIL export credit for Q2 2025 to 2026 was GBP 13.0 million. Gas suppliers need flexible contracts because beverage accounts may adjust recipes and production runs under tax and labeling pressure.
- China is expected to hold the fastest profiled growth due to beverage output and large packaged-consumption channels. Demand in China is forecast to rise at 6.7% CAGR from 2026 to 2036. The National Bureau of Statistics reported in July 2026 that manufacture of liquor, beverages and refined tea increased by 6.1% in June 2026. The State Council reported in July 2026 that total retail sales of goods and services rose 2.7% year on year in the first half of 2026. Gas producers still need nearby purification and storage because long delivery routes can weaken the cost case.
- Netherlands has a compact distribution geography and a dense base of food retail, hospitality and cold-chain users. Food and beverage grade CO2 demand in Netherlands is anticipated to expand at 6.3% CAGR through 2036. Statistics Netherlands reported in June 2026 that retail turnover was 3.4% higher in April 2026 than a year earlier. Eurostat reported in July 2026 that EU retail trade volume for food, drinks and tobacco increased 0.6% in May 2026 from April 2026. Route density supports efficient delivery, but small-market exposure makes nearby outages visible quickly.
Who are the notable companies in the Food & Beverage Grade CO2 (Carbon Dioxide) Market?
Linde, Air Liquide, Messer, Air Products, Nippon Gases and SOL Group are notable companies shaping food and beverage grade CO2 supply.
-market-analysis-by-company.webp "Food & Beverage Grade Co2 (carbon Dioxide) Market Analysis By Company")
The competitive outlook combines global industrial gas groups with regional specialists that own recovery, purification and distribution capability. Food and beverage accounts compare providers on purity control, tank support and emergency delivery planning. Official company material shows direct activity in the exact value chain, including food-grade CO2 plants and cryogenic food systems. Contract wins are expected to depend on local supply coverage as much as headline capacity.
Air Liquide and Nippon Gases have both disclosed new CO2 plants that serve food and beverage uses. Air Products has disclosed a new South African CO2 facility with food safety certification. Messer and SOL Group remain in the competitive set because food and beverage accounts still review regional gas coverage and cryogenic food support. These disclosures support company inclusion without relying on broad product pages or aggregator references.
- Linde and Air Liquide compete through large food and beverage gas portfolios. Their advantage is strongest where bulk tanks, delivery routes and quality files must operate across several sites.
- Messer and Nippon Gases compete through regional supply positions and recovery projects. Customers value these providers when local production reduces the risk of long-haul replacement gas.
- Air Products and SOL Group support food applications through CO2 production, cryogenic equipment and food safety systems. The commercial test is whether delivery and documentation remain consistent during peak demand.
Competitive Benchmarking: Food & Beverage Grade CO2 (Carbon Dioxide) Market
| Company | Food-Grade CO2 Supply | Beverage and Food Applications | Regional Delivery Strength | Geographic Reach |
|---|---|---|---|---|
| Linde | High | High | High | Global |
| Air Liquide | High | High | High | Global |
| Messer | High | Medium | High | Europe, Americas and Asia |
| Air Products | Medium | High | Medium | Global |
| Nippon Gases | High | High | Medium | Europe |
| SOL Group | Medium | High | Medium | Europe and selected international markets |
Key Developments in the Food & Beverage Grade CO2 (Carbon Dioxide) Market
- In May 2025, Air Liquide: Air Liquide Australia signed an agreement with Manildra Group to build a food and beverage grade CO2 plant in Bomaderry. The announced plant has production capacity above 90,000 tonnes per year. The project is expected to strengthen local supply for beverage and food customers that need biogenic CO2.
- In September 2025, Nippon Gases: Nippon Gases opened a CO2 processing plant in Zörbig in Germany. The plant produces food-grade liquid CO2 and dry ice from residual CO2 generated by nearby bioethanol production. This improves regional access to recovered CO2 for beverage and frozen food applications.
- In December 2025, Air Products: Air Products South Africa announced ISO/IEC 17025:2017 accreditation for cryogenic and liquid CO2 flowmeter work. The accreditation supports measurement confidence for liquid carbon dioxide deliveries. This matters for customers that need accurate billing and controlled receiving records.
Key Players in the Food & Beverage Grade CO2 (Carbon Dioxide) Market
Core Technology and Ingredient Developers
- Linde
- Messer
Scaled Manufacturing and Supply Groups
- Air Liquide
- Nippon Gases
Application and Commercialization Specialists
- Air Products
- SOL Group
Food & Beverage Grade CO2 (Carbon Dioxide) Market - Report Scope
-market-breakdown-by-source,-application,-and-region.webp "Food & Beverage Grade Co2 (carbon Dioxide) Market Breakdown By Source, Application, And Region")
| Coverage field | Report scope |
|---|---|
| Market breakdown | Source, application, grade and purity, supply mode, end use, and region. |
| Market Definition | Food and beverage grade carbon dioxide supplied for carbonation, modified atmosphere packaging, chilling, freezing, dry ice and other food-use processes after purification and documentation review. |
| Regions Covered | North America, Latin America, Europe, East Asia, South Asia, Oceania, and Middle East and Africa. |
| Countries Covered | USA, Germany, UK, China and Netherlands, with 30+ countries covered in the full report. |
| Key Companies Profiled | Linde, Air Liquide, Messer, Air Products, Nippon Gases and SOL Group. |
| Forecast Period | 2026 to 2036. |
| Approach | Hybrid bottom-up and top-down market sizing supported by primary interviews and official desk research. |
Food & Beverage Grade CO2 (Carbon Dioxide) Market - Research Methodology
| Method | Approach |
|---|---|
| Primary Research | FMI analysts gathered input from manufacturers, service providers, technology developers, distributors, end users, procurement teams, and subject-matter experts. Interviews examined purchasing decisions, product or service evaluation, adoption barriers, approval requirements, pricing considerations, and expectations for technical or commercial support. Respondents were also asked what evidence is required before a trial, pilot, or initial order develops into regular purchasing. |
| Desk Research | Desk research covered government statistics, regulatory publications, trade data, industry associations, technical literature, standards, company filings, product information, and official corporate announcements. Sources were reviewed for relevance, publication date, geographic coverage, and consistency with the defined market scope. Claims relating to performance, applications, approvals, capacity, investment, and commercial activity were retained only when supported by credible public evidence. |
| Market Sizing and Forecasting | The market model combined the baseline value with historical performance, segment structure, pricing and volume indicators, adoption levels, company participation, and country-level demand conditions. Forecast assumptions considered economic activity, investment trends, regulatory developments, technology adoption, purchasing cycles, supply availability, and barriers to wider market use. Segment and regional estimates were reconciled before the final market total was calculated. |
| Data Validation | Estimates were checked against multiple independent indicators, including public data, company activity, trade patterns, industry developments, and findings from primary interviews. Validation also tested whether products, services, applications, and company revenues fell within the defined market boundaries. Adjacent categories, unsupported claims, overlapping revenues, and activities without direct market relevance were excluded to reduce double counting and maintain consistency across segments and countries. |
Food & Beverage Grade CO2 (Carbon Dioxide) Market by Segments
Food & Beverage Grade CO2 (Carbon Dioxide) Market segmented by Source:
- Ammonia/Fertilizer
- Bioethanol Fermentation
- Natural Gas Processing
- Recovered and Purified CO2
- Other Industrial Recovery Streams
Food & Beverage Grade CO2 (Carbon Dioxide) Market segmented by Application:
- Beer/Beverage Carbonation
- MAP Packaging
- Dry Ice
- Chilling and Freezing
- pH Control and Processing Uses
Food & Beverage Grade CO2 (Carbon Dioxide) Market segmented by Grade and Purity:
- Beverage Grade
- Food Processing Grade
- Specialty High-Purity CO2
- Dry Ice Grade
Food & Beverage Grade CO2 (Carbon Dioxide) Market segmented by Supply Mode:
- Bulk Liquid
- Cylinder and Dewar
- Onsite Recovery
- Merchant Delivery
- Emergency and Spot Supply
Food & Beverage Grade CO2 (Carbon Dioxide) Market segmented by End Use:
- Beverage Producers
- Breweries
- Packaged Food Processors
- Dairy and Meat Processors
- Cold-Chain and Distribution Users
Food & Beverage Grade CO2 (Carbon Dioxide) Market by Region:
- North America
- United States
- Canada
- Latin America
- Brazil
- Mexico
- Argentina
- Chile
- Western Europe
- Germany
- France
- United Kingdom
- Italy
- Spain
- Benelux
- Nordics
- Eastern Europe
- Poland
- Czech Republic
- Romania
- Hungary
- East Asia
- China
- Japan
- South Korea
- South Asia and Pacific
- India
- ASEAN
- Australia and New Zealand
- Middle East and Africa
- GCC Countries
- South Africa
- Türkiye
- Israel
Research Sources and Bibliography
- USA Food and Drug Administration. (2026, April 21). Substances Added to Food (formerly EAFUS).
- European Commission. (2025, October 14). Commission Regulation (EU) 2025/2058 of 14 October 2025 amending Annexes II and III and correcting Annex II to Regulation (EC) No 1333/2008 as regards foods intended for particular nutritional uses.
- USA Department of Agriculture, Economic Research Service. (2026, June). Total USA food spending reached $2.51 trillion in 2025.
- USA Energy Information Administration. (2025, September 26). USA fuel ethanol plant production capacity.
- Federal Statistical Office of Germany. (2026, February). Beer sales down in 2025.
- Air Liquide Australia. (2025, May 21). Air Liquide partners with Manildra Group to build Australia’s largest biogenic CO₂ plant, strengthening national supply.
- Nippon Sanso Holdings Corporation. (2025, September 19). Nippon Gases establishes new CO₂ processing plant in Zörbig, Germany.
- Air Products South Africa. (2025, August 4). Air Products responds to market demand by investing in a new CO₂ facility in Sasolburg.
This bibliography is provided for reader reference and is not exhaustive. The full report contains the complete reference list and detailed citations.
This Report Answers
- How large is the food & beverage grade CO2 (carbon dioxide) market in 2026 and 2036?
- Which source category is expected to lead food and beverage grade CO2 supply?
- Why does beer and beverage carbonation remain the leading application?
- Which countries show the fastest profiled growth through 2036?
- Which companies are notable in food and beverage grade CO2 supply?
- How do purity rules and recovery-source reliability shape purchasing decisions?
Frequently Asked Questions
How big is the Food and Beverage Grade CO2 (Carbon Dioxide) Market in 2026?
The food and beverage grade CO2 (carbon dioxide) market is valued at USD 8.8 billion in 2026 and is forecast to reach USD 14.6 billion by 2036, reflecting growing demand from beverage carbonation, modified atmosphere packaging, and cold-chain applications that require documented purity records and qualified supply continuity.
What is the CAGR of the Food and Beverage Grade CO2 (Carbon Dioxide) Market from 2026 to 2036?
The food and beverage grade CO2 (carbon dioxide) market is projected to grow at a CAGR of 5.2% between 2026 and 2036, supported by beverage carbonation and MAP packaging requirements that connect CO2 purchasing with product quality documentation and repeat supply reliability across qualified channels.
Which application leads the Food and Beverage Grade CO2 (Carbon Dioxide) Market?
Beer and beverage carbonation accounts for 46.5% of the food and beverage grade CO2 (carbon dioxide) market by application in 2026, driven by continuous gas consumption across brewery and soft drink filling lines where delivery gaps can directly disrupt production schedules and product quality.
Which country is growing fastest in the Food and Beverage Grade CO2 (Carbon Dioxide) Market?
The food and beverage grade CO2 (carbon dioxide) market in China is projected to expand at a CAGR of 6.7% through 2036, ahead of the Netherlands at 6.3%, the USA at 5.9%, the UK at 5.5%, and Germany at 5.1%, reflecting expanding beverage output and large packaged-consumption channels that support larger delivery and purification routes.
Who are the leading companies in the Food and Beverage Grade CO2 (Carbon Dioxide) Market?
Leading companies in the food and beverage grade CO2 (carbon dioxide) market include Linde, Air Liquide, Messer, Air Products, Nippon Gases, and SOL Group, competing across food-grade recovery and purification, bulk tank delivery networks, and cryogenic food systems serving beverage producers and packaged-food processors globally.
Preview the report firsthand - request a free sample
Get SampleGet the brochure for pricing and purchase details.
Get PDFTable of Content
- Key Takeaways
- Market Size and CAGR
- Top Growth Driver
- Fastest Growing Segment
- Leading Region
- Key Companies
- Emerging Opportunities
- Executive Summary
- Global Market Outlook
- Demand-side Trends
- Supply-side Trends
- Technology Roadmap Analysis
- Analysis and Recommendations
- Analyst Perspective (What is happening? Why now? What should investors know?)
- Key Questions Answered
- How large is the market?
- What is the CAGR?
- What are key trends?
- Which region dominates?
- Who are the leaders?
- Market Overview
- Market Coverage / Taxonomy
- Market Definition / Scope / Limitations
- Research Methodology
- Chapter Orientation
- Analytical Lens and Working Hypotheses
- Market Structure, Signals, and Trend Drivers
- Benchmarking and Cross-market Comparability
- Market Sizing, Forecasting, and Opportunity Mapping
- Research Design and Evidence Framework
- Desk Research Programme (Secondary Evidence)
- Expert Input and Fieldwork (Primary Evidence)
- Tooling, Models, and Reference Databases
- Data Engineering and Model Build
- Quality Assurance and Audit Trail
- Market Background
- Market Dynamics (Drivers, Restraints, Opportunity, Trends)
- Scenario Forecast (Optimistic, Likely, Conservative)
- Impact Analysis
- AI Impact
- Sustainability Impact
- Regulatory Impact
- Technology Impact
- Consumer / Buyer Analysis
- Purchase Drivers
- Adoption Barriers
- Buyer Journey
- Opportunity Map Analysis
- Product Life Cycle Analysis
- Supply Chain Analysis
- Investment Feasibility Matrix
- Value Chain Analysis
- PESTLE and Porter's Analysis
- Regulatory Landscape
- Regional Parent Market Outlook
- Production and Consumption Statistics
- Import and Export Statistics
- Global Market Analysis and Forecast, 2021 to 2036
- Historical Market Size Value (USD Billion) Analysis, 2021 to 2025
- Current and Future Market Size Value (USD Billion) Projections, 2026 to 2036
- Y-o-Y Growth Trend Analysis
- Absolute $ Opportunity Analysis
- Global Market Pricing Analysis, 2021 to 2036
- Global Market Analysis and Forecast, By Source, 2021 to 2036
- Introduction / Key Findings
- Historical Market Size Value (USD Billion) Analysis By Source, 2021 to 2025
- Current and Future Market Size Value (USD Billion) Analysis and Forecast By Source, 2026 to 2036
- Ammonia/Fertilizer
- Bioethanol Fermentation
- Natural Gas Processing
- Recovered and Purified CO2
- Other Industrial Recovery Streams
- Y-o-Y Growth Trend Analysis By Source, 2021 to 2025
- Absolute $ Opportunity Analysis By Source, 2026 to 2036
- Global Market Analysis and Forecast, By Application, 2021 to 2036
- Introduction / Key Findings
- Historical Market Size Value (USD Billion) Analysis By Application, 2021 to 2025
- Current and Future Market Size Value (USD Billion) Analysis and Forecast By Application, 2026 to 2036
- Beer/Beverage Carbonation
- MAP Packaging
- Dry Ice
- Chilling and Freezing
- pH Control and Processing Uses
- Y-o-Y Growth Trend Analysis By Application, 2021 to 2025
- Absolute $ Opportunity Analysis By Application, 2026 to 2036
- Global Market Analysis and Forecast, By Grade and Purity, 2021 to 2036
- Introduction / Key Findings
- Historical Market Size Value (USD Billion) Analysis By Grade and Purity, 2021 to 2025
- Current and Future Market Size Value (USD Billion) Analysis and Forecast By Grade and Purity, 2026 to 2036
- Beverage Grade
- Food Processing Grade
- Specialty High-Purity CO2
- Dry Ice Grade
- Y-o-Y Growth Trend Analysis By Grade and Purity, 2021 to 2025
- Absolute $ Opportunity Analysis By Grade and Purity, 2026 to 2036
- Global Market Analysis and Forecast, By Supply Mode, 2021 to 2036
- Introduction / Key Findings
- Historical Market Size Value (USD Billion) Analysis By Supply Mode, 2021 to 2025
- Current and Future Market Size Value (USD Billion) Analysis and Forecast By Supply Mode, 2026 to 2036
- Bulk Liquid
- Cylinder and Dewar
- Onsite Recovery
- Merchant Delivery
- Emergency and Spot Supply
- Y-o-Y Growth Trend Analysis By Supply Mode, 2021 to 2025
- Absolute $ Opportunity Analysis By Supply Mode, 2026 to 2036
- Global Market Analysis and Forecast, By End Use, 2021 to 2036
- Introduction / Key Findings
- Historical Market Size Value (USD Billion) Analysis By End Use, 2021 to 2025
- Current and Future Market Size Value (USD Billion) Analysis and Forecast By End Use, 2026 to 2036
- Beverage Producers
- Breweries
- Packaged Food Processors
- Dairy and Meat Processors
- Cold-Chain and Distribution Users
- Y-o-Y Growth Trend Analysis By End Use, 2021 to 2025
- Absolute $ Opportunity Analysis By End Use, 2026 to 2036
- Global Market Analysis and Forecast, By Region, 2021 to 2036
- Introduction
- Historical Market Size Value (USD Billion) Analysis By Region, 2021 to 2025
- Current Market Size Value (USD Billion) Analysis and Forecast By Region, 2026 to 2036
- North America
- Latin America
- Western Europe
- Eastern Europe
- East Asia
- South Asia and Pacific
- Middle East & Africa
- Market Attractiveness Analysis By Region
- North America Market Analysis and Forecast, By Country, 2021 to 2036
- Historical Market Size Value (USD Billion) Trend Analysis By Market Taxonomy, 2021 to 2025
- Market Size Value (USD Billion) Forecast By Market Taxonomy, 2026 to 2036
- By Country
- USA
- Canada
- By Source
- By Application
- By Country
- Market Attractiveness Analysis
- By Country
- By Source
- By Application
- Key Takeaways
- Latin America Market Analysis and Forecast, By Country
- Historical Market Size Value (USD Billion) Trend Analysis By Market Taxonomy, 2021 to 2025
- Market Size Value (USD Billion) Forecast By Market Taxonomy, 2026 to 2036
- By Country
- Brazil
- Mexico
- Chile
- Rest of Latin America
- By Source
- By Application
- By Country
- Market Attractiveness Analysis
- By Country
- By Source
- By Application
- Key Takeaways
- Western Europe Market Analysis and Forecast, By Country
- Historical Market Size Value (USD Billion) Trend Analysis By Market Taxonomy, 2021 to 2025
- Market Size Value (USD Billion) Forecast By Market Taxonomy, 2026 to 2036
- By Country
- Germany
- UK
- Italy
- Spain
- France
- Nordic
- BENELUX
- Rest of Western Europe
- By Source
- By Application
- By Country
- Market Attractiveness Analysis
- By Country
- By Source
- By Application
- Key Takeaways
- Eastern Europe Market Analysis and Forecast, By Country
- Historical Market Size Value (USD Billion) Trend Analysis By Market Taxonomy, 2021 to 2025
- Market Size Value (USD Billion) Forecast By Market Taxonomy, 2026 to 2036
- By Country
- Russia
- Poland
- Hungary
- Balkan & Baltic
- Rest of Eastern Europe
- By Source
- By Application
- By Country
- Market Attractiveness Analysis
- By Country
- By Source
- By Application
- Key Takeaways
- East Asia Market Analysis and Forecast, By Country
- Historical Market Size Value (USD Billion) Trend Analysis By Market Taxonomy, 2021 to 2025
- Market Size Value (USD Billion) Forecast By Market Taxonomy, 2026 to 2036
- By Country
- China
- Japan
- South Korea
- By Source
- By Application
- By Country
- Market Attractiveness Analysis
- By Country
- By Source
- By Application
- Key Takeaways
- South Asia and Pacific Market Analysis and Forecast, By Country
- Historical Market Size Value (USD Billion) Trend Analysis By Market Taxonomy, 2021 to 2025
- Market Size Value (USD Billion) Forecast By Market Taxonomy, 2026 to 2036
- By Country
- India
- ASEAN
- Australia & New Zealand
- Rest of South Asia and Pacific
- By Source
- By Application
- By Country
- Market Attractiveness Analysis
- By Country
- By Source
- By Application
- Key Takeaways
- Middle East & Africa Market Analysis and Forecast, By Country
- Historical Market Size Value (USD Billion) Trend Analysis By Market Taxonomy, 2021 to 2025
- Market Size Value (USD Billion) Forecast By Market Taxonomy, 2026 to 2036
- By Country
- Kingdom of Saudi Arabia
- Other GCC Countries
- Türkiye
- South Africa
- Other African Union
- Rest of Middle East & Africa
- By Source
- By Application
- By Country
- Market Attractiveness Analysis
- By Country
- By Source
- By Application
- Key Takeaways
- Key Countries Market Analysis
- USA
- Pricing Analysis
- Market Share Analysis, 2025
- By Source
- By Application
- Canada
- Pricing Analysis
- Market Share Analysis, 2025
- By Source
- By Application
- Mexico
- Pricing Analysis
- Market Share Analysis, 2025
- By Source
- By Application
- Brazil
- Pricing Analysis
- Market Share Analysis, 2025
- By Source
- By Application
- Chile
- Pricing Analysis
- Market Share Analysis, 2025
- By Source
- By Application
- Germany
- Pricing Analysis
- Market Share Analysis, 2025
- By Source
- By Application
- UK
- Pricing Analysis
- Market Share Analysis, 2025
- By Source
- By Application
- Italy
- Pricing Analysis
- Market Share Analysis, 2025
- By Source
- By Application
- Spain
- Pricing Analysis
- Market Share Analysis, 2025
- By Source
- By Application
- France
- Pricing Analysis
- Market Share Analysis, 2025
- By Source
- By Application
- India
- Pricing Analysis
- Market Share Analysis, 2025
- By Source
- By Application
- ASEAN
- Pricing Analysis
- Market Share Analysis, 2025
- By Source
- By Application
- Australia & New Zealand
- Pricing Analysis
- Market Share Analysis, 2025
- By Source
- By Application
- China
- Pricing Analysis
- Market Share Analysis, 2025
- By Source
- By Application
- Japan
- Pricing Analysis
- Market Share Analysis, 2025
- By Source
- By Application
- South Korea
- Pricing Analysis
- Market Share Analysis, 2025
- By Source
- By Application
- Russia
- Pricing Analysis
- Market Share Analysis, 2025
- By Source
- By Application
- Poland
- Pricing Analysis
- Market Share Analysis, 2025
- By Source
- By Application
- Hungary
- Pricing Analysis
- Market Share Analysis, 2025
- By Source
- By Application
- Kingdom of Saudi Arabia
- Pricing Analysis
- Market Share Analysis, 2025
- By Source
- By Application
- Türkiye
- Pricing Analysis
- Market Share Analysis, 2025
- By Source
- By Application
- South Africa
- Pricing Analysis
- Market Share Analysis, 2025
- By Source
- By Application
- USA
- Market Structure Analysis
- Competition Dashboard
- Competition Benchmarking
- Market Share Analysis of Top Players
- By Regional
- By Source
- By Application
- Emerging Startups
- Innovation Benchmarking
- Competition Analysis
- Competition Deep Dive
- Linde
- Overview
- Product Portfolio
- Profitability by Market Segments
- Sales Footprint
- Strategy Overview
- Marketing Strategy
- Product Strategy
- Channel Strategy
- Air Liquide
- Air Products
- Messer
- Nippon Gases
- SOL Group
- Linde
- Case Studies
- Success Stories
- Recent Developments
- Competition Deep Dive
- Assumptions & Acronyms Used


