Gamma Linolenic Acid Market Size, Share, and Forecast Outlook 2025 to 2035

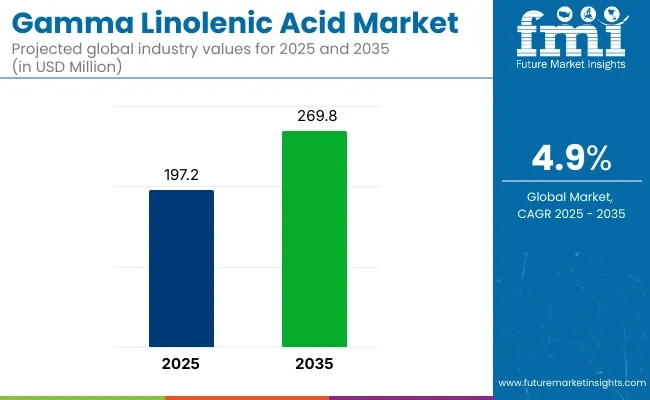
The global Gamma Linolenic Acid (GLA) market is projected to be valued at USD 197.2 million in 2025, with a forecasted compound annual growth rate (CAGR) of 4.9%, leading to an estimated value of USD 269.8 million by 2035. From 2020 to 2025, the market registered a CAGR of 4.3%. The increasing demand for GLA is driven by a growing consumer preference for healthier lifestyles and the rising awareness of its heart health benefits.

As an omega-6 polyunsaturated fatty acid, GLA is vital in maintaining cardiovascular health, which is contributing to its increasing consumption worldwide. People can either naturally integrate GLA into their diets or consume various food ingredients rich in this compound.

The therapeutic benefits of Gamma Linolenic Acid are significantly driving market growth. GLA, found in plant seed oils such as black currant, borage, and evening primrose, is essential for human health maintenance. Its demand is rising as it is widely used to treat conditions like eczema, diabetes, arthritis, high blood pressure, and more.

Gamma Linolenic Acid Market

Attribute Value
Market Size in 2025 USD 197.2 million
Market Size in 2035 USD 269.8 million
CAGR (2025 to 2035) 4.9%

Although the efficacy of these applications is not always supported by solid scientific data, the therapeutic appeal of GLA continues to grow. In 2024, Changsha Vigorous-Tech Co., Ltd., a leading company from China, participated in major industry exhibitions such as SupplySide West and CPhI China, showcasing its botanical extracts and derivatives relevant to the GLA market. This highlights the growing interest and involvement in GLA as a key ingredient in the natural health and wellness industry.

The demand for GLA is also supported by its use in several industries, including food and beverages, pharmaceuticals, dietary supplements, and animal nutrition. Cherish Pharma (India) has been involved in the development of dietary supplements incorporating GLA, focusing on formulations that support skin health and hormonal balance.

In the pharmaceutical space, Acme (USA) is conducting research on the applications of GLA in anti-inflammatory treatments. Furthermore, Charkit Chemical (USA) supplies various fatty acids, including GLA, to the nutraceutical and cosmetic industries, supporting the growing demand for natural ingredients.

Cailà & Parés (Spain) manufactures polyunsaturated fatty acids, including linolenic acid, which are utilized in various industrial applications like the production of resins and detergents. These ongoing initiatives and product offerings contribute to the continued growth and diversification of the GLA market.

Analyzing Gamma Linolenic Acid Market by Top Investment Segments

The Gamma Linolenic Acid (GLA) market is poised for growth, driven by key segments like liquid GLA and dietary supplements. Liquid GLA is anticipated to lead the form segment, while dietary supplements will remain a significant part of the end-use segment. These two segments are expected to play a key role in the market’s continued expansion, supported by consumer demand for natural, effective health solutions.

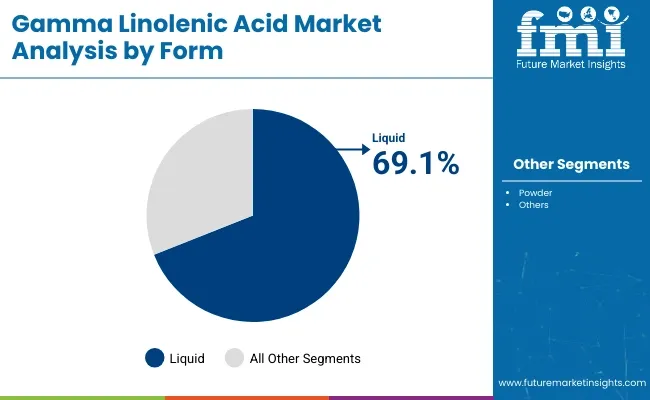
Liquid GLA to Capture 69.1% of the Gamma Linolenic Acid Market Share

Liquid GLA is expected to dominate the Gamma Linolenic Acid market, capturing 69.1% of the market share by 2025. This form is favored for its versatility and ease of incorporation into various products, making it the preferred choice in industries like dietary supplements, pharmaceuticals, and cosmetics.

Gamma Linolenic Acid Market Analysis By Form

In dietary supplements, liquid GLA can be easily integrated into soft gels and capsules, making it convenient for consumers to incorporate into their daily wellness routines. In the cosmetics industry, liquid GLA is valued for its anti-inflammatory and moisturizing properties, making it a sought-after ingredient for skincare products such as lotions, serums, and creams.

The increasing preference for natural ingredients in personal care products has further propelled the demand for liquid GLA, with a rising focus on skincare solutions that prioritize plant-based, effective ingredients. As the trend toward natural wellness products continues to grow, liquid GLA is expected to maintain its dominant position in the market.

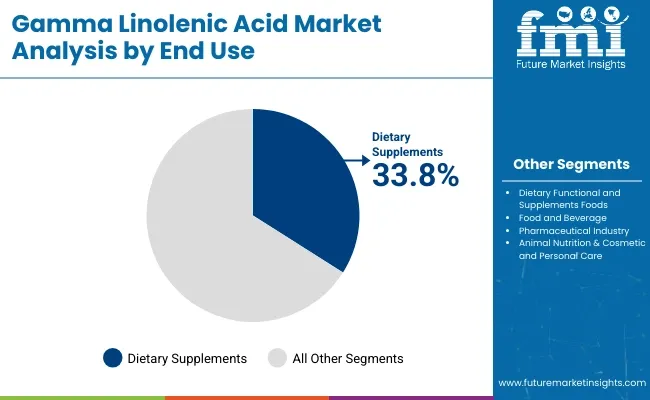
Dietary Supplements to Capture 33.8% of the Gamma Linolenic Acid Market Share

Dietary supplements are anticipated to capture 33.8% of the Gamma Linolenic Acid (GLA) market share by 2025. The increasing consumer shift towards health-conscious decisions and preventive healthcare is driving the growing demand for natural supplements, including those containing GLA.

Gamma Linolenic Acid Market Analysis By End Use

These supplements are commonly marketed for their potential benefits such as supporting skin health, reducing inflammation, and balancing hormones, all of which align with the rising focus on holistic wellness. GLA is seen as an effective ingredient in addressing common health concerns, which has contributed to its growing popularity in the dietary supplement industry.

Leading companies such as Nature’s Way, Sundown Naturals, and Now Foods have been integrating GLA into their product offerings to cater to the demand for natural health solutions. The increasing incorporation of GLA in functional foods such as smoothies, dietary snacks, and energy bars is also boosting the market. As the demand for natural, preventive wellness products rises, the dietary supplements segment is expected to continue playing a major role in the growth of the GLA market, with consumers increasingly turning to natural solutions for better overall health.

Key Industry Highlights

Demand for Healthy Supplements Driving Market Growth

The increasing demand for gamma linolenic acid (GLA) in dietary supplements is being driven by consumer awareness of the health benefits linked to GLA. An omega-6 fatty acid called GLA which is present in plant-based oils like borage and evening primrose is becoming more well-known for its anti-inflammatory qualities.

Due to these advantages it is now used to treat inflammatory diseases like rheumatoid arthritis and eczema. GLA-enriched supplements are becoming more and more popular as consumers look for natural solutions which is helping to support their growing market share.

In the upcoming years the market for gamma linolenic acid is anticipated to grow due to consumers increasing preference for natural health products. As more people become aware of GLAs therapeutic benefits more people are including GLA supplements in their wellness regimens. Among people searching for alternatives to pharmaceutical treatments this trend is especially prominent. Since GLA satisfies the demands of consumers looking for natural solutions who are health-conscious the market is expected to continue growing.

Rise in Awareness in Arthritis Driving Market Growth

It is anticipated that the growing incidence of rheumatoid arthritis will increase demand for gamma linolenic acid which is contributing to the expansion of the global gamma linolenic acid market. A study released by the Arthritis Foundation in 2017 estimated that 54. 4% of Americans have arthritis according to a new study.

Joint pain and swelling are the most typical signs of arthritis. Gamma linolenic acid is a good choice in these situations because it reduces inflammation and helps avoid arthritis. Consumers around the world are becoming more health conscious and their lifestyles have changed significantly.

This element is thought to contribute to the market expansion for gamma linolenic acid. Consumers these days favor goods with natural nutrient-dense ingredients that provide health advantages. Thus, it is expected that the demand for products induced by gamma linolenic acid will increase as the number of cases of arthritis rises. Gamma linolenic acid cannot be synthesized by the human body so we must obtain it from outside sources in order to meet our body’s needs.

When gamma linolenic acid is insufficient the body undergoes certain metabolic changes. Therefore, one of the factors behind the growth of the global gamma linolenic acid market is expected to be the dependence on external sources to meet the gamma linolenic acid requirement.

Market Concentration

Tier 1 companies includes industry leaders acquiring a 20% share in the global business market. These leaders are distinguished by their extensive product portfolio and high production capacity. These industry leaders stand out due to their broad geographic reach, in-depth knowledge of manufacturing and reconditioning across various formats and strong customer base. They offer a variety of services and manufacturing with the newest technology while adhering to legal requirements for the best quality.

Tier 2 companies include mid-size players having a presence in specific regions and highly influencing the local commerce and has a market share of 30%. These are distinguished by their robust global presence and solid business acumen. These industry participants may not have cutting-edge technology or a broad global reach but they do have good technology and guarantee regulatory compliance.

Tier 3 companies includes mostly of small-scale businesses serving niche economies and operating at the local presence having a market share of 50%. Due to their notable focus on meeting local needs these businesses are categorized as belonging to the tier 3 share segment, they are minor players with a constrained geographic scope. As an unorganized ecosystem Tier 3 in this context refers to a sector that in contrast to its organized competitors, lacks extensive structure and formalization.

Country wise Insights

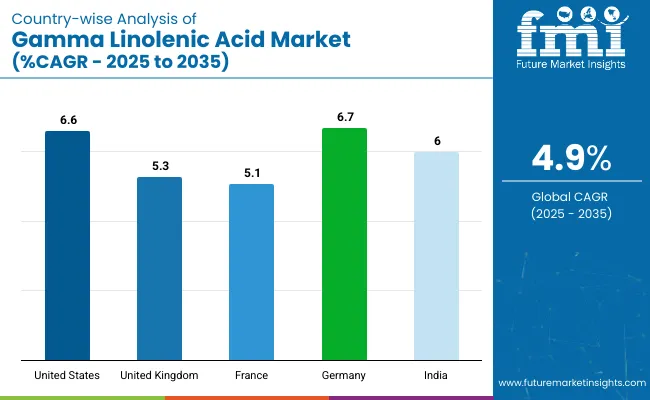
The following table shows the forecasted growth rates of the significant three geographies revenues. USA, Germany and India come under the exhibit of high consumption, recording CAGRs of 6.6%, 6.7% and 6%, respectively, through 2035.

Country Wise Analysis Of Gamma Linolenic Acid Market Cagr 2025 To 2035

Countries CAGR, 2025 to 2035
United States 6.6%
Germany 6.7%
India 6%

USA Dominates the Global Gamma Linolenic Acid Market

The United States accounts for a significant portion of the global GLA market roughly 35% of the entire market in 2024. The primary cause of this dominance is the high degree of consumer knowledge about the widespread health benefits of GLA dietary supplements and functional foods enhanced with GLA. The well-being of the area both the growing incidence of chronic illnesses and the well-established healthcare infrastructure increased GLAs demand in the pharmaceutical industry.

As an example, government surveys have shown an increasing trend in the consumption of dietary supplements containing among the omega-6 fatty acids are GLA. Nutrition research conducted high authority surveys. According to institutes consumers are becoming more interested in natural anti-inflammatory products. merchandise which increases the demand for supplements containing GLA.

India’s Rapid Growth Contributes to the Gamma Linolenic Acid Market Growth

Asia Pacific is growing quickly thanks to the growing nutraceutical industry. Due to its sizable population and rising disposable incomes India makes a substantial contribution. One of the main factors propelling these markets is the move toward wellness supplements and preventative healthcare.

Germany Emerges in Gamma Linolenic Acid Market

With about 30% of the global GLA market Germany comes in second to the USA. Growing consumer preference for GLA is the main factor driving demand for the product in Europe. ingredients that are natural and plant-based especially in personal care and cosmetics. industries strict regulations and a focus on products in the nation.

The GLA market has expanded thanks in part to quality. For example, the government, according to surveys conducted in Germany the use of plant-based oils has increased skincare items. Associations for the cosmetics industry have conducted high authority surveys underlined the growing acceptance of GLA-rich oils in anti-aging products such as evening primrose and borage formulations for skin nourishment and aging.

Competition Outlook

It is said that market producers in a variety of industries strive to develop goods that help provide an effective arthritis treatment. The producers of gamma linolenic acid have the chance to improve their marketing and promotion plans. This will raise awareness of gamma linolenic acids health benefits and boost its use in a number of end-use industries.

Leading Manufacturers

  • Merck KGaA
  • Enzo Life Sciences, Inc.
  • Thermo Fisher Scientific
  • Changsha Vigorous-Tech
  • Cherish Pharma
  • Acme
  • Charkit Chemical
  • Cailà & Parés
  • Penta Manufacturing
  • Cayman Chemical

Comprehensive Report Scope and Coverage Overview

Report Attributes Details
Estimated Global Industry Size (2025E) USD 197.2 million
Projected Global Industry Value (2035F) USD 269.8 million
Value-based CAGR (2025 to 2035) 4.9%
Base Year for Estimation 2024
Historical Period 2020 to 2024
Projections Period 2025 to 2035
Quantitative Units USD million for value
Regions Covered North America, Latin America, Western Europe, Eastern Europe, South Asia & Pacific, East Asia, Middle East & Africa
Countries Covered United States, Canada, Mexico, Brazil, Argentina, Germany, France, United Kingdom, Italy, Spain, Netherlands, China, India, Japan, South Korea, GCC Countries, South Africa
Key Players influencing the Market Not specified in the provided data (can be added based on further research)
Additional Attributes Dollar sales by region (North America, Europe, etc.), Trends in demand for gamma linolenic acid in pharmaceuticals, cosmetics, and nutraceuticals, Growth in sourcing from plant-based and synthetic sources, Regional dynamics across key markets in North America, Europe, and Asia-Pacific

Key Segments of the Report

By Nature:

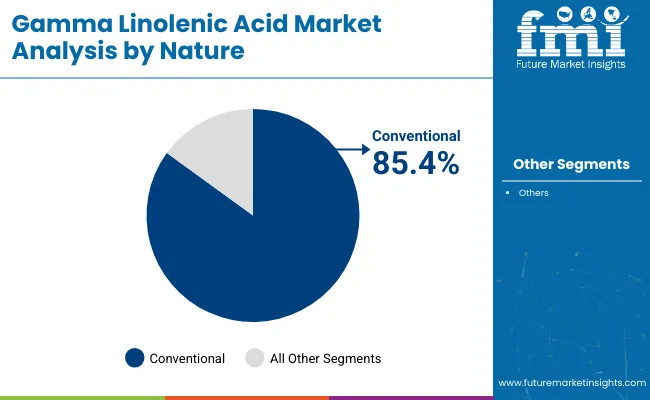
By nature, industry has been categorized into conventional & organic

By Form:

By form industry has been categorized into liquid & powder

By End-Use:

By end-use industry has been categorized into Dietary Functional and Supplements Foods, Food and Beverage, Pharmaceutical Industry, Animal Nutrition & Cosmetic and Personal Care

By Region:

Industry analysis has been carried out in key countries of North America; Europe, Middle East, Africa, ASEAN, South Asia, Asia, New Zealand and Australia

Table of Content

  1. Executive Summary
  2. Industry Introduction, including Taxonomy and Market Definition
  3. Market Trends and Success Factors, including Macro-Economic Factors, Market Dynamics, and Recent Industry Developments
  4. Global Market Demand Analysis 2020 to 2024 and Forecast 2025 to 2035, including Historical Analysis and Future Projections
  5. Pricing Analysis
  6. Global Market Analysis 2020 to 2024 and Forecast 2025 to 2035
    • By Nature
    • By Form
    • By End-Use
  7. Global Market Analysis 2020 to 2024 and Forecast 2025 to 2035, By Nature
    • Conventional
    • Organic
  8. Global Market Analysis 2020 to 2024 and Forecast 2025 to 2035, By Form
    • Liquid
    • Powder
  9. Global Market Analysis 2020 to 2024 and Forecast 2025 to 2035, By End-Use
    • Dietary Functional and Supplement Foods
    • Food and Beverage
    • Pharmaceutical Industry
    • Animal Nutrition
    • Cosmetic and Personal Care
  10. Global Market Analysis 2020 to 2024 and Forecast 2025 to 2035, By Region
    • North America
    • Europe
    • Middle East
    • Africa
    • ASEAN
    • South Asia
    • Asia
    • New Zealand and Australia
  11. North America Sales Analysis 2020 to 2024 and Forecast 2025 to 2035, By Key Segments and Countries
  12. Europe Sales Analysis 2020 to 2024 and Forecast 2025 to 2035, By Key Segments and Countries
  13. Middle East Sales Analysis 2020 to 2024 and Forecast 2025 to 2035, By Key Segments and Countries
  14. Africa Sales Analysis 2020 to 2024 and Forecast 2025 to 2035, By Key Segments and Countries
  15. ASEAN Sales Analysis 2020 to 2024 and Forecast 2025 to 2035, By Key Segments and Countries
  16. South Asia Sales Analysis 2020 to 2024 and Forecast 2025 to 2035, By Key Segments and Countries
  17. Asia Sales Analysis 2020 to 2024 and Forecast 2025 to 2035, By Key Segments and Countries
  18. New Zealand and Australia Sales Analysis 2020 to 2024 and Forecast 2025 to 2035, By Key Segments and Countries
  19. Sales Forecast 2025 to 2035 By Nature, Form, and End-Use for 30 Countries
  20. Competition Outlook, including Market Structure Analysis, Company Share Analysis by Key Players, and Competition Dashboard
  21. Company Profile
    • Merck KGaA
    • Enzo Life Sciences, Inc.
    • Thermo Fisher Scientific
    • Changsha Vigorous-Tech
    • Cherish Pharma
    • Acme
    • Charkit Chemical
    • Cailà & Parés

List of Tables

  • Table 1: Global Gamma Linolenic Acid Market Value (US$ Mn) Forecast by Region, 2020 to 2035
  • Table 2: Global Gamma Linolenic Acid Market Volume (Tons) Forecast by Region, 2020 to 2035
  • Table 3: Global Gamma Linolenic Acid Market Value (US$ Mn) Forecast by Nature, 2020 to 2035
  • Table 4: Global Gamma Linolenic Acid Market Volume (Tons) Forecast by Nature, 2020 to 2035
  • Table 5: Global Gamma Linolenic Acid Market Value (US$ Mn) Forecast by Form, 2020 to 2035
  • Table 6: Global Gamma Linolenic Acid Market Volume (Tons) Forecast by Form, 2020 to 2035
  • Table 7: Global Gamma Linolenic Acid Market Value (US$ Mn) Forecast by End-use, 2020 to 2035
  • Table 8: Global Gamma Linolenic Acid Market Volume (Tons) Forecast by End-use, 2020 to 2035
  • Table 9: North America Gamma Linolenic Acid Market Value (US$ Mn) Forecast by Country, 2020 to 2035
  • Table 10: North America Gamma Linolenic Acid Market Volume (Tons) Forecast by Country, 2020 to 2035
  • Table 11: North America Gamma Linolenic Acid Market Value (US$ Mn) Forecast by Nature, 2020 to 2035
  • Table 12: North America Gamma Linolenic Acid Market Volume (Tons) Forecast by Nature, 2020 to 2035
  • Table 13: North America Gamma Linolenic Acid Market Value (US$ Mn) Forecast by Form, 2020 to 2035
  • Table 14: North America Gamma Linolenic Acid Market Volume (Tons) Forecast by Form, 2020 to 2035
  • Table 15: North America Gamma Linolenic Acid Market Value (US$ Mn) Forecast by End-use, 2020 to 2035
  • Table 16: North America Gamma Linolenic Acid Market Volume (Tons) Forecast by End-use, 2020 to 2035
  • Table 17: Latin America Gamma Linolenic Acid Market Value (US$ Mn) Forecast by Country, 2020 to 2035
  • Table 18: Latin America Gamma Linolenic Acid Market Volume (Tons) Forecast by Country, 2020 to 2035
  • Table 19: Latin America Gamma Linolenic Acid Market Value (US$ Mn) Forecast by Nature, 2020 to 2035
  • Table 20: Latin America Gamma Linolenic Acid Market Volume (Tons) Forecast by Nature, 2020 to 2035
  • Table 21: Latin America Gamma Linolenic Acid Market Value (US$ Mn) Forecast by Form, 2020 to 2035
  • Table 22: Latin America Gamma Linolenic Acid Market Volume (Tons) Forecast by Form, 2020 to 2035
  • Table 23: Latin America Gamma Linolenic Acid Market Value (US$ Mn) Forecast by End-use, 2020 to 2035
  • Table 24: Latin America Gamma Linolenic Acid Market Volume (Tons) Forecast by End-use, 2020 to 2035
  • Table 25: Europe Gamma Linolenic Acid Market Value (US$ Mn) Forecast by Country, 2020 to 2035
  • Table 26: Europe Gamma Linolenic Acid Market Volume (Tons) Forecast by Country, 2020 to 2035
  • Table 27: Europe Gamma Linolenic Acid Market Value (US$ Mn) Forecast by Nature, 2020 to 2035
  • Table 28: Europe Gamma Linolenic Acid Market Volume (Tons) Forecast by Nature, 2020 to 2035
  • Table 29: Europe Gamma Linolenic Acid Market Value (US$ Mn) Forecast by Form, 2020 to 2035
  • Table 30: Europe Gamma Linolenic Acid Market Volume (Tons) Forecast by Form, 2020 to 2035
  • Table 31: Europe Gamma Linolenic Acid Market Value (US$ Mn) Forecast by End-use, 2020 to 2035
  • Table 32: Europe Gamma Linolenic Acid Market Volume (Tons) Forecast by End-use, 2020 to 2035
  • Table 33: East Asia Gamma Linolenic Acid Market Value (US$ Mn) Forecast by Country, 2020 to 2035
  • Table 34: East Asia Gamma Linolenic Acid Market Volume (Tons) Forecast by Country, 2020 to 2035
  • Table 35: East Asia Gamma Linolenic Acid Market Value (US$ Mn) Forecast by Nature, 2020 to 2035
  • Table 36: East Asia Gamma Linolenic Acid Market Volume (Tons) Forecast by Nature, 2020 to 2035
  • Table 37: East Asia Gamma Linolenic Acid Market Value (US$ Mn) Forecast by Form, 2020 to 2035
  • Table 38: East Asia Gamma Linolenic Acid Market Volume (Tons) Forecast by Form, 2020 to 2035
  • Table 39: East Asia Gamma Linolenic Acid Market Value (US$ Mn) Forecast by End-use, 2020 to 2035
  • Table 40: East Asia Gamma Linolenic Acid Market Volume (Tons) Forecast by End-use, 2020 to 2035
  • Table 41: South Asia & Pacific Gamma Linolenic Acid Market Value (US$ Mn) Forecast by Country, 2020 to 2035
  • Table 42: South Asia & Pacific Gamma Linolenic Acid Market Volume (Tons) Forecast by Country, 2020 to 2035
  • Table 43: South Asia & Pacific Gamma Linolenic Acid Market Value (US$ Mn) Forecast by Nature, 2020 to 2035
  • Table 44: South Asia & Pacific Gamma Linolenic Acid Market Volume (Tons) Forecast by Nature, 2020 to 2035
  • Table 45: South Asia & Pacific Gamma Linolenic Acid Market Value (US$ Mn) Forecast by Form, 2020 to 2035
  • Table 46: South Asia & Pacific Gamma Linolenic Acid Market Volume (Tons) Forecast by Form, 2020 to 2035
  • Table 47: South Asia & Pacific Gamma Linolenic Acid Market Value (US$ Mn) Forecast by End-use, 2020 to 2035
  • Table 48: South Asia & Pacific Gamma Linolenic Acid Market Volume (Tons) Forecast by End-use, 2020 to 2035
  • Table 49: MEA Gamma Linolenic Acid Market Value (US$ Mn) Forecast by Country, 2020 to 2035
  • Table 50: MEA Gamma Linolenic Acid Market Volume (Tons) Forecast by Country, 2020 to 2035
  • Table 51: MEA Gamma Linolenic Acid Market Value (US$ Mn) Forecast by Nature, 2020 to 2035
  • Table 52: MEA Gamma Linolenic Acid Market Volume (Tons) Forecast by Nature, 2020 to 2035
  • Table 53: MEA Gamma Linolenic Acid Market Value (US$ Mn) Forecast by Form, 2020 to 2035
  • Table 54: MEA Gamma Linolenic Acid Market Volume (Tons) Forecast by Form, 2020 to 2035
  • Table 55: MEA Gamma Linolenic Acid Market Value (US$ Mn) Forecast by End-use, 2020 to 2035
  • Table 56: MEA Gamma Linolenic Acid Market Volume (Tons) Forecast by End-use, 2020 to 2035

List of Figures

  • Figure 1: Global Gamma Linolenic Acid Market Value (US$ Mn) by Nature, 2025 to 2035
  • Figure 2: Global Gamma Linolenic Acid Market Value (US$ Mn) by Form, 2025 to 2035
  • Figure 3: Global Gamma Linolenic Acid Market Value (US$ Mn) by End-use, 2025 to 2035
  • Figure 4: Global Gamma Linolenic Acid Market Value (US$ Mn) by Region, 2025 to 2035
  • Figure 5: Global Gamma Linolenic Acid Market Value (US$ Mn) Analysis by Region, 2020 to 2035
  • Figure 6: Global Gamma Linolenic Acid Market Volume (Tons) Analysis by Region, 2020 to 2035
  • Figure 7: Global Gamma Linolenic Acid Market Value Share (%) and BPS Analysis by Region, 2025 to 2035
  • Figure 8: Global Gamma Linolenic Acid Market Y-o-Y Growth (%) Projections by Region, 2025 to 2035
  • Figure 9: Global Gamma Linolenic Acid Market Value (US$ Mn) Analysis by Nature, 2020 to 2035
  • Figure 10: Global Gamma Linolenic Acid Market Volume (Tons) Analysis by Nature, 2020 to 2035
  • Figure 11: Global Gamma Linolenic Acid Market Value Share (%) and BPS Analysis by Nature, 2025 to 2035
  • Figure 12: Global Gamma Linolenic Acid Market Y-o-Y Growth (%) Projections by Nature, 2025 to 2035
  • Figure 13: Global Gamma Linolenic Acid Market Value (US$ Mn) Analysis by Form, 2020 to 2035
  • Figure 14: Global Gamma Linolenic Acid Market Volume (Tons) Analysis by Form, 2020 to 2035
  • Figure 15: Global Gamma Linolenic Acid Market Value Share (%) and BPS Analysis by Form, 2025 to 2035
  • Figure 16: Global Gamma Linolenic Acid Market Y-o-Y Growth (%) Projections by Form, 2025 to 2035
  • Figure 17: Global Gamma Linolenic Acid Market Value (US$ Mn) Analysis by End-use, 2020 to 2035
  • Figure 18: Global Gamma Linolenic Acid Market Volume (Tons) Analysis by End-use, 2020 to 2035
  • Figure 19: Global Gamma Linolenic Acid Market Value Share (%) and BPS Analysis by End-use, 2025 to 2035
  • Figure 20: Global Gamma Linolenic Acid Market Y-o-Y Growth (%) Projections by End-use, 2025 to 2035
  • Figure 21: Global Gamma Linolenic Acid Market Attractiveness by Nature, 2025 to 2035
  • Figure 22: Global Gamma Linolenic Acid Market Attractiveness by Form, 2025 to 2035
  • Figure 23: Global Gamma Linolenic Acid Market Attractiveness by End-use, 2025 to 2035
  • Figure 24: Global Gamma Linolenic Acid Market Attractiveness by Region, 2025 to 2035
  • Figure 25: North America Gamma Linolenic Acid Market Value (US$ Mn) by Nature, 2025 to 2035
  • Figure 26: North America Gamma Linolenic Acid Market Value (US$ Mn) by Form, 2025 to 2035
  • Figure 27: North America Gamma Linolenic Acid Market Value (US$ Mn) by End-use, 2025 to 2035
  • Figure 28: North America Gamma Linolenic Acid Market Value (US$ Mn) by Country, 2025 to 2035
  • Figure 29: North America Gamma Linolenic Acid Market Value (US$ Mn) Analysis by Country, 2020 to 2035
  • Figure 30: North America Gamma Linolenic Acid Market Volume (Tons) Analysis by Country, 2020 to 2035
  • Figure 31: North America Gamma Linolenic Acid Market Value Share (%) and BPS Analysis by Country, 2025 to 2035
  • Figure 32: North America Gamma Linolenic Acid Market Y-o-Y Growth (%) Projections by Country, 2025 to 2035
  • Figure 33: North America Gamma Linolenic Acid Market Value (US$ Mn) Analysis by Nature, 2020 to 2035
  • Figure 34: North America Gamma Linolenic Acid Market Volume (Tons) Analysis by Nature, 2020 to 2035
  • Figure 35: North America Gamma Linolenic Acid Market Value Share (%) and BPS Analysis by Nature, 2025 to 2035
  • Figure 36: North America Gamma Linolenic Acid Market Y-o-Y Growth (%) Projections by Nature, 2025 to 2035
  • Figure 37: North America Gamma Linolenic Acid Market Value (US$ Mn) Analysis by Form, 2020 to 2035
  • Figure 38: North America Gamma Linolenic Acid Market Volume (Tons) Analysis by Form, 2020 to 2035
  • Figure 39: North America Gamma Linolenic Acid Market Value Share (%) and BPS Analysis by Form, 2025 to 2035
  • Figure 40: North America Gamma Linolenic Acid Market Y-o-Y Growth (%) Projections by Form, 2025 to 2035
  • Figure 41: North America Gamma Linolenic Acid Market Value (US$ Mn) Analysis by End-use, 2020 to 2035
  • Figure 42: North America Gamma Linolenic Acid Market Volume (Tons) Analysis by End-use, 2020 to 2035
  • Figure 43: North America Gamma Linolenic Acid Market Value Share (%) and BPS Analysis by End-use, 2025 to 2035
  • Figure 44: North America Gamma Linolenic Acid Market Y-o-Y Growth (%) Projections by End-use, 2025 to 2035
  • Figure 45: North America Gamma Linolenic Acid Market Attractiveness by Nature, 2025 to 2035
  • Figure 46: North America Gamma Linolenic Acid Market Attractiveness by Form, 2025 to 2035
  • Figure 47: North America Gamma Linolenic Acid Market Attractiveness by End-use, 2025 to 2035
  • Figure 48: North America Gamma Linolenic Acid Market Attractiveness by Country, 2025 to 2035
  • Figure 49: Latin America Gamma Linolenic Acid Market Value (US$ Mn) by Nature, 2025 to 2035
  • Figure 50: Latin America Gamma Linolenic Acid Market Value (US$ Mn) by Form, 2025 to 2035
  • Figure 51: Latin America Gamma Linolenic Acid Market Value (US$ Mn) by End-use, 2025 to 2035
  • Figure 52: Latin America Gamma Linolenic Acid Market Value (US$ Mn) by Country, 2025 to 2035
  • Figure 53: Latin America Gamma Linolenic Acid Market Value (US$ Mn) Analysis by Country, 2020 to 2035
  • Figure 54: Latin America Gamma Linolenic Acid Market Volume (Tons) Analysis by Country, 2020 to 2035
  • Figure 55: Latin America Gamma Linolenic Acid Market Value Share (%) and BPS Analysis by Country, 2025 to 2035
  • Figure 56: Latin America Gamma Linolenic Acid Market Y-o-Y Growth (%) Projections by Country, 2025 to 2035
  • Figure 57: Latin America Gamma Linolenic Acid Market Value (US$ Mn) Analysis by Nature, 2020 to 2035
  • Figure 58: Latin America Gamma Linolenic Acid Market Volume (Tons) Analysis by Nature, 2020 to 2035
  • Figure 59: Latin America Gamma Linolenic Acid Market Value Share (%) and BPS Analysis by Nature, 2025 to 2035
  • Figure 60: Latin America Gamma Linolenic Acid Market Y-o-Y Growth (%) Projections by Nature, 2025 to 2035
  • Figure 61: Latin America Gamma Linolenic Acid Market Value (US$ Mn) Analysis by Form, 2020 to 2035
  • Figure 62: Latin America Gamma Linolenic Acid Market Volume (Tons) Analysis by Form, 2020 to 2035
  • Figure 63: Latin America Gamma Linolenic Acid Market Value Share (%) and BPS Analysis by Form, 2025 to 2035
  • Figure 64: Latin America Gamma Linolenic Acid Market Y-o-Y Growth (%) Projections by Form, 2025 to 2035
  • Figure 65: Latin America Gamma Linolenic Acid Market Value (US$ Mn) Analysis by End-use, 2020 to 2035
  • Figure 66: Latin America Gamma Linolenic Acid Market Volume (Tons) Analysis by End-use, 2020 to 2035
  • Figure 67: Latin America Gamma Linolenic Acid Market Value Share (%) and BPS Analysis by End-use, 2025 to 2035
  • Figure 68: Latin America Gamma Linolenic Acid Market Y-o-Y Growth (%) Projections by End-use, 2025 to 2035
  • Figure 69: Latin America Gamma Linolenic Acid Market Attractiveness by Nature, 2025 to 2035
  • Figure 70: Latin America Gamma Linolenic Acid Market Attractiveness by Form, 2025 to 2035
  • Figure 71: Latin America Gamma Linolenic Acid Market Attractiveness by End-use, 2025 to 2035
  • Figure 72: Latin America Gamma Linolenic Acid Market Attractiveness by Country, 2025 to 2035
  • Figure 73: Europe Gamma Linolenic Acid Market Value (US$ Mn) by Nature, 2025 to 2035
  • Figure 74: Europe Gamma Linolenic Acid Market Value (US$ Mn) by Form, 2025 to 2035
  • Figure 75: Europe Gamma Linolenic Acid Market Value (US$ Mn) by End-use, 2025 to 2035
  • Figure 76: Europe Gamma Linolenic Acid Market Value (US$ Mn) by Country, 2025 to 2035
  • Figure 77: Europe Gamma Linolenic Acid Market Value (US$ Mn) Analysis by Country, 2020 to 2035
  • Figure 78: Europe Gamma Linolenic Acid Market Volume (Tons) Analysis by Country, 2020 to 2035
  • Figure 79: Europe Gamma Linolenic Acid Market Value Share (%) and BPS Analysis by Country, 2025 to 2035
  • Figure 80: Europe Gamma Linolenic Acid Market Y-o-Y Growth (%) Projections by Country, 2025 to 2035
  • Figure 81: Europe Gamma Linolenic Acid Market Value (US$ Mn) Analysis by Nature, 2020 to 2035
  • Figure 82: Europe Gamma Linolenic Acid Market Volume (Tons) Analysis by Nature, 2020 to 2035
  • Figure 83: Europe Gamma Linolenic Acid Market Value Share (%) and BPS Analysis by Nature, 2025 to 2035
  • Figure 84: Europe Gamma Linolenic Acid Market Y-o-Y Growth (%) Projections by Nature, 2025 to 2035
  • Figure 85: Europe Gamma Linolenic Acid Market Value (US$ Mn) Analysis by Form, 2020 to 2035
  • Figure 86: Europe Gamma Linolenic Acid Market Volume (Tons) Analysis by Form, 2020 to 2035
  • Figure 87: Europe Gamma Linolenic Acid Market Value Share (%) and BPS Analysis by Form, 2025 to 2035
  • Figure 88: Europe Gamma Linolenic Acid Market Y-o-Y Growth (%) Projections by Form, 2025 to 2035
  • Figure 89: Europe Gamma Linolenic Acid Market Value (US$ Mn) Analysis by End-use, 2020 to 2035
  • Figure 90: Europe Gamma Linolenic Acid Market Volume (Tons) Analysis by End-use, 2020 to 2035
  • Figure 91: Europe Gamma Linolenic Acid Market Value Share (%) and BPS Analysis by End-use, 2025 to 2035
  • Figure 92: Europe Gamma Linolenic Acid Market Y-o-Y Growth (%) Projections by End-use, 2025 to 2035
  • Figure 93: Europe Gamma Linolenic Acid Market Attractiveness by Nature, 2025 to 2035
  • Figure 94: Europe Gamma Linolenic Acid Market Attractiveness by Form, 2025 to 2035
  • Figure 95: Europe Gamma Linolenic Acid Market Attractiveness by End-use, 2025 to 2035
  • Figure 96: Europe Gamma Linolenic Acid Market Attractiveness by Country, 2025 to 2035
  • Figure 97: East Asia Gamma Linolenic Acid Market Value (US$ Mn) by Nature, 2025 to 2035
  • Figure 98: East Asia Gamma Linolenic Acid Market Value (US$ Mn) by Form, 2025 to 2035
  • Figure 99: East Asia Gamma Linolenic Acid Market Value (US$ Mn) by End-use, 2025 to 2035
  • Figure 100: East Asia Gamma Linolenic Acid Market Value (US$ Mn) by Country, 2025 to 2035
  • Figure 101: East Asia Gamma Linolenic Acid Market Value (US$ Mn) Analysis by Country, 2020 to 2035
  • Figure 102: East Asia Gamma Linolenic Acid Market Volume (Tons) Analysis by Country, 2020 to 2035
  • Figure 103: East Asia Gamma Linolenic Acid Market Value Share (%) and BPS Analysis by Country, 2025 to 2035
  • Figure 104: East Asia Gamma Linolenic Acid Market Y-o-Y Growth (%) Projections by Country, 2025 to 2035
  • Figure 105: East Asia Gamma Linolenic Acid Market Value (US$ Mn) Analysis by Nature, 2020 to 2035
  • Figure 106: East Asia Gamma Linolenic Acid Market Volume (Tons) Analysis by Nature, 2020 to 2035
  • Figure 107: East Asia Gamma Linolenic Acid Market Value Share (%) and BPS Analysis by Nature, 2025 to 2035
  • Figure 108: East Asia Gamma Linolenic Acid Market Y-o-Y Growth (%) Projections by Nature, 2025 to 2035
  • Figure 109: East Asia Gamma Linolenic Acid Market Value (US$ Mn) Analysis by Form, 2020 to 2035
  • Figure 110: East Asia Gamma Linolenic Acid Market Volume (Tons) Analysis by Form, 2020 to 2035
  • Figure 111: East Asia Gamma Linolenic Acid Market Value Share (%) and BPS Analysis by Form, 2025 to 2035
  • Figure 112: East Asia Gamma Linolenic Acid Market Y-o-Y Growth (%) Projections by Form, 2025 to 2035
  • Figure 113: East Asia Gamma Linolenic Acid Market Value (US$ Mn) Analysis by End-use, 2020 to 2035
  • Figure 114: East Asia Gamma Linolenic Acid Market Volume (Tons) Analysis by End-use, 2020 to 2035
  • Figure 115: East Asia Gamma Linolenic Acid Market Value Share (%) and BPS Analysis by End-use, 2025 to 2035
  • Figure 116: East Asia Gamma Linolenic Acid Market Y-o-Y Growth (%) Projections by End-use, 2025 to 2035
  • Figure 117: East Asia Gamma Linolenic Acid Market Attractiveness by Nature, 2025 to 2035
  • Figure 118: East Asia Gamma Linolenic Acid Market Attractiveness by Form, 2025 to 2035
  • Figure 119: East Asia Gamma Linolenic Acid Market Attractiveness by End-use, 2025 to 2035
  • Figure 120: East Asia Gamma Linolenic Acid Market Attractiveness by Country, 2025 to 2035
  • Figure 121: South Asia & Pacific Gamma Linolenic Acid Market Value (US$ Mn) by Nature, 2025 to 2035
  • Figure 122: South Asia & Pacific Gamma Linolenic Acid Market Value (US$ Mn) by Form, 2025 to 2035
  • Figure 123: South Asia & Pacific Gamma Linolenic Acid Market Value (US$ Mn) by End-use, 2025 to 2035
  • Figure 124: South Asia & Pacific Gamma Linolenic Acid Market Value (US$ Mn) by Country, 2025 to 2035
  • Figure 125: South Asia & Pacific Gamma Linolenic Acid Market Value (US$ Mn) Analysis by Country, 2020 to 2035
  • Figure 126: South Asia & Pacific Gamma Linolenic Acid Market Volume (Tons) Analysis by Country, 2020 to 2035
  • Figure 127: South Asia & Pacific Gamma Linolenic Acid Market Value Share (%) and BPS Analysis by Country, 2025 to 2035
  • Figure 128: South Asia & Pacific Gamma Linolenic Acid Market Y-o-Y Growth (%) Projections by Country, 2025 to 2035
  • Figure 129: South Asia & Pacific Gamma Linolenic Acid Market Value (US$ Mn) Analysis by Nature, 2020 to 2035
  • Figure 130: South Asia & Pacific Gamma Linolenic Acid Market Volume (Tons) Analysis by Nature, 2020 to 2035
  • Figure 131: South Asia & Pacific Gamma Linolenic Acid Market Value Share (%) and BPS Analysis by Nature, 2025 to 2035
  • Figure 132: South Asia & Pacific Gamma Linolenic Acid Market Y-o-Y Growth (%) Projections by Nature, 2025 to 2035
  • Figure 133: South Asia & Pacific Gamma Linolenic Acid Market Value (US$ Mn) Analysis by Form, 2020 to 2035
  • Figure 134: South Asia & Pacific Gamma Linolenic Acid Market Volume (Tons) Analysis by Form, 2020 to 2035
  • Figure 135: South Asia & Pacific Gamma Linolenic Acid Market Value Share (%) and BPS Analysis by Form, 2025 to 2035
  • Figure 136: South Asia & Pacific Gamma Linolenic Acid Market Y-o-Y Growth (%) Projections by Form, 2025 to 2035
  • Figure 137: South Asia & Pacific Gamma Linolenic Acid Market Value (US$ Mn) Analysis by End-use, 2020 to 2035
  • Figure 138: South Asia & Pacific Gamma Linolenic Acid Market Volume (Tons) Analysis by End-use, 2020 to 2035
  • Figure 139: South Asia & Pacific Gamma Linolenic Acid Market Value Share (%) and BPS Analysis by End-use, 2025 to 2035
  • Figure 140: South Asia & Pacific Gamma Linolenic Acid Market Y-o-Y Growth (%) Projections by End-use, 2025 to 2035
  • Figure 141: South Asia & Pacific Gamma Linolenic Acid Market Attractiveness by Nature, 2025 to 2035
  • Figure 142: South Asia & Pacific Gamma Linolenic Acid Market Attractiveness by Form, 2025 to 2035
  • Figure 143: South Asia & Pacific Gamma Linolenic Acid Market Attractiveness by End-use, 2025 to 2035
  • Figure 144: South Asia & Pacific Gamma Linolenic Acid Market Attractiveness by Country, 2025 to 2035
  • Figure 145: MEA Gamma Linolenic Acid Market Value (US$ Mn) by Nature, 2025 to 2035
  • Figure 146: MEA Gamma Linolenic Acid Market Value (US$ Mn) by Form, 2025 to 2035
  • Figure 147: MEA Gamma Linolenic Acid Market Value (US$ Mn) by End-use, 2025 to 2035
  • Figure 148: MEA Gamma Linolenic Acid Market Value (US$ Mn) by Country, 2025 to 2035
  • Figure 149: MEA Gamma Linolenic Acid Market Value (US$ Mn) Analysis by Country, 2020 to 2035
  • Figure 150: MEA Gamma Linolenic Acid Market Volume (Tons) Analysis by Country, 2020 to 2035
  • Figure 151: MEA Gamma Linolenic Acid Market Value Share (%) and BPS Analysis by Country, 2025 to 2035
  • Figure 152: MEA Gamma Linolenic Acid Market Y-o-Y Growth (%) Projections by Country, 2025 to 2035
  • Figure 153: MEA Gamma Linolenic Acid Market Value (US$ Mn) Analysis by Nature, 2020 to 2035
  • Figure 154: MEA Gamma Linolenic Acid Market Volume (Tons) Analysis by Nature, 2020 to 2035
  • Figure 155: MEA Gamma Linolenic Acid Market Value Share (%) and BPS Analysis by Nature, 2025 to 2035
  • Figure 156: MEA Gamma Linolenic Acid Market Y-o-Y Growth (%) Projections by Nature, 2025 to 2035
  • Figure 157: MEA Gamma Linolenic Acid Market Value (US$ Mn) Analysis by Form, 2020 to 2035
  • Figure 158: MEA Gamma Linolenic Acid Market Volume (Tons) Analysis by Form, 2020 to 2035
  • Figure 159: MEA Gamma Linolenic Acid Market Value Share (%) and BPS Analysis by Form, 2025 to 2035
  • Figure 160: MEA Gamma Linolenic Acid Market Y-o-Y Growth (%) Projections by Form, 2025 to 2035
  • Figure 161: MEA Gamma Linolenic Acid Market Value (US$ Mn) Analysis by End-use, 2020 to 2035
  • Figure 162: MEA Gamma Linolenic Acid Market Volume (Tons) Analysis by End-use, 2020 to 2035
  • Figure 163: MEA Gamma Linolenic Acid Market Value Share (%) and BPS Analysis by End-use, 2025 to 2035
  • Figure 164: MEA Gamma Linolenic Acid Market Y-o-Y Growth (%) Projections by End-use, 2025 to 2035
  • Figure 165: MEA Gamma Linolenic Acid Market Attractiveness by Nature, 2025 to 2035
  • Figure 166: MEA Gamma Linolenic Acid Market Attractiveness by Form, 2025 to 2035
  • Figure 167: MEA Gamma Linolenic Acid Market Attractiveness by End-use, 2025 to 2035
  • Figure 168: MEA Gamma Linolenic Acid Market Attractiveness by Country, 2025 to 2035

Frequently Asked Questions

At what rate will the industry grow?

The market is expected to grow at a CAGR of 4.9% throughout the forecast period.

What is the expected value of the industry by 2035?

By 2035, the sales value is expected to be worth USD 269.8 Million.

What are the key factors driving the market?

Growing awareness of arthritis is increasing demand for Gamma Linolenic Acid.

Which region accounts for the highest consumption?

North America is expected to dominate the global consumption.

Who are the key players in manufacturing?

Some of the key players in manufacturing include Merck KGaA, Enzo Life Sciences Inc., Cayman Chemical, Thermo Fisher Scientific & Changsha Vigorous-Tech.

Explore Similar Insights

Future Market Insights

Gamma Linolenic Acid Market