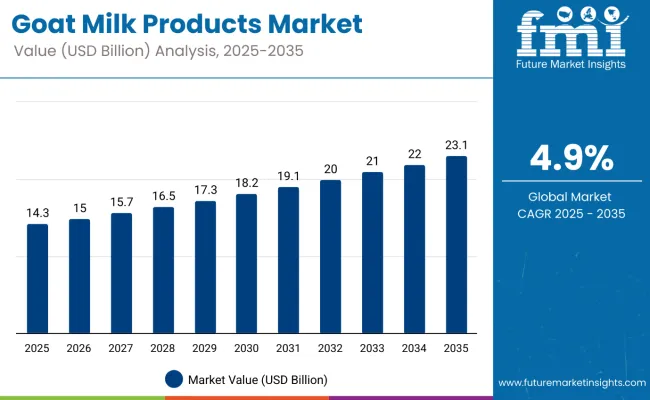
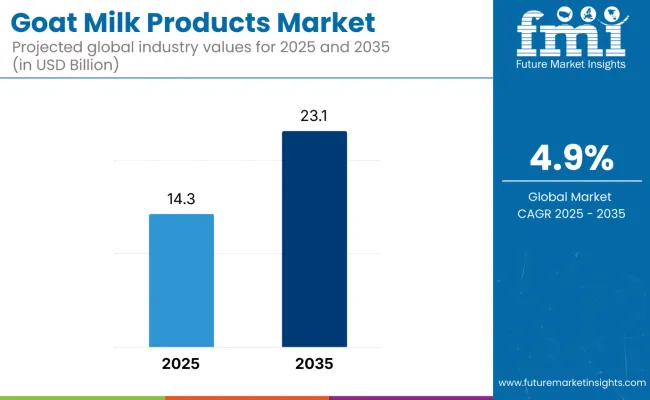
The goat milk products market is poised for significant growth, expanding from an estimated USD 14.3 billion in 2025 to USD 23.1 billion by 2035, reflecting a steady CAGR of 4.9%. This growth translates to an absolute market opportunity of USD 8.8 billion over the decade. The market’s upward trajectory is primarily driven by increasing consumer awareness about the nutritional and digestive benefits of goat milk compared to traditional dairy options. Additionally, rising demand in emerging economies, especially within the Asia Pacific region, is contributing substantially to market expansion.
By 2030, the market is projected to reach USD 18.2 billion. This represents an incremental growth of USD 3.9 billion during the first five years. The second half of the decade is expected to generate further growth of USD 4.9 billion, highlighting sustained expansion through 2035. Growth dynamics reflect both steady demand from existing consumers and new adoption driven by health trends and dietary shifts, emphasizing goat milk’s role as a functional and allergy-friendly dairy alternative.
Companies such as Ausnutria Dairy Corporation Ltd., Emmi Group, and Xi’an Baiyue Goat Dairy Group Co., Ltd. are strengthening their competitive positions by investing in product innovation and expanding their distribution networks. Focused efforts on developing protein-rich goat milk formulations, powdered milk for infant nutrition, and specialty cheeses are fueling market growth. The industry remains guided by stringent quality standards, consumer health trends, and sustainability practices in sourcing and farming.
| Metric | Value |
|---|---|
| Estimated Market Value (2025E) | USD 14.3 billion |
| Forecast Market Value (2035F) | USD 23.1 billion |
| Forecast CAGR (2025 to 2035) | 4.9% |
The market holds a significant share in the dairy alternatives sector, driven by its nutritional benefits, ease of digestion, and suitability for allergy-sensitive consumers. It accounts for 44% of the liquid milk segment, which is the largest product category within the market. The market also contributes notably to specialty dairy products, such as goat cheese and powdered milk for infant nutrition, which are gaining popularity for their health and functional benefits. Rising consumer demand for natural, nutrient-rich dairy options is reshaping retail and distribution channels globally.
The market is evolving through product innovation and expanding applications in health-focused segments. Advances in processing and formulation have enhanced the quality, shelf life, and nutritional profiles of goat milk products, making them attractive alternatives to conventional cow’s milk products. Companies are increasingly focusing on protein-enriched products, infant nutrition, and specialty cheeses to cater to diverse consumer needs. Regulatory compliance, quality assurance, and sustainable sourcing practices are pivotal in maintaining consumer trust and market growth.
The market is growing due to increasing consumer awareness of its nutritional benefits, easier digestibility, and hypoallergenic properties compared to cow’s milk. As more people seek natural and healthy dairy alternatives, goat milk is favored for its rich protein content, vitamins, and minerals that support overall wellness. The rising demand is particularly strong among health-conscious consumers, infants, elderly populations, and individuals with cow milk allergies or intolerances.
Additionally, innovations in product development such as protein-enriched goat milk, powdered forms for infant nutrition, and specialty cheeses are driving market expansion. Improved processing techniques have enhanced product quality, shelf life, and convenience, making these products more accessible through supermarkets, hypermarkets, and online retail channels. The growing preference for clean-label, natural dairy products supports sustained demand across diverse consumer segments globally.
With expanding distribution networks, government incentives in key producing regions, and increasing focus on sustainability in goat farming, the market outlook remains positive. Manufacturers prioritizing product efficacy, nutritional value, and sustainable sourcing are well-positioned to capitalize on the evolving consumer trends trending toward healthier and more natural dairy choices.
The market is segmented by product, type, distribution channel, and region. By product, the market is divided into milk, cheese, butter, milk powder, and others. Based on type, the market is bifurcated into liquid milk and powdered milk. In terms of distribution channel, the market is segmented into hypermarkets & supermarkets, convenience stores, specialty stores, and online retail. Regionally, the market is classified into North America, Latin America, Europe, Asia Pacific, and MEA (Middle East & Africa).
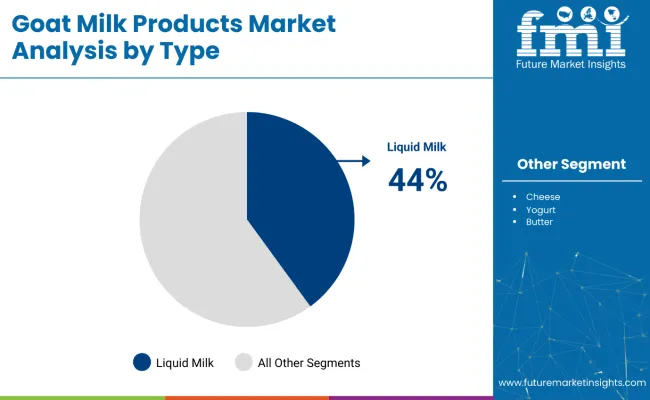
The liquid milk segment holds a leading 44% share in the type category, reflecting consumer preference for fresh, minimally processed goat dairy products and their superior nutritional retention compared to processed alternatives. Liquid goat milk is increasingly preferred due to its natural digestibility, hypoallergenic properties, and rich nutritional profile including essential vitamins, minerals, and easily absorbed proteins.
The segment benefits from rising consumer demand for natural, wholesome dairy alternatives that align with health-conscious lifestyle trends and dietary requirements of lactose-intolerant individuals. Manufacturers are focusing on expanding organic and grass-fed liquid goat milk production capabilities, catering to both retail and foodservice markets while maintaining cold-chain distribution networks.
As consumer awareness of goat milk's health benefits increases and retail infrastructure for fresh dairy products expands globally, liquid goat milk's role as the preferred natural dairy alternative is expected to strengthen, supporting steady growth trajectory across both developed and emerging markets.
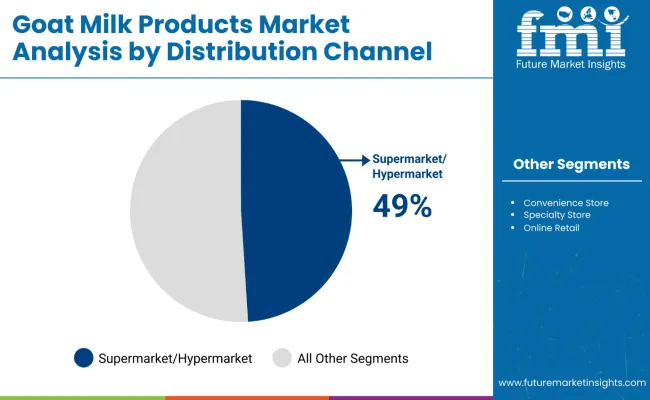
The supermarkets & hypermarkets segment dominates the distribution category with a 49% market share, driven by enhanced product accessibility, comprehensive product assortment, and consumer preference for one-stop shopping convenience. These large-format retailers provide optimal refrigeration infrastructure and extensive shelf space necessary for goat milk products' proper storage and display.
The segment continues to benefit from retailers' strategic focus on expanding specialty dairy sections and health-focused product categories that attract premium-conscious consumers. Innovations in cold-chain logistics and point-of-sale marketing have made supermarkets more effective platforms for introducing consumers to goat milk products and educating them about nutritional benefits.
As the organized retail sector continues to expand globally and consumer shopping patterns increasingly favor convenience and product variety, supermarkets & hypermarkets are expected to maintain strong market leadership within the broader goat milk products distribution landscape, particularly in urban and suburban markets worldwide.
From 2025 to 2035, health-conscious consumers increasingly adopted natural dairy alternatives to address digestive sensitivities, nutritional deficiencies, and lifestyle preferences. This shift positions goat milk product manufacturers offering high-quality, organic, and specialized formulations as key partners in supporting next-generation nutrition and wellness-focused dietary solutions.
Rising Health Consciousness Drives Goat Milk Products Market Growth
The steady increase in consumer awareness about digestive health and natural nutrition has been identified as the primary catalyst for growth in the goat milk products market. In 2024, breakthrough research highlighting goat milk's superior digestibility and hypoallergenic properties prompted food manufacturers globally to incorporate goat milk into innovative nutritional formulations. By 2025, dairy producers were expected to expand product portfolios with enhanced nutritional profiles and specialized applications to accommodate consumer demands for healthier dairy alternatives.
These developments indicate that consistent health and wellness trends, not short-term market fluctuations, are fueling procurement cycles. Manufacturers providing high-quality, organic goat milk products with proven nutritional benefits are therefore well-positioned to capture sustained demand from health-conscious consumers and specialized nutrition segments.
Specialized Nutrition Applications Create Market Expansion Opportunity
In 2024, food manufacturers began integrating goat milk powder into infant formula and therapeutic nutrition products to address lactose sensitivity and enhance digestibility, leading to reported improvements in consumer acceptance and nutritional outcomes. By 2025, goat milk-based formulations and specialized dairy products were being embedded directly into health and wellness product strategies, allowing real-time optimization of nutritional effectiveness and consumer satisfaction.
These implementations demonstrate that when specialized nutrition applications are incorporated with high-quality goat milk ingredients, consumer health outcomes are significantly enhanced. Food companies that adopt premium goat milk products with proven nutritional and digestibility advantages are being positioned to gain competitive advantage, offering superior health-focused products with improved consumer acceptance and regulatory compliance potential.
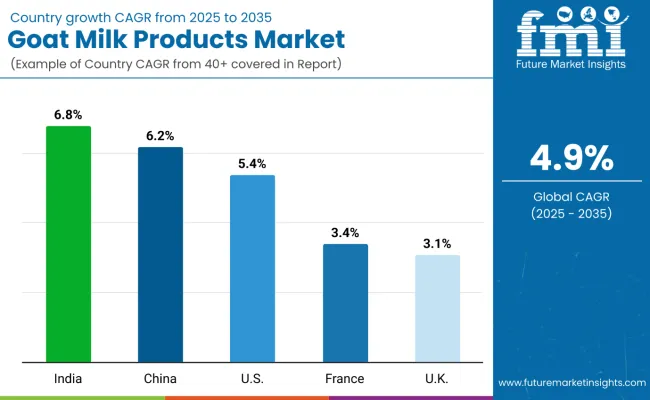
| Country | CAGR (2025 to 2035) |
|---|---|
| India | 6.8% |
| China | 6.2% |
| United States | 5.4% |
| France | 3.4% |
| United Kingdom | 3.1% |
The United States leads with the highest projected CAGR of 5.4%, driven by strong consumer health consciousness, expanding organic retail channels, and significant investment in R&D by major players. India follows closely at 6.8%, supported by its massive goat population, government subsidies exceeding 25%, and traditional consumption patterns creating robust domestic demand. China ranks third with 6.2% growth, fueled primarily by infant formula demand and expanding middle-class purchasing power, while leveraging extensive production infrastructure. The United Kingdom shows 3.1% growth, supported by rising health-conscious demographics and expanding vegan/allergy-sensitive consumer segments seeking natural alternatives. France exhibits the most moderate growth at 3.4%, though this reflects a mature market with established goat cheese traditions and focus on premium export opportunities.
The report covers an in-depth analysis of 40+ countries; five top-performing OECD countries are highlighted below.
The USA goat milk products market holds robust growth with a projected CAGR of 5.4% from 2025 to 2035. This growth is fueled by increasing consumer focus on health and wellness, driving demand for allergen-friendly and organic dairy alternatives. The market benefits from expanding distribution channels, including specialty food stores, organic supermarkets, and a growing online retail presence. Rising consumer interest in goat milk-based infant nutrition and premium artisanal cheeses is also stimulating product diversification. The USA market is characterized by innovation from key players such as Emmi Group and Ausnutria, which are investing heavily in R&D to capture evolving consumer preferences. Sustainability and animal welfare are gaining importance, reinforcing consumer trust and expanding market penetration.
Sales of goat milk products in the UK are expected to grow at a CAGR of about 3.1%, driven by rising consumer interest in healthier, natural dairy alternatives. The UK market is defined by growing vegan, allergy-sensitive, and health-conscious demographics actively seeking goat milk products. Retail penetration is increasing, especially through supermarkets, convenience stores, and rapidly expanding online channels. Product innovation is evident with a widening range of goat milk yogurts, cheeses, and powdered milk, catering to multiple consumer needs. Government policies supporting sustainable agriculture and animal welfare foster enhanced production capabilities, boosting market confidence. The rise of niche brands and artisanal producers complements mainstream marketing strategies. Sustainability narratives are reinforced in packaging and sourcing.
Revenue from goat milk products in India dominates the global goat milk products market, reflecting the country’s large goat population and traditional consumption patterns. The market is projected to grow at a CAGR of 6.8%, driven by government subsidies supporting goat farming and increasing consumer awareness about nutritional benefits. Rural and urban consumers are increasingly recognizing goat milk's digestive advantages and nutritional superiority over cow's milk. The market benefits from established distribution networks across both traditional and modern retail channels. Government initiatives providing over 25% subsidies on goat farming costs are encouraging production expansion. Rising disposable income and health consciousness are driving demand for premium goat dairy products. Local and regional producers are investing in processing technology to improve product quality and shelf life.
Demand for goat milk products in China is the second-largest global market with a projected CAGR of around 6.2% between 2025-2035. The market growth is primarily driven by increasing demand for infant formula and growing health consciousness among consumers. China's large-scale dairy production infrastructure supports both domestic consumption and export activities. Government policies promoting food safety and quality standards are enhancing consumer confidence in goat dairy products. The expanding middle class and rising disposable income are fueling demand for premium and organic goat milk products. E-commerce platforms and modern retail channels are improving product accessibility across urban and rural areas. Companies like Xi'an Baiyue Goat Dairy Group are leading innovation in processing technology and product development. Import demand for high-quality goat milk powder, particularly for infant nutrition, continues to drive market expansion.
Revenue from goat milk products in France is projected to grow at a CAGR of about 3.4%, underpinned by its longstanding cultural affinity for goat cheese and dairy traditions. The French market is distinguished by strong domestic production as well as significant export activity in premium goat dairy products. Functional food innovation, including fortified and protein-enriched goat milk varieties, is gaining traction among younger and health-conscious consumers. Government support and subsidies for organic goat farming contribute to production capacity expansion and quality improvements. Increasing international demand and export opportunities create an upward growth trajectory. Artisan producers remain central to maintaining France's traditional goat cheese reputation while embracing modernization. Consumers continue to value authenticity alongside innovation, fostering diverse market offerings.
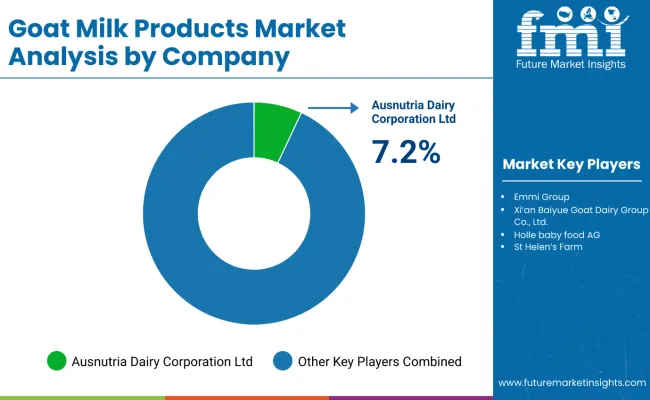
The market is moderately consolidated, featuring established dairy producers with varying degrees of processing expertise and product specialization. Ausnutria Dairy Corporation Ltd. and Emmi Group lead the premium segment, supplying high-quality goat milk products for infant nutrition applications and specialized dairy formulations. Their strength lies in advanced processing technologies and international quality certifications.
Xi'an Baiyue Goat Dairy Group Co., Ltd. differentiates through large-scale production capabilities, including specialized goat milk powder and infant formula products that cater to Asian markets and export opportunities. Holle Baby Food AG and HiPP focus on organic and biodynamic goat milk formulations, addressing growing demand for natural and premium infant nutrition products in European markets.
Regional players such as St Helen's Farm and Courtyard Farms emphasize local market expertise and artisanal production methods, ensuring product quality and supply chain traceability for domestic specialty dairy and gourmet food segments. Meanwhile, established dairy companies like Hewitt's Dairy and Woolwich Dairy Inc. are investing in goat milk processing capabilities to diversify their specialty dairy portfolios.
| Items | Values |
|---|---|
| Quantitative Units (2025) | USD 14.3 Billion |
| Type | Liquid Milk, Powdered Milk, and Others |
| Product | Milk, Cheese, Butter, Milk Powder, and Others (Yogurt, Ice Cream, Infant Formula, Beverages, a nd Nutritional Supplements) |
| Distribution Channel | Hypermarkets & Supermarkets, Convenience Stores, Specialty Stores, and Online Retail |
| Regions Covered | North America, Europe, Asia-Pacific, Latin America, Middle East & Africa |
| Country Covered | United States, Canada, United Kingdom, Germany, France, China, Japan, South Korea, Brazil, Australia and 40+ countries |
| Key Companies Profiled | Ausnutria Dairy Corporation Ltd., Emmi Group, Goat Partners International Inc., Holle baby food AG, St Helen's Farm, Hewitt's Dairy, Woolwich Dairy Inc., Xi'an Baiyue Goat Dairy Group Co. Ltd., HiPP, and Courtyard Farms. |
| Additional Attributes | Dollar sales by product type and distribution channel, growing usage in infant nutrition and health-conscious consumer segments, stable demand in functional food and specialty dairy applications, innovations in processing technology and organic farming methods improve product quality, nutritional value, and consumer acceptance |
The global goat milk products market is estimated to be valued at USD 14.3 billion in 2025.
The market size for the goat milk products market is projected to reach USD 23.1 billion by 2035.
The goat milk products market is expected to grow at a 4.9% CAGR between 2025 and 2035.
The key product types in goat milk products market are liquid milk and powdered milk.
In terms of distribution channel, b2b segment to command 41.8% share in the goat milk products market in 2025.


Full Research Suite comprises of:
Market outlook & trends analysis
Interviews & case studies
Strategic recommendations
Vendor profiles & capabilities analysis
5-year forecasts
8 regions and 60+ country-level data splits
Market segment data splits
12 months of continuous data updates
DELIVERED AS:
PDF EXCEL ONLINE
Goat Handling Equipment Market Size and Share Forecast Outlook 2025 to 2035
Goat Creep Feeder Market Analysis by Material, Operation, Application and Region: A Forecast for 2025 and 2035
Automatic Goat Waterer Market Size and Share Forecast Outlook 2025 to 2035
Sheep and Goat Equipment Market Size and Share Forecast Outlook 2025 to 2035
Milk Carton Market Size and Share Forecast Outlook 2025 to 2035
Milking Automation Market Size and Share Forecast Outlook 2025 to 2035
Milking Robots Market Size and Share Forecast Outlook 2025 to 2035
Milk Packaging Market Size and Share Forecast Outlook 2025 to 2035
Milk Clarifier Market Size and Share Forecast Outlook 2025 to 2035
Milk Homogenizer Machine Market Size and Share Forecast Outlook 2025 to 2035
Milk Pasteurization Machines Market Size and Share Forecast Outlook 2025 to 2035
Milk Sterilizer Machine Market Size and Share Forecast Outlook 2025 to 2035
Milk Powder Packaging Market Size and Share Forecast Outlook 2025 to 2035
Milk Powder Packaging Machines Market Size and Share Forecast Outlook 2025 to 2035
Milk Protein Market - Size, Share, and Forecast 2025 to 2035
Milk Ingredients Market Analysis - Size, Share, and Forecast Outlook 2025 to 2035
Milk Mineral Concentrate Market Trends-Demand, Innovations & Forecast 2025 to 2035
Milk Thistle Market Analysis by Form, Distribution Channel and Region through 2035
Milk Powder Market Analysis by Type, Distribution Channel, Region and Other Applications Through 2035
Milk Tank Cooling System Market Growth – Trends & Forecast 2025 to 2035

Thank you!
You will receive an email from our Business Development Manager. Please be sure to check your SPAM/JUNK folder too.
Chat With
MaRIA