

- Market Size (2026)
- USD 1.7 Bn
- Forecast (2036)
- USD 3.4 Bn
- CAGR (2026 to 2036)
- 7.2%
How big is Groundwater Level Sensors Market in 2026?
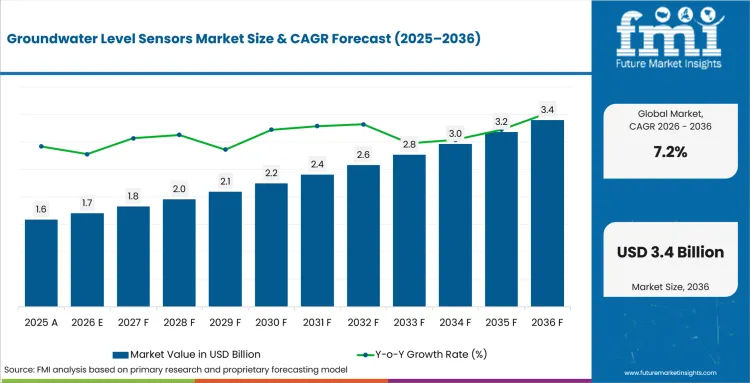
USD 1.7 billion in 2026 and USD 3.4 billion by 2036 at a 7.2% CAGR.
Sales of groundwater level sensors are estimated to rise at 7.2% CAGR through 2036, increasing valuation from USD 1.7 billion in 2026 to USD 3.4 billion by 2036. Continuous network operation requires instruments that record unattended wells so field gaps do not affect water planning. The USGS reported in April 2025 that pressure transducers and floats continuously monitor more than 2,000 groundwater sites nationwide. The installed network supports repeat purchases for rugged environmental sensor systems and compatible telemetry across public programs.
Environmental consultants select level sensing platforms that integrate logging without complicating battery replacement across long service periods. Water utilities favor water-level monitoring software that preserves calibration records and flags missing transmissions ahead of formal reporting.
Key Takeaways of Groundwater Level Sensors Market
- Public groundwater programs are automating dispersed wells that require dependable communication and extended service intervals across remote locations.
- Submersible pressure transducers are projected to hold 31.0% share in 2026 owing to compatibility with established observation wells.
- The 10-50 m range is estimated to represent 41.0% share in 2026 due to broad municipal and environmental coverage.
- SDI-12 - Modbus devices are forecast to capture 27.0% share in 2026 supported by established low-power logging networks.
- Flooded wellheads and weak communications increase maintenance costs across remote programs with limited regional service access.
- In-Situ and Solinst serve groundwater programs alongside OTT HydroMet while KELLER Pressure and Druck provide configurable pressure platforms.
Analyst Perspective
"Groundwater programs should evaluate the sensor and communication route as one operating system across the service interval. A low-drift transducer delivers limited value if venting, barometric correction or telemetry fails between field visits."
- Nikhil Kaitwade, Principal Consultant, Future Market Insights
How is the Groundwater Level Sensors Market segmented?
The groundwater level sensors industry is segmented by sensor type, measurement range, output - communication , application, end use, sales channel and region.
The market is organized by sensor type, measurement range, output - communication, application, end use, sales channel and region. Sensor types include submersible, vented, non-vented, non-contact, logger-integrated and telemetry-enabled models across ranges below 10 m through above 200 m. Communication options include analog, SDI-12, Modbus, Bluetooth, cellular and satellite routes for local or remote collection. Applications cover aquifer monitoring, dewatering, remediation, mining, irrigation and hazard monitoring across end users and sales channels.
What makes submersible pressure transducers central to the sensor type category?
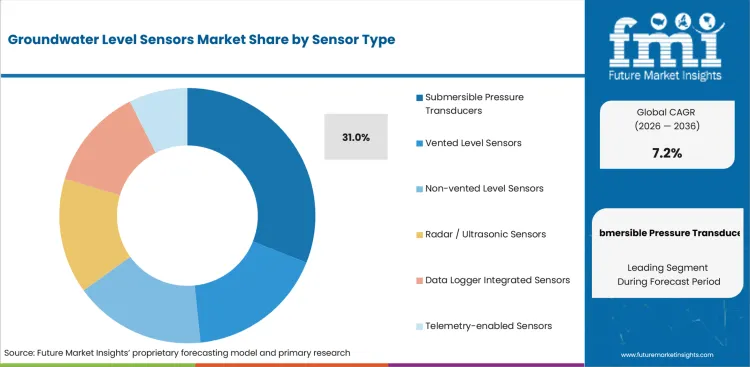
Submersible pressure transducers record hydrostatic pressure in observation wells and support unattended deployments across recurring field programs. Engineering teams select vented or absolute compensation according to moisture exposure and documented correction duties at each site.
- Submersible pressure transducers are set to lead the sensor type category with 31.0% share in 2026 due to established well compatibility and familiar installation hardware.
- Environmental monitoring contractors are increasingly selecting submersible pressure transducers, supported by protected cables and correction methods across unattended wells. Campbell Scientific's April 2026 manual covers titanium sensing with SDI-12 output and vented compensation while compatible environmental monitoring systems apply documented corrosion and communication requirements.
How does the 10-50 m segment influence selection within the measurement range category?
Moderate-depth wells cover municipal and environmental monitoring without specialized deep-cable handling across routine observation programs. OTT HydroMet's ecoLog 1000 lists measurement options from 4 m through 100 m within one integrated logger with onboard telemetry.
- By measurement range, the 10-50 m segment is estimated to hold 41.0% share in 2026 owing to common bore depths and manageable installation requirements.
- Sales of 10-50 m models are forecast to gain traction in municipal programs, supported by platform consistency across routine observation wells. A common instrument family also simplifies spare inventory and technician training while retaining compatible air pressure correction across seasonal monitoring contracts.
What role do SDI-12 - Modbus devices play within the output - communication category?
SDI-12 and Modbus provide established digital routes between field sensors and widely used acquisition equipment. Low-power operation suits stations that rely on batteries or solar power during extended unattended service.
- The output - communication category is forecast to be led by SDI-12 - Modbus devices at 27.0% share in 2026 due to established logger compatibility.
- SDI-12 - Modbus adoption is gaining momentum in remote programs, reinforced by consistent protocols during equipment replacement. Seametrics documents both protocols for its PT2X groundwater recorder within mixed-brand connected sensor networks used across remote groundwater programs. Compatible telemetry platforms transfer records without replacing existing measurement elements or revising approved field installations.
What supports demand for aquifer monitoring within the application category?
Aquifer monitoring requires depth records that separate recharge patterns from pumping effects across seasonal operating conditions. In April 2025, In-Situ described a Level TROLL and VuLink workflow that lets hydrogeologists review pumping wells without waiting for field retrieval.
- The aquifer monitoring segment is likely to capture 29.0% share in 2026 attributable to regulatory observation networks and long-term water-resource planning requirements.
- Aquifer monitoring systems are drawing demand from water agencies, supported by stable calibration and traceable maintenance across every observation well. Connected level records preserve comparable planning datasets throughout extended contracts and integrate separate water quality instrumentation without fragmenting the field communication route.
What are the drivers, restraints and opportunities in the Groundwater Level Sensors Market?
Automated networks require stable remote records, flooded wellheads interrupt data continuity, and integrated service packages reduce field visits across dispersed groundwater programs.
- Driver: Automated groundwater networks require stable measurements and timely transfer across dispersed wells during reporting cycles.
- Restraint: Flooded wellheads and communication failures interrupt records and raise investigation costs across remote sites during long service intervals.
- Opportunity: Integrated instruments and regional maintenance reduce repeated field visits across multi-year groundwater contracts while protecting record continuity.
Regional agencies depend on frequent readings from unattended wells across reporting areas and long service intervals. Agency hydrologists use smart water monitoring systems with transmission checks that identify missing records during reviews.
Flooded wellheads can damage vent tubes and radios across remote sites with limited protective infrastructure. Long regional service routes then increase restoration costs and prolong gaps within regulatory groundwater datasets.
Groundwater instrument manufacturers can bundle devices with installation guidance and regional maintenance for extended monitoring contracts. Regional teams use data logging systems to limit site visits and preserve continuous records throughout seasonal reporting.
Which country CAGRs are profiled in the Groundwater Level Sensors Market?
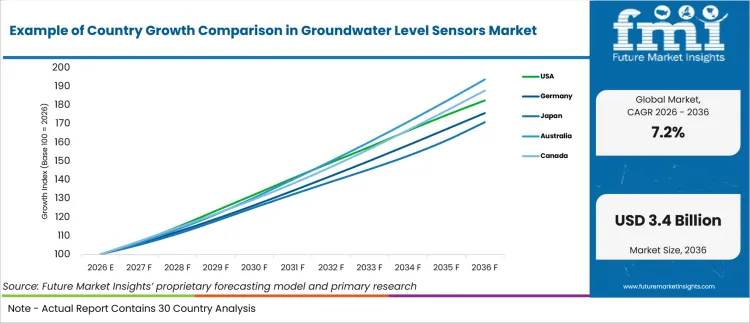
| Country | CAGR |
|---|---|
| Australia | 6.8% |
| Canada | 6.5% |
| United States | 6.2% |
| Germany | 5.8% |
| Japan | 5.5% |
How do country-level CAGRs compare in the Groundwater Level Sensors Market?
The country forecasts remain closely grouped across the groundwater level sensors market, with only 1.3 percentage points separating Australia and Japan. The pattern suggests that growth is being driven by increasing pressure on groundwater resources, stricter monitoring requirements and wider adoption of real-time sensor technologies rather than major differences in water infrastructure development.
- Australia benefits from ongoing groundwater management programs and growing reliance on monitoring systems to support water conservation and drought resilience strategies.
- Canada supports market expansion through increasing use of groundwater monitoring technologies across environmental, resource management and infrastructure projects.
- The United States reflects steady demand from agriculture, municipal water authorities and environmental agencies seeking continuous groundwater data collection.
- Germany maintains growth through stringent environmental monitoring standards and continued investment in sustainable water management practices.
- Japan supports market development through groundwater assessment initiatives and increasing adoption of automated monitoring systems for resource planning.
Comparable CAGRs may still reflect different market conditions because groundwater availability, regulatory requirements, monitoring network maturity and water management priorities vary across countries. The full report provides country-level CAGR analysis across North America, Latin America, Europe, East Asia, South Asia, Oceania and the Middle East and Africa.
Country-wise Analysis
- Australian groundwater programs span remote agricultural and mining basins that require unattended instruments across long travel distances and seasonal access restrictions caused by heat or flooding in isolated interior locations. Groundwater level sensor sales in Australia are forecast to expand at 6.8% CAGR by 2036, supported by national data expansion and established environmental service channels across regional public and private programs. The Bureau of Meteorology reported in May 2026 that Groundwater Explorer added more than 30,000 bores with updated records nationwide while sparse communications and lengthy service routes increase enclosure and maintenance requirements across long-term regional monitoring contracts.
- Ontario's provincial network is driving demand in Canada due to hourly monitoring at wells distributed across southern and northern districts with different climate conditions and support partnerships. Adoption of groundwater level sensors in Canada is estimated to expand at 6.5% CAGR through 2036, aided by accessible public data and established environmental consultants across water-resource planning programs. Ontario reported in December 2025 that the network records hourly water levels at 480 wells and water-quality data at 380 locations while winter travel and long distances from calibration centers raise support costs outside major service corridors during recurring groundwater reporting cycles across northern operating districts.
- United States agencies connect federal and state observation networks through shared databases that support drought planning across many jurisdictions with separate purchasing cycles and reporting priorities. Groundwater level sensor demand in the United States is forecast to rise at 6.2% CAGR over the forecast period, shaped by extensive infrastructure and experienced regional service providers across major basins. The USGS described a national network-of-networks model in March 2025 that supports public water decisions while separate agency budgets and data standards require coordinated renewal schedules through regional contracts and documented interfaces across local systems during multi-year monitoring programs across national observation networks.
- German state authorities operate formal groundwater networks under European water reporting duties that place logger reliability and documented measurement quality inside recurring public specifications and long maintenance cycles. Germany's groundwater level sensors outlook is anticipated to advance at 5.8% CAGR over the assessment period, driven by recurring monitoring duties and established local calibration capacity across state programs. Schleswig-Holstein's environment agency reported in June 2026 that 761 monitoring points across 398 sites use data loggers while decentralized purchasing produces separate qualification cycles and calibration routes for local engineering teams under recurring annual public contracts statewide with different regional service arrangements.
- Japanese research agencies publish regional groundwater-level series for tectonic monitoring and aquifer programs that require stable instruments and detailed records across managed observation locations linked to earthquake prediction. Japan is estimated to post 5.5% CAGR over the forecast period, influenced by experienced instrument distributors and coordinated public monitoring programs across regional engineering networks. The Coordinating Committee for Earthquake Prediction published volume 115 in March 2026 with regional groundwater-level observations covering May through October 2025 while Japanese-language records and local procedures lengthen distributor coordination outside major metropolitan service centers and slow entry into specialized municipal contracts under recurring public programs.
Who are the notable companies in the Groundwater Level Sensors Market?
In-Situ, Solinst, OTT HydroMet, Campbell Scientific, KELLER Pressure, Xylem, Druck / Crane Company and Seametrics are the notable companies shaping this market.
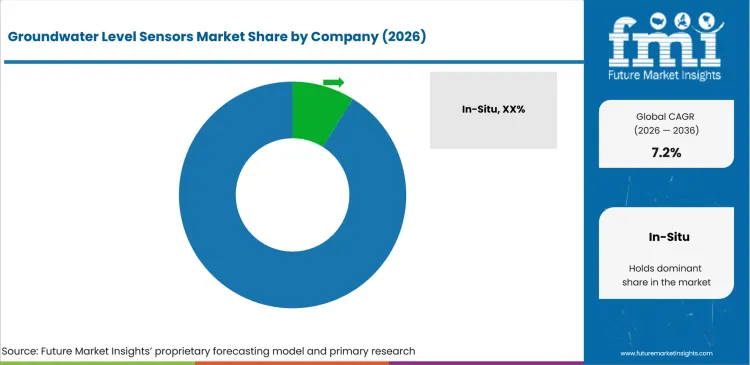
The competitive field remains moderately fragmented as groundwater programs compare instrument fit alongside telemetry and regional maintenance. Specialist brands retain access to projects through application support while diversified monitoring groups compete through broader data platforms and multi-region service networks.
- In-Situ and OTT HydroMet operate within Veralto's water-monitoring portfolio while retaining separate groundwater instrument lines and software routes.
- Solinst and Seametrics emphasize dedicated loggers or connected pressure sensors for distributed groundwater monitoring programs with varied communication requirements.
- Campbell Scientific and KELLER Pressure connect submersible sensing with configurable acquisition platforms while Xylem and Druck extend pressure portfolios across regional water programs.
Competitive Benchmarking: Groundwater Level Sensors Market
| Company | Submersible Platform | Digital Communication | Groundwater Application Support | Geographic Reach |
|---|---|---|---|---|
| In-Situ | High | High | High | Global or multi-region |
| Solinst | Medium | High | High | Global or multi-region |
| OTT HydroMet | Medium | High | High | Global or multi-region |
| Campbell Scientific | Medium | High | Medium | Global or multi-region |
| KELLER Pressure | High | High | High | Global or multi-region |
| Xylem | Medium | Medium | Medium | Global or multi-region |
| Druck / Crane Company | High | Medium | High | Global or multi-region |
| Seametrics | Medium | High | Medium | Regional and selected export markets |
Scoring basis: Submersible coverage is High for two families, Medium for one and Low for narrow coverage. Digital communication is High for two protocols, Medium for one and Low for analog output. Application support is High for groundwater workflows, Medium for one and Low for incidental coverage while sources establish reach.
Key Developments in the Groundwater Level Sensors Market
- In May 2026, KELLER Pressure introduced the 36XW-CTD series for simultaneous measurement of depth alongside conductivity and temperature across groundwater networks.
- In April 2026, Solinst documented a fifty-station Punjab network using Levelogger instruments and GSM telemetry to centralize groundwater and rainfall records across dispersed agricultural sites.
- In January 2026, Baker Hughes completed the sale of Precision Sensors & Instrumentation to Crane Company and transferred Druck's groundwater-capable pressure portfolio into Crane's sensing business.
- In July 2025, In-Situ expanded VuLink and HydroVu compatibility to any SDI-12 instrument so mixed-brand groundwater programs can centralize remote logging without replacing installed devices.
Groundwater Level Sensors Market - Report Scope
| Coverage field | Report scope |
|---|---|
| Market breakdown | By sensor type, measurement range, output - communication , application, end use, sales channel and geographic region. |
| Quantitative Units | Revenue in USD billion and CAGR in %. |
| Market Definition | The market covers sensors and integrated loggers sold specifically for groundwater-level measurement across commercial programs. |
| Regions Covered | North America, Latin America, Europe, East Asia, South Asia and Pacific, and Middle East and Africa. |
| Countries Covered | Australia, Canada, United States, Germany, Japan, and 20+ countries included in the full report. |
| Key Companies Profiled | In-Situ, Solinst, OTT HydroMet, Campbell Scientific, KELLER Pressure, Xylem, Druck / Crane Company and Seametrics. |
| Forecast Period | 2026-2036. |
| Approach | Primary and secondary research with market triangulation. |
Groundwater Level Sensors Market - Research Methodology
| Method | Approach |
|---|---|
| Primary Research | FMI analysts gathered input from manufacturers, service providers, technology developers, distributors, end users, procurement teams, and subject-matter experts. Interviews examined purchasing decisions, product or service evaluation, adoption barriers, approval requirements, pricing considerations, and expectations for technical or commercial support. Respondents were also asked what evidence is required before a trial, pilot, or initial order develops into regular purchasing. |
| Desk Research | Desk research covered government statistics, regulatory publications, trade data, industry associations, technical literature, standards, company filings, product information, and official corporate announcements. Sources were reviewed for relevance, publication date, geographic coverage, and consistency with the defined market scope. Claims relating to performance, applications, approvals, capacity, investment, and commercial activity were retained only when supported by credible public evidence. |
| Market Sizing and Forecasting | The market model combined the baseline value with historical performance, segment structure, pricing and volume indicators, adoption levels, company participation, and country-level demand conditions. Forecast assumptions considered economic activity, investment trends, regulatory developments, technology adoption, purchasing cycles, supply availability, and barriers to wider market use. Segment and regional estimates were reconciled before the final market total was calculated. |
| Data Validation | Estimates were checked against multiple independent indicators, including public data, company activity, trade patterns, industry developments, and findings from primary interviews. Validation also tested whether products, services, applications, and company revenues fell within the defined market boundaries. Adjacent categories, unsupported claims, overlapping revenues, and activities without direct market relevance were excluded to reduce double counting and maintain consistency across segments and countries. |
Groundwater Level Sensors Market by Segments
Groundwater Level Sensors Market segmented by Sensor Type:
- Submersible Pressure Transducers
- Vented Level Sensors
- Non-vented Level Sensors
- Radar / Ultrasonic Sensors
- Data Logger Integrated Sensors
- Telemetry-enabled Sensors
Groundwater Level Sensors Market segmented by Measurement Range:
- 10-50 m
- <10 m
- 50-200 m
- >200 m
Groundwater Level Sensors Market segmented by Output - communication :
- SDI-12 - Modbus
- Analog 4-20 mA
- Bluetooth / Local Download
- Cellular / IoT Telemetry
- Satellite / Remote Telemetry
Groundwater Level Sensors Market segmented by Application:
- Aquifer Monitoring
- Construction Dewatering
- Environmental Remediation
- Mining & Quarrying
- Agriculture / Irrigation
- Flood & Drought Monitoring
Groundwater Level Sensors Market segmented by End Use:
- Water Utilities
- Environmental Consultants
- Government Agencies
- Mining / Industrial Sites
- Research Institutes
Groundwater Level Sensors Market segmented by Sales Channel:
- Instrumentation Distributors
- Direct OEM
- Monitoring Service Providers
- Project Integrators
Groundwater Level Sensors Market by Region:
- North America
- United States
- Canada
- Latin America
- Brazil
- Chile
- Mexico
- Rest of Latin America
- Western Europe
- Germany
- United Kingdom
- Italy
- Spain
- France
- Nordics
- Benelux
- Rest of Western Europe
- Eastern Europe
- Russia
- Poland
- Hungary
- Balkan and Baltic States
- Rest of Eastern Europe
- East Asia
- China
- Japan
- South Korea
- South Asia and Pacific
- India
- ASEAN
- Australia and New Zealand
- Rest of South Asia and Pacific
- Middle East and Africa
- Kingdom of Saudi Arabia
- Other GCC Countries
- Türkiye
- South Africa
- Other African Union Countries
- Rest of Middle East and Africa
Research Sources and Bibliography
- USA Geological Survey. (2025, April 4). Climate Response Network.
- USA Geological Survey. (2025, March 20). National Water Monitoring Network.
- Bureau of Meteorology. (2026, May). Groundwater information.
- Government of Ontario. (2025, December 18). 2025 Minister’s Annual Report on Drinking Water.
- Landesamt für Umwelt des Landes Schleswig-Holstein. (2026, June 29). Landesmessstellen Grundwasserstand (Überwachung des mengenmäßigen Zustands).
- Coordinating Committee for Earthquake Prediction. (2026, March). Report Vol. 115.
- Delfino, A. (2025, April 11). Your Go-To Guide for Efficient Aquifer Testing.
- In-Situ. (2025, July 10). In-Situ Expands Telemetry Compatibility, Simplifies Logging Data from SDI-12 Instruments.
- Solinst Canada Ltd. (2026, April 16). Automated Water Monitoring Network for Sustainable Agriculture.
- KELLER Pressure. (2026, May 27). KELLER 36XW-CTD - High-Precision Multi-Parameter Probe for Water.
- Baker Hughes. (2026, January 5). Baker Hughes Closes Sale of Precision Sensors & Instrumentation Product Line to Crane Company.
- OTT HydroMet. (n.d.). OTT ecoLog 1000, Measuring Range 0-13 ft (0-4 m) with 26 Ah Battery and Conductivity.
- Campbell Scientific. (2026, April 10). CS451/CS456 Online Product Manual.
- KELLER Pressure. (n.d.). KELLER Pressure Level Probes.
- Xylem. (n.d.). WaterLOG YSI Submersible Pressure Transducer.
- In-Situ. (2026, January 21). In-Situ Joins OTT HydroMet, a Veralto Operating Company.
This bibliography is provided for reader reference and is not exhaustive. The full report contains the complete reference list and detailed citations
This Report Answers
- How large is the groundwater level sensors market in 2026 and 2036?
- Which operating conditions support demand for groundwater level sensors across remote networks?
- Which sensor type is projected to hold significant share during 2026?
- How does measurement range shape groundwater sensor selection across observation wells?
- Which communication routes support reliable remote groundwater monitoring across distributed sites?
- How do profiled country growth rates affect commercial entry conditions?
- Which companies supply verified groundwater sensing and communication capabilities across regions?
- What limits groundwater level sensor deployment across remote monitoring sites?
Frequently Asked Questions
What is driving growth in the groundwater level sensors market?
Public agencies are expanding automated observation networks that require dependable readings and remote data transfer across widely distributed wells during long reporting cycles.
Who are the key players in the groundwater level sensors market?
Key participants include In-Situ and Solinst alongside OTT HydroMet and Campbell Scientific while KELLER Pressure and Druck support pressure-based groundwater measurement.
What is a notable restraint in the groundwater level sensors market?
Flooded wellheads can damage vented equipment and interrupt communications while long service distances raise restoration costs across unattended groundwater monitoring locations.
Why should executives track the groundwater level sensors market?
Groundwater records influence drought planning and infrastructure decisions while replacement cycles generate recurring service demand across agencies managing long-term observation networks.
What business problem does the groundwater level sensors market address?
Groundwater level sensors replace irregular manual readings with consistent well records that help analysts separate seasonal change from pumping effects during aquifer investigations.
What should groundwater monitoring teams evaluate in this market?
Monitoring teams should compare measurement range and pressure compensation against local hydrogeology while confirming protocol compatibility and regional service access for long deployments.
What limits return on investment for groundwater level sensors?
Frequent site visits and fragmented communications can offset equipment savings across dispersed groundwater programs that lack remote diagnostics or accessible regional maintenance routes.
What supports long-term confidence in groundwater level sensor performance?
Stable calibration records and documented communication compatibility support dependable performance across regulatory monitoring programs and strengthen confidence throughout long-term reporting cycles.
Preview the report firsthand - request a free sample
Get SampleGet the brochure for pricing and purchase details.
Get PDFTable of Content
- Key Takeaways
- Market Size and CAGR
- Top Growth Driver
- Fastest Growing Segment
- Leading Region
- Key Companies
- Emerging Opportunities
- Executive Summary
- Global Market Outlook
- Demand-side Trends
- Supply-side Trends
- Technology Roadmap Analysis
- Analysis and Recommendations
- Analyst Perspective (What is happening? Why now? What should investors know?)
- Key Questions Answered
- How large is the market?
- What is the CAGR?
- What are key trends?
- Which region dominates?
- Who are the leaders?
- Market Overview
- Market Coverage / Taxonomy
- Market Definition / Scope / Limitations
- Research Methodology
- Chapter Orientation
- Analytical Lens and Working Hypotheses
- Market Structure, Signals, and Trend Drivers
- Benchmarking and Cross-market Comparability
- Market Sizing, Forecasting, and Opportunity Mapping
- Research Design and Evidence Framework
- Desk Research Programme (Secondary Evidence)
- Expert Input and Fieldwork (Primary Evidence)
- Tooling, Models, and Reference Databases
- Data Engineering and Model Build
- Quality Assurance and Audit Trail
- Market Background
- Market Dynamics (Drivers, Restraints, Opportunity, Trends)
- Scenario Forecast (Optimistic, Likely, Conservative)
- Impact Analysis
- AI Impact
- Sustainability Impact
- Regulatory Impact
- Technology Impact
- Consumer / Buyer Analysis
- Purchase Drivers
- Adoption Barriers
- Buyer Journey
- Opportunity Map Analysis
- Product Life Cycle Analysis
- Supply Chain Analysis
- Investment Feasibility Matrix
- Value Chain Analysis
- PESTLE and Porter's Analysis
- Regulatory Landscape
- Regional Parent Market Outlook
- Production and Consumption Statistics
- Import and Export Statistics
- Global Market Analysis and Forecast, 2021 to 2036
- Historical Market Size Value (USD Billion) Analysis, 2021 to 2025
- Current and Future Market Size Value (USD Billion) Projections, 2026 to 2036
- Y-o-Y Growth Trend Analysis
- Absolute $ Opportunity Analysis
- Global Market Pricing Analysis, 2021 to 2036
- Global Market Analysis and Forecast, By Sensor Type, 2021 to 2036
- Introduction / Key Findings
- Historical Market Size Value (USD Billion) Analysis By Sensor Type, 2021 to 2025
- Current and Future Market Size Value (USD Billion) Analysis and Forecast By Sensor Type, 2026 to 2036
- Submersible Pressure Transducers
- Vented Level Sensors
- Non-vented Level Sensors
- Radar / Ultrasonic Sensors
- Data Logger Integrated Sensors
- Telemetry-enabled Sensors
- Submersible Pressure Transducers
- Y-o-Y Growth Trend Analysis By Sensor Type, 2021 to 2025
- Absolute $ Opportunity Analysis By Sensor Type, 2026 to 2036
- Global Market Analysis and Forecast, By Measurement Range, 2021 to 2036
- Introduction / Key Findings
- Historical Market Size Value (USD Billion) Analysis By Measurement Range, 2021 to 2025
- Current and Future Market Size Value (USD Billion) Analysis and Forecast By Measurement Range, 2026 to 2036
- 10-50 m
- <10 m
- 50&-200 m
- >200 m
- 10-50 m
- Y-o-Y Growth Trend Analysis By Measurement Range, 2021 to 2025
- Absolute $ Opportunity Analysis By Measurement Range, 2026 to 2036
- Global Market Analysis and Forecast, By Output / Communication, 2021 to 2036
- Introduction / Key Findings
- Historical Market Size Value (USD Billion) Analysis By Output / Communication, 2021 to 2025
- Current and Future Market Size Value (USD Billion) Analysis and Forecast By Output / Communication, 2026 to 2036
- SDI-12 / Modbus
- Analog 4-20 mA
- Bluetooth / Local Download
- Cellular / IoT Telemetry
- Satellite / Remote Telemetry
- SDI-12 / Modbus
- Y-o-Y Growth Trend Analysis By Output / Communication, 2021 to 2025
- Absolute $ Opportunity Analysis By Output / Communication, 2026 to 2036
- Global Market Analysis and Forecast, By Application, 2021 to 2036
- Introduction / Key Findings
- Historical Market Size Value (USD Billion) Analysis By Application, 2021 to 2025
- Current and Future Market Size Value (USD Billion) Analysis and Forecast By Application, 2026 to 2036
- Aquifer Monitoring
- Construction Dewatering
- Environmental Remediation
- Mining & Quarrying
- Agriculture / Irrigation
- Flood & Drought Monitoring
- Aquifer Monitoring
- Y-o-Y Growth Trend Analysis By Application, 2021 to 2025
- Absolute $ Opportunity Analysis By Application, 2026 to 2036
- Global Market Analysis and Forecast, By End Use, 2021 to 2036
- Introduction / Key Findings
- Historical Market Size Value (USD Billion) Analysis By End Use, 2021 to 2025
- Current and Future Market Size Value (USD Billion) Analysis and Forecast By End Use, 2026 to 2036
- Water Utilities
- Environmental Consultants
- Government Agencies
- Mining / Industrial Sites
- Research Institutes
- Water Utilities
- Y-o-Y Growth Trend Analysis By End Use, 2021 to 2025
- Absolute $ Opportunity Analysis By End Use, 2026 to 2036
- Global Market Analysis and Forecast, By Sales Channel
- Introduction / Key Findings
- Historical Market Size Value (USD Billion) Analysis By Sales Channel, 2021 to 2025
- Current and Future Market Size Value (USD Billion) Analysis and Forecast By Sales Channel, 2026 to 2036
- Instrumentation Distributors
- Direct OEM
- Monitoring Service Providers
- Project Integrators
- Instrumentation Distributors
- Y-o-Y Growth Trend Analysis By Sales Channel, 2021 to 2025
- Absolute $ Opportunity Analysis By Sales Channel, 2026 to 2036
- Global Market Analysis and Forecast, By Region, 2021 to 2036
- Introduction
- Historical Market Size Value (USD Billion) Analysis By Region, 2021 to 2025
- Current Market Size Value (USD Billion) Analysis and Forecast By Region, 2026 to 2036
- North America
- Latin America
- Western Europe
- Eastern Europe
- East Asia
- South Asia and Pacific
- Middle East & Africa
- Market Attractiveness Analysis By Region
- North America Market Analysis and Forecast, By Country, 2021 to 2036
- Historical Market Size Value (USD Billion) Trend Analysis By Market Taxonomy, 2021 to 2025
- Market Size Value (USD Billion) Forecast By Market Taxonomy, 2026 to 2036
- By Country
- USA
- Canada
- By Sensor Type
- By Measurement Range
- By Output / Communication
- By Application
- By End Use
- By Sales Channel
- By Country
- Market Attractiveness Analysis
- By Country
- By Sensor Type
- By Measurement Range
- By Output / Communication
- By Application
- By End Use
- By Sales Channel
- Key Takeaways
- Latin America Market Analysis and Forecast, By Country
- Historical Market Size Value (USD Billion) Trend Analysis By Market Taxonomy, 2021 to 2025
- Market Size Value (USD Billion) Forecast By Market Taxonomy, 2026 to 2036
- By Country
- Brazil
- Mexico
- Chile
- Rest of Latin America
- By Sensor Type
- By Measurement Range
- By Output / Communication
- By Application
- By End Use
- By Sales Channel
- By Country
- Market Attractiveness Analysis
- By Country
- By Sensor Type
- By Measurement Range
- By Output / Communication
- By Application
- By End Use
- By Sales Channel
- Key Takeaways
- Western Europe Market Analysis and Forecast, By Country
- Historical Market Size Value (USD Billion) Trend Analysis By Market Taxonomy, 2021 to 2025
- Market Size Value (USD Billion) Forecast By Market Taxonomy, 2026 to 2036
- By Country
- Germany
- UK
- Italy
- Spain
- France
- Nordic
- BENELUX
- Rest of Western Europe
- By Sensor Type
- By Measurement Range
- By Output / Communication
- By Application
- By End Use
- By Sales Channel
- By Country
- Market Attractiveness Analysis
- By Country
- By Sensor Type
- By Measurement Range
- By Output / Communication
- By Application
- By End Use
- By Sales Channel
- Key Takeaways
- Eastern Europe Market Analysis and Forecast, By Country
- Historical Market Size Value (USD Billion) Trend Analysis By Market Taxonomy, 2021 to 2025
- Market Size Value (USD Billion) Forecast By Market Taxonomy, 2026 to 2036
- By Country
- Russia
- Poland
- Hungary
- Balkan & Baltic
- Rest of Eastern Europe
- By Sensor Type
- By Measurement Range
- By Output / Communication
- By Application
- By End Use
- By Sales Channel
- By Country
- Market Attractiveness Analysis
- By Country
- By Sensor Type
- By Measurement Range
- By Output / Communication
- By Application
- By End Use
- By Sales Channel
- Key Takeaways
- East Asia Market Analysis and Forecast, By Country
- Historical Market Size Value (USD Billion) Trend Analysis By Market Taxonomy, 2021 to 2025
- Market Size Value (USD Billion) Forecast By Market Taxonomy, 2026 to 2036
- By Country
- China
- Japan
- South Korea
- By Sensor Type
- By Measurement Range
- By Output / Communication
- By Application
- By End Use
- By Sales Channel
- By Country
- Market Attractiveness Analysis
- By Country
- By Sensor Type
- By Measurement Range
- By Output / Communication
- By Application
- By End Use
- By Sales Channel
- Key Takeaways
- South Asia and Pacific Market Analysis and Forecast, By Country
- Historical Market Size Value (USD Billion) Trend Analysis By Market Taxonomy, 2021 to 2025
- Market Size Value (USD Billion) Forecast By Market Taxonomy, 2026 to 2036
- By Country
- India
- ASEAN
- Australia & New Zealand
- Rest of South Asia and Pacific
- By Sensor Type
- By Measurement Range
- By Output / Communication
- By Application
- By End Use
- By Sales Channel
- By Country
- Market Attractiveness Analysis
- By Country
- By Sensor Type
- By Measurement Range
- By Output / Communication
- By Application
- By End Use
- By Sales Channel
- Key Takeaways
- Middle East & Africa Market Analysis and Forecast, By Country
- Historical Market Size Value (USD Billion) Trend Analysis By Market Taxonomy, 2021 to 2025
- Market Size Value (USD Billion) Forecast By Market Taxonomy, 2026 to 2036
- By Country
- Kingdom of Saudi Arabia
- Other GCC Countries
- Türkiye
- South Africa
- Other African Union
- Rest of Middle East & Africa
- By Sensor Type
- By Measurement Range
- By Output / Communication
- By Application
- By End Use
- By Sales Channel
- By Country
- Market Attractiveness Analysis
- By Country
- By Sensor Type
- By Measurement Range
- By Output / Communication
- By Application
- By End Use
- By Sales Channel
- Key Takeaways
- Key Countries Market Analysis
- USA
- Pricing Analysis
- Market Share Analysis, 2025
- By Sensor Type
- By Measurement Range
- By Output / Communication
- By Application
- By End Use
- By Sales Channel
- Canada
- Pricing Analysis
- Market Share Analysis, 2025
- By Sensor Type
- By Measurement Range
- By Output / Communication
- By Application
- By End Use
- By Sales Channel
- Mexico
- Pricing Analysis
- Market Share Analysis, 2025
- By Sensor Type
- By Measurement Range
- By Output / Communication
- By Application
- By End Use
- By Sales Channel
- Brazil
- Pricing Analysis
- Market Share Analysis, 2025
- By Sensor Type
- By Measurement Range
- By Output / Communication
- By Application
- By End Use
- By Sales Channel
- Chile
- Pricing Analysis
- Market Share Analysis, 2025
- By Sensor Type
- By Measurement Range
- By Output / Communication
- By Application
- By End Use
- By Sales Channel
- Germany
- Pricing Analysis
- Market Share Analysis, 2025
- By Sensor Type
- By Measurement Range
- By Output / Communication
- By Application
- By End Use
- By Sales Channel
- UK
- Pricing Analysis
- Market Share Analysis, 2025
- By Sensor Type
- By Measurement Range
- By Output / Communication
- By Application
- By End Use
- By Sales Channel
- Italy
- Pricing Analysis
- Market Share Analysis, 2025
- By Sensor Type
- By Measurement Range
- By Output / Communication
- By Application
- By End Use
- By Sales Channel
- Spain
- Pricing Analysis
- Market Share Analysis, 2025
- By Sensor Type
- By Measurement Range
- By Output / Communication
- By Application
- By End Use
- By Sales Channel
- France
- Pricing Analysis
- Market Share Analysis, 2025
- By Sensor Type
- By Measurement Range
- By Output / Communication
- By Application
- By End Use
- By Sales Channel
- India
- Pricing Analysis
- Market Share Analysis, 2025
- By Sensor Type
- By Measurement Range
- By Output / Communication
- By Application
- By End Use
- By Sales Channel
- ASEAN
- Pricing Analysis
- Market Share Analysis, 2025
- By Sensor Type
- By Measurement Range
- By Output / Communication
- By Application
- By End Use
- By Sales Channel
- Australia & New Zealand
- Pricing Analysis
- Market Share Analysis, 2025
- By Sensor Type
- By Measurement Range
- By Output / Communication
- By Application
- By End Use
- By Sales Channel
- China
- Pricing Analysis
- Market Share Analysis, 2025
- By Sensor Type
- By Measurement Range
- By Output / Communication
- By Application
- By End Use
- By Sales Channel
- Japan
- Pricing Analysis
- Market Share Analysis, 2025
- By Sensor Type
- By Measurement Range
- By Output / Communication
- By Application
- By End Use
- By Sales Channel
- South Korea
- Pricing Analysis
- Market Share Analysis, 2025
- By Sensor Type
- By Measurement Range
- By Output / Communication
- By Application
- By End Use
- By Sales Channel
- Russia
- Pricing Analysis
- Market Share Analysis, 2025
- By Sensor Type
- By Measurement Range
- By Output / Communication
- By Application
- By End Use
- By Sales Channel
- Poland
- Pricing Analysis
- Market Share Analysis, 2025
- By Sensor Type
- By Measurement Range
- By Output / Communication
- By Application
- By End Use
- By Sales Channel
- Hungary
- Pricing Analysis
- Market Share Analysis, 2025
- By Sensor Type
- By Measurement Range
- By Output / Communication
- By Application
- By End Use
- By Sales Channel
- Kingdom of Saudi Arabia
- Pricing Analysis
- Market Share Analysis, 2025
- By Sensor Type
- By Measurement Range
- By Output / Communication
- By Application
- By End Use
- By Sales Channel
- Türkiye
- Pricing Analysis
- Market Share Analysis, 2025
- By Sensor Type
- By Measurement Range
- By Output / Communication
- By Application
- By End Use
- By Sales Channel
- South Africa
- Pricing Analysis
- Market Share Analysis, 2025
- By Sensor Type
- By Measurement Range
- By Output / Communication
- By Application
- By End Use
- By Sales Channel
- USA
- Market Structure Analysis
- Competition Dashboard
- Competition Benchmarking
- Market Share Analysis of Top Players
- By Regional
- By Sensor Type
- By Measurement Range
- By Output / Communication
- By Application
- By End Use
- By Sales Channel
- Emerging Startups
- Innovation Benchmarking
- Competition Analysis
- Competition Deep Dive
- In-Situ
- Overview
- Product Portfolio
- Profitability by Market Segments
- Sales Footprint
- Strategy Overview
- Marketing Strategy
- Product Strategy
- Channel Strategy
- Solinst
- OTT HydroMet
- Campbell Scientific
- Keller
- Xylem
- Druck / Baker Hughes
- Aquaread
- Van Essen Instruments
- Seametrics
- In-Situ
- Case Studies
- Success Stories
- Recent Developments
- Competition Deep Dive
- Assumptions & Acronyms Used


