Hardness Testing Machine Market Size and Share Forecast Outlook 2025 to 2035

The Hardness Testing Machine Market is estimated to be valued at USD 351.0 million in 2025 and is projected to reach USD 651.5 million by 2035, registering a compound annual growth rate (CAGR) of 6.4% over the forecast period.
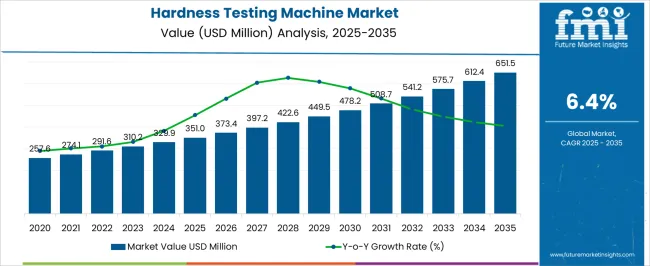
Quick Stats for Hardness Testing Machine Market

  • Hardness Testing Machine Market Value (2025): USD 351.0 million
  • Hardness Testing Machine Market Forecast Value (2035): USD 651.5 million
  • Hardness Testing Machine Market Forecast CAGR: 6.4%
  • Leading Segment in Hardness Testing Machine Market in 2025: Rockwell Hardness Test Method (40.0%)
  • Key Growth Regions in Hardness Testing Machine Market: North America, Asia-Pacific, Europe
  • Top Key Players in Hardness Testing Machine Market: Mitutoyo Corporation, ZwickRoell Group, FINE Group, Akash Industries, Struers, Innovatest Europe BV, Shimadzu Corporation, FIE Group

Hardness Testing Machine Market Value Analysis

Hardness Testing Machine Market Key Takeaways

Metric Value
Hardness Testing Machine Market Estimated Value in (2025 E) USD 351.0 million
Hardness Testing Machine Market Forecast Value in (2035 F) USD 651.5 million
Forecast CAGR (2025 to 2035) 6.4%

Why is the Hardness Testing Machine Market Growing?

The Hardness Testing Machine market is experiencing steady growth driven by the increasing demand for precise and reliable material characterization across manufacturing and quality assurance processes. The current market landscape reflects a growing focus on industrial automation, high-quality metal production, and stringent regulatory standards for product durability and safety.

Rising adoption in sectors such as automotive, aerospace, and heavy machinery is influencing market expansion, as manufacturers require consistent material hardness testing to ensure product integrity and compliance. Technological advancements in automated testing, digital readouts, and software-enabled data analysis have enhanced operational efficiency and reduced human error, further driving the adoption of modern hardness testing machines.

The future outlook for this market is shaped by ongoing improvements in testing speed, accuracy, and versatility, enabling machines to cater to a wider range of materials Additionally, the integration of testing machines with Industry 4.0 frameworks and smart manufacturing systems is expected to create significant growth opportunities, positioning hardness testing as a critical component of industrial quality assurance and research applications worldwide.

Segmental Analysis

The hardness testing machine market is segmented by test method, testing material, and geographic regions. By test method, hardness testing machine market is divided into Rockwell Hardness Test Method, Brinell Hardness Test Method, Vickers Hardness Test Method, and Other Hardness Test Method. In terms of testing material, hardness testing machine market is classified into Metal Hardness Testing Machine (Steel, Aluminum, Iron etc.), Plastic Hardness Testing Machine, and Rubber Hardness Testing Machine. Regionally, the hardness testing machine industry is classified into North America, Latin America, Western Europe, Eastern Europe, Balkan & Baltic Countries, Russia & Belarus, Central Asia, East Asia, South Asia & Pacific, and the Middle East & Africa.
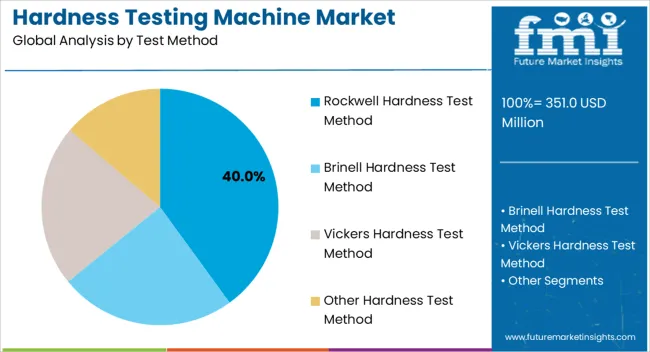
Insights into the Rockwell Hardness Test Method Segment

Hardness Testing Machine Market Analysis By Test Method

The Rockwell Hardness Test Method segment is projected to hold 40.00% of the Hardness Testing Machine market revenue share in 2025, making it the leading test method. This prominence is being attributed to its simplicity, repeatability, and rapid execution compared to other hardness test methods. The Rockwell method allows for efficient measurement across a wide range of metals, delivering results that can be easily standardized for quality assurance purposes.

Its adoption has been driven by its compatibility with automated systems and its ability to provide consistent and reliable data for production environments. Industries where high-volume testing is required, such as automotive and metal fabrication, have favored Rockwell machines due to reduced testing time and minimal sample preparation.

Furthermore, the method supports varying loads and indenter types, allowing for versatile applications across different material grades The scalability and proven accuracy of Rockwell testing have reinforced its leadership, ensuring continued preference among manufacturers who prioritize operational efficiency and adherence to industry standards.
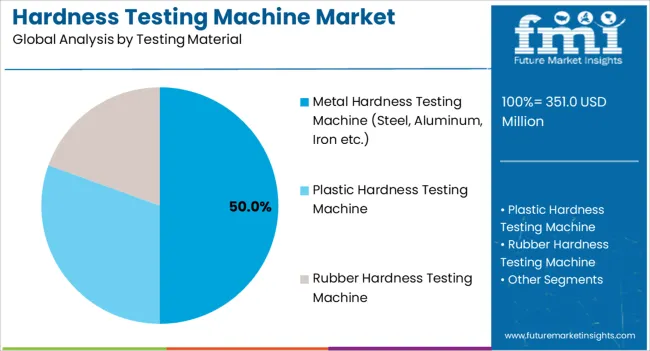
Insights into the Metal Hardness Testing Machine Segment

Hardness Testing Machine Market Analysis By Testing Material

The Metal Hardness Testing Machine segment is expected to account for 50.00% of the Hardness Testing Machine market revenue share in 2025, emerging as the dominant testing material category. This leadership is being driven by the critical need for material integrity assessment in metals such as steel, aluminum, and iron, which form the backbone of manufacturing, construction, and heavy engineering industries.

The growth of this segment has been influenced by rising industrial production, stringent quality requirements, and increased regulatory compliance, particularly in sectors where metal durability is essential for safety and performance. Metal hardness testing machines allow precise evaluation of mechanical properties, supporting better product design, process optimization, and lifecycle management.

Automation and digital integration have further enhanced their utility, enabling faster, accurate, and traceable results for large-scale production environments The continued preference for metal hardness testing is expected to persist as industrial growth accelerates, driving demand for reliable, high-performance testing solutions capable of addressing the diverse requirements of modern manufacturing and engineering applications.

Market Overview

Hardness Testing Machine Market: Introduction

Hardness is defined as resistance to indentation. Hardness is not a functional physical property, it’s a characteristics of a material. Hardness is calculated by measuring the permanent depth of the indentation. Hardness testing machines is used to measure the hardness of a material in order to determine its suitability.

Hardness testing machines is also used to evaluate the coating layer and material integrity of an equipment. There are mainly three types of hardness test methods, the Brinell hardness test, the Rockwell hardness test, and the Vickers hardness test. Among these, Rockwell hardness test is consider to be most widely used technique and provides more precise evaluation as compared to other processes.

However Brinell hardness test is carried out when the subjected material is too coarse or too rough exterior and Vickers hardness test is carried when the material is very thin or have very small surface area. Hardness testing machines plays an important role and finds huge application in wide range of industries including construction, mining, automotive, aerospace, energy & power, and metalworking etc.

Owing to increasing demand of advanced material testing methods, hardness testing machine is estimated to witness a rising demand during the forecast period. This in turn is anticipated to positively impact the global hardness testing machine market.
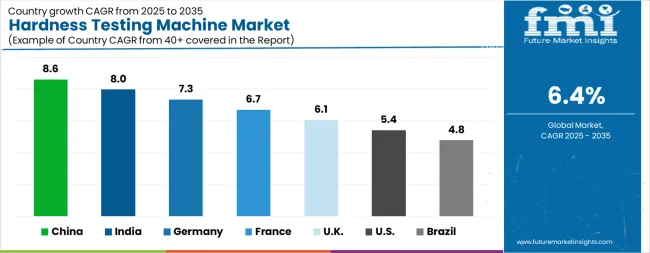
Analysis of Hardness Testing Machine Market By Key Countries

Hardness Testing Machine Market Cagr Analysis By Country

Country CAGR
China 8.6%
India 8.0%
Germany 7.3%
France 6.7%
UK 6.1%
USA 5.4%
Brazil 4.8%

Country-wise Analysis

The Hardness Testing Machine Market is expected to register a CAGR of 6.4% during the forecast period, exhibiting varied country level momentum. China leads with the highest CAGR of 8.6%, followed by India at 8.0%. Developed markets such as Germany, France, and the UK continue to expand steadily, while the USA is likely to grow at consistent rates. Brazil posts the lowest CAGR at 4.8%, yet still underscores a broadly positive trajectory for the global Hardness Testing Machine Market. In 2024, Germany held a dominant revenue in the Western Europe market and is expected to grow with a CAGR of 7.3%. The USA Hardness Testing Machine Market is estimated to be valued at USD 120.1 million in 2025 and is anticipated to reach a valuation of USD 203.6 million by 2035. Sales are projected to rise at a CAGR of 5.4% over the forecast period between 2025 and 2035. While Japan and South Korea markets are estimated to be valued at USD 19.2 million and USD 12.1 million respectively in 2025.
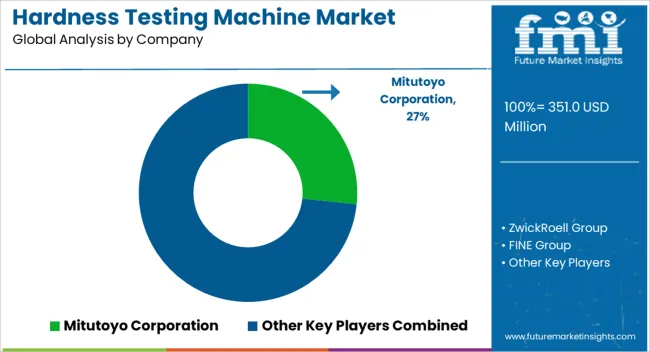
Key Players in the Hardness Testing Machine Market

Hardness Testing Machine Market Analysis By Company

  • Mitutoyo Corporation
  • ZwickRoell Group
  • FINE Group
  • Akash Industries
  • Struers
  • Innovatest Europe BV
  • Shimadzu Corporation
  • FIE Group

Scope of the Report

Item Value
Quantitative Units USD 351.0 Million
Test Method Rockwell Hardness Test Method, Brinell Hardness Test Method, Vickers Hardness Test Method, and Other Hardness Test Method
Testing Material Metal Hardness Testing Machine (Steel, Aluminum, Iron etc.), Plastic Hardness Testing Machine, and Rubber Hardness Testing Machine
Regions Covered North America, Europe, Asia-Pacific, Latin America, Middle East & Africa
Country Covered United States, Canada, Germany, France, United Kingdom, China, Japan, India, Brazil, South Africa
Key Companies Profiled Mitutoyo Corporation, ZwickRoell Group, FINE Group, Akash Industries, Struers, Innovatest Europe BV, Shimadzu Corporation, and FIE Group

Hardness Testing Machine Market by Segments

Test Method:

  • Rockwell Hardness Test Method
  • Brinell Hardness Test Method
  • Vickers Hardness Test Method
  • Other Hardness Test Method

Testing Material:

  • Metal Hardness Testing Machine (Steel, Aluminum, Iron etc.)
  • Plastic Hardness Testing Machine
  • Rubber Hardness Testing Machine

Region:

  • North America
    • USA
    • Canada
    • Mexico
  • Latin America
    • Brazil
    • Chile
    • Rest of Latin America
  • Western Europe
    • Germany
    • UK
    • Italy
    • Spain
    • France
    • Nordic
    • BENELUX
    • Rest of Western Europe
  • Eastern Europe
    • Russia
    • Poland
    • Hungary
    • Balkan & Baltic
    • Rest of Eastern Europe
  • East Asia
    • China
    • Japan
    • South Korea
  • South Asia and Pacific
    • India
    • ASEAN
    • Australia & New Zealand
    • Rest of South Asia and Pacific
  • Middle East & Africa
    • Kingdom of Saudi Arabia
    • Other GCC Countries
    • Turkiye
    • South Africa
    • Other African Union
    • Rest of Middle East & Africa

Table of Content

  1. Executive Summary
    • Global Market Outlook
    • Demand-side Trends
    • Supply-side Trends
    • Technology Roadmap Analysis
    • Analysis and Recommendations
  2. Market Overview
    • Market Coverage / Taxonomy
    • Market Definition / Scope / Limitations
  3. Market Background
    • Market Dynamics
      • Drivers
      • Restraints
      • Opportunity
      • Trends
    • Scenario Forecast
      • Demand in Optimistic Scenario
      • Demand in Likely Scenario
      • Demand in Conservative Scenario
    • Opportunity Map Analysis
    • Product Life Cycle Analysis
    • Supply Chain Analysis
    • Investment Feasibility Matrix
    • Value Chain Analysis
    • PESTLE and Porter’s Analysis
    • Regulatory Landscape
    • Regional Parent Market Outlook
    • Production and Consumption Statistics
    • Import and Export Statistics
  4. Global Market Analysis 2020 to 2024 and Forecast, 2025 to 2035
    • Historical Market Size Value (USD Million) Analysis, 2020 to 2024
    • Current and Future Market Size Value (USD Million) Projections, 2025 to 2035
      • Y-o-Y Growth Trend Analysis
      • Absolute $ Opportunity Analysis
  5. Global Market Pricing Analysis 2020 to 2024 and Forecast 2025 to 2035
  6. Global Market Analysis 2020 to 2024 and Forecast 2025 to 2035, By Test Method
    • Introduction / Key Findings
    • Historical Market Size Value (USD Million) Analysis By Test Method , 2020 to 2024
    • Current and Future Market Size Value (USD Million) Analysis and Forecast By Test Method , 2025 to 2035
      • Rockwell Hardness Test Method
      • Brinell Hardness Test Method
      • Vickers Hardness Test Method
      • Other Hardness Test Method
    • Y-o-Y Growth Trend Analysis By Test Method , 2020 to 2024
    • Absolute $ Opportunity Analysis By Test Method , 2025 to 2035
  7. Global Market Analysis 2020 to 2024 and Forecast 2025 to 2035, By Testing Material
    • Introduction / Key Findings
    • Historical Market Size Value (USD Million) Analysis By Testing Material, 2020 to 2024
    • Current and Future Market Size Value (USD Million) Analysis and Forecast By Testing Material, 2025 to 2035
      • Metal (Steel, Aluminum, Iron etc.)
      • Plastic
      • Rubber
    • Y-o-Y Growth Trend Analysis By Testing Material, 2020 to 2024
    • Absolute $ Opportunity Analysis By Testing Material, 2025 to 2035
  8. Global Market Analysis 2020 to 2024 and Forecast 2025 to 2035, By Region
    • Introduction
    • Historical Market Size Value (USD Million) Analysis By Region, 2020 to 2024
    • Current Market Size Value (USD Million) Analysis and Forecast By Region, 2025 to 2035
      • North America
      • Latin America
      • Western Europe
      • Eastern Europe
      • East Asia
      • South Asia and Pacific
      • Middle East & Africa
    • Market Attractiveness Analysis By Region
  9. North America Market Analysis 2020 to 2024 and Forecast 2025 to 2035, By Country
    • Historical Market Size Value (USD Million) Trend Analysis By Market Taxonomy, 2020 to 2024
    • Market Size Value (USD Million) Forecast By Market Taxonomy, 2025 to 2035
      • By Country
        • USA
        • Canada
        • Mexico
      • By Test Method
      • By Testing Material
    • Market Attractiveness Analysis
      • By Country
      • By Test Method
      • By Testing Material
    • Key Takeaways
  10. Latin America Market Analysis 2020 to 2024 and Forecast 2025 to 2035, By Country
    • Historical Market Size Value (USD Million) Trend Analysis By Market Taxonomy, 2020 to 2024
    • Market Size Value (USD Million) Forecast By Market Taxonomy, 2025 to 2035
      • By Country
        • Brazil
        • Chile
        • Rest of Latin America
      • By Test Method
      • By Testing Material
    • Market Attractiveness Analysis
      • By Country
      • By Test Method
      • By Testing Material
    • Key Takeaways
  11. Western Europe Market Analysis 2020 to 2024 and Forecast 2025 to 2035, By Country
    • Historical Market Size Value (USD Million) Trend Analysis By Market Taxonomy, 2020 to 2024
    • Market Size Value (USD Million) Forecast By Market Taxonomy, 2025 to 2035
      • By Country
        • Germany
        • UK
        • Italy
        • Spain
        • France
        • Nordic
        • BENELUX
        • Rest of Western Europe
      • By Test Method
      • By Testing Material
    • Market Attractiveness Analysis
      • By Country
      • By Test Method
      • By Testing Material
    • Key Takeaways
  12. Eastern Europe Market Analysis 2020 to 2024 and Forecast 2025 to 2035, By Country
    • Historical Market Size Value (USD Million) Trend Analysis By Market Taxonomy, 2020 to 2024
    • Market Size Value (USD Million) Forecast By Market Taxonomy, 2025 to 2035
      • By Country
        • Russia
        • Poland
        • Hungary
        • Balkan & Baltic
        • Rest of Eastern Europe
      • By Test Method
      • By Testing Material
    • Market Attractiveness Analysis
      • By Country
      • By Test Method
      • By Testing Material
    • Key Takeaways
  13. East Asia Market Analysis 2020 to 2024 and Forecast 2025 to 2035, By Country
    • Historical Market Size Value (USD Million) Trend Analysis By Market Taxonomy, 2020 to 2024
    • Market Size Value (USD Million) Forecast By Market Taxonomy, 2025 to 2035
      • By Country
        • China
        • Japan
        • South Korea
      • By Test Method
      • By Testing Material
    • Market Attractiveness Analysis
      • By Country
      • By Test Method
      • By Testing Material
    • Key Takeaways
  14. South Asia and Pacific Market Analysis 2020 to 2024 and Forecast 2025 to 2035, By Country
    • Historical Market Size Value (USD Million) Trend Analysis By Market Taxonomy, 2020 to 2024
    • Market Size Value (USD Million) Forecast By Market Taxonomy, 2025 to 2035
      • By Country
        • India
        • ASEAN
        • Australia & New Zealand
        • Rest of South Asia and Pacific
      • By Test Method
      • By Testing Material
    • Market Attractiveness Analysis
      • By Country
      • By Test Method
      • By Testing Material
    • Key Takeaways
  15. Middle East & Africa Market Analysis 2020 to 2024 and Forecast 2025 to 2035, By Country
    • Historical Market Size Value (USD Million) Trend Analysis By Market Taxonomy, 2020 to 2024
    • Market Size Value (USD Million) Forecast By Market Taxonomy, 2025 to 2035
      • By Country
        • Kingdom of Saudi Arabia
        • Other GCC Countries
        • Turkiye
        • South Africa
        • Other African Union
        • Rest of Middle East & Africa
      • By Test Method
      • By Testing Material
    • Market Attractiveness Analysis
      • By Country
      • By Test Method
      • By Testing Material
    • Key Takeaways
  16. Key Countries Market Analysis
    • USA
      • Pricing Analysis
      • Market Share Analysis, 2024
        • By Test Method
        • By Testing Material
    • Canada
      • Pricing Analysis
      • Market Share Analysis, 2024
        • By Test Method
        • By Testing Material
    • Mexico
      • Pricing Analysis
      • Market Share Analysis, 2024
        • By Test Method
        • By Testing Material
    • Brazil
      • Pricing Analysis
      • Market Share Analysis, 2024
        • By Test Method
        • By Testing Material
    • Chile
      • Pricing Analysis
      • Market Share Analysis, 2024
        • By Test Method
        • By Testing Material
    • Germany
      • Pricing Analysis
      • Market Share Analysis, 2024
        • By Test Method
        • By Testing Material
    • UK
      • Pricing Analysis
      • Market Share Analysis, 2024
        • By Test Method
        • By Testing Material
    • Italy
      • Pricing Analysis
      • Market Share Analysis, 2024
        • By Test Method
        • By Testing Material
    • Spain
      • Pricing Analysis
      • Market Share Analysis, 2024
        • By Test Method
        • By Testing Material
    • France
      • Pricing Analysis
      • Market Share Analysis, 2024
        • By Test Method
        • By Testing Material
    • India
      • Pricing Analysis
      • Market Share Analysis, 2024
        • By Test Method
        • By Testing Material
    • ASEAN
      • Pricing Analysis
      • Market Share Analysis, 2024
        • By Test Method
        • By Testing Material
    • Australia & New Zealand
      • Pricing Analysis
      • Market Share Analysis, 2024
        • By Test Method
        • By Testing Material
    • China
      • Pricing Analysis
      • Market Share Analysis, 2024
        • By Test Method
        • By Testing Material
    • Japan
      • Pricing Analysis
      • Market Share Analysis, 2024
        • By Test Method
        • By Testing Material
    • South Korea
      • Pricing Analysis
      • Market Share Analysis, 2024
        • By Test Method
        • By Testing Material
    • Russia
      • Pricing Analysis
      • Market Share Analysis, 2024
        • By Test Method
        • By Testing Material
    • Poland
      • Pricing Analysis
      • Market Share Analysis, 2024
        • By Test Method
        • By Testing Material
    • Hungary
      • Pricing Analysis
      • Market Share Analysis, 2024
        • By Test Method
        • By Testing Material
    • Kingdom of Saudi Arabia
      • Pricing Analysis
      • Market Share Analysis, 2024
        • By Test Method
        • By Testing Material
    • Turkiye
      • Pricing Analysis
      • Market Share Analysis, 2024
        • By Test Method
        • By Testing Material
    • South Africa
      • Pricing Analysis
      • Market Share Analysis, 2024
        • By Test Method
        • By Testing Material
  17. Market Structure Analysis
    • Competition Dashboard
    • Competition Benchmarking
    • Market Share Analysis of Top Players
      • By Regional
      • By Test Method
      • By Testing Material
  18. Competition Analysis
    • Competition Deep Dive
      • Mitutoyo Corporation
        • Overview
        • Product Portfolio
        • Profitability by Market Segments (Product/Age /Sales Channel/Region)
        • Sales Footprint
        • Strategy Overview
          • Marketing Strategy
          • Product Strategy
          • Channel Strategy
      • ZwickRoell Group
      • FINE Group
      • Akash Industries
      • Struers
      • Innovatest Europe BV
      • Shimadzu Corporation
      • FIE Group
  19. Assumptions & Acronyms Used
  20. Research Methodology

List of Tables

  • Table 1: Global Market Value (USD Million) Forecast by Region, 2020-2035
  • Table 2: Global Market Value (USD Million) Forecast by Test Method , 2020-2035
  • Table 3: Global Market Value (USD Million) Forecast by Testing Material, 2020-2035
  • Table 4: North America Market Value (USD Million) Forecast by Country, 2020-2035
  • Table 5: North America Market Value (USD Million) Forecast by Test Method , 2020-2035
  • Table 6: North America Market Value (USD Million) Forecast by Testing Material, 2020-2035
  • Table 7: Latin America Market Value (USD Million) Forecast by Country, 2020-2035
  • Table 8: Latin America Market Value (USD Million) Forecast by Test Method , 2020-2035
  • Table 9: Latin America Market Value (USD Million) Forecast by Testing Material, 2020-2035
  • Table 10: Western Europe Market Value (USD Million) Forecast by Country, 2020-2035
  • Table 11: Western Europe Market Value (USD Million) Forecast by Test Method , 2020-2035
  • Table 12: Western Europe Market Value (USD Million) Forecast by Testing Material, 2020-2035
  • Table 13: Eastern Europe Market Value (USD Million) Forecast by Country, 2020-2035
  • Table 14: Eastern Europe Market Value (USD Million) Forecast by Test Method , 2020-2035
  • Table 15: Eastern Europe Market Value (USD Million) Forecast by Testing Material, 2020-2035
  • Table 16: East Asia Market Value (USD Million) Forecast by Country, 2020-2035
  • Table 17: East Asia Market Value (USD Million) Forecast by Test Method , 2020-2035
  • Table 18: East Asia Market Value (USD Million) Forecast by Testing Material, 2020-2035
  • Table 19: South Asia and Pacific Market Value (USD Million) Forecast by Country, 2020-2035
  • Table 20: South Asia and Pacific Market Value (USD Million) Forecast by Test Method , 2020-2035
  • Table 21: South Asia and Pacific Market Value (USD Million) Forecast by Testing Material, 2020-2035
  • Table 22: Middle East & Africa Market Value (USD Million) Forecast by Country, 2020-2035
  • Table 23: Middle East & Africa Market Value (USD Million) Forecast by Test Method , 2020-2035
  • Table 24: Middle East & Africa Market Value (USD Million) Forecast by Testing Material, 2020-2035

List of Figures

  • Figure 1: Global Market Pricing Analysis
  • Figure 2: Global Market Value (USD Million) Forecast 2020-2035
  • Figure 3: Global Market Value Share and BPS Analysis by Test Method , 2025 and 2035
  • Figure 4: Global Market Y-o-Y Growth Comparison by Test Method , 2025-2035
  • Figure 5: Global Market Attractiveness Analysis by Test Method
  • Figure 6: Global Market Value Share and BPS Analysis by Testing Material, 2025 and 2035
  • Figure 7: Global Market Y-o-Y Growth Comparison by Testing Material, 2025-2035
  • Figure 8: Global Market Attractiveness Analysis by Testing Material
  • Figure 9: Global Market Value (USD Million) Share and BPS Analysis by Region, 2025 and 2035
  • Figure 10: Global Market Y-o-Y Growth Comparison by Region, 2025-2035
  • Figure 11: Global Market Attractiveness Analysis by Region
  • Figure 12: North America Market Incremental Dollar Opportunity, 2025-2035
  • Figure 13: Latin America Market Incremental Dollar Opportunity, 2025-2035
  • Figure 14: Western Europe Market Incremental Dollar Opportunity, 2025-2035
  • Figure 15: Eastern Europe Market Incremental Dollar Opportunity, 2025-2035
  • Figure 16: East Asia Market Incremental Dollar Opportunity, 2025-2035
  • Figure 17: South Asia and Pacific Market Incremental Dollar Opportunity, 2025-2035
  • Figure 18: Middle East & Africa Market Incremental Dollar Opportunity, 2025-2035
  • Figure 19: North America Market Value Share and BPS Analysis by Country, 2025 and 2035
  • Figure 20: North America Market Value Share and BPS Analysis by Test Method , 2025 and 2035
  • Figure 21: North America Market Y-o-Y Growth Comparison by Test Method , 2025-2035
  • Figure 22: North America Market Attractiveness Analysis by Test Method
  • Figure 23: North America Market Value Share and BPS Analysis by Testing Material, 2025 and 2035
  • Figure 24: North America Market Y-o-Y Growth Comparison by Testing Material, 2025-2035
  • Figure 25: North America Market Attractiveness Analysis by Testing Material
  • Figure 26: Latin America Market Value Share and BPS Analysis by Country, 2025 and 2035
  • Figure 27: Latin America Market Value Share and BPS Analysis by Test Method , 2025 and 2035
  • Figure 28: Latin America Market Y-o-Y Growth Comparison by Test Method , 2025-2035
  • Figure 29: Latin America Market Attractiveness Analysis by Test Method
  • Figure 30: Latin America Market Value Share and BPS Analysis by Testing Material, 2025 and 2035
  • Figure 31: Latin America Market Y-o-Y Growth Comparison by Testing Material, 2025-2035
  • Figure 32: Latin America Market Attractiveness Analysis by Testing Material
  • Figure 33: Western Europe Market Value Share and BPS Analysis by Country, 2025 and 2035
  • Figure 34: Western Europe Market Value Share and BPS Analysis by Test Method , 2025 and 2035
  • Figure 35: Western Europe Market Y-o-Y Growth Comparison by Test Method , 2025-2035
  • Figure 36: Western Europe Market Attractiveness Analysis by Test Method
  • Figure 37: Western Europe Market Value Share and BPS Analysis by Testing Material, 2025 and 2035
  • Figure 38: Western Europe Market Y-o-Y Growth Comparison by Testing Material, 2025-2035
  • Figure 39: Western Europe Market Attractiveness Analysis by Testing Material
  • Figure 40: Eastern Europe Market Value Share and BPS Analysis by Country, 2025 and 2035
  • Figure 41: Eastern Europe Market Value Share and BPS Analysis by Test Method , 2025 and 2035
  • Figure 42: Eastern Europe Market Y-o-Y Growth Comparison by Test Method , 2025-2035
  • Figure 43: Eastern Europe Market Attractiveness Analysis by Test Method
  • Figure 44: Eastern Europe Market Value Share and BPS Analysis by Testing Material, 2025 and 2035
  • Figure 45: Eastern Europe Market Y-o-Y Growth Comparison by Testing Material, 2025-2035
  • Figure 46: Eastern Europe Market Attractiveness Analysis by Testing Material
  • Figure 47: East Asia Market Value Share and BPS Analysis by Country, 2025 and 2035
  • Figure 48: East Asia Market Value Share and BPS Analysis by Test Method , 2025 and 2035
  • Figure 49: East Asia Market Y-o-Y Growth Comparison by Test Method , 2025-2035
  • Figure 50: East Asia Market Attractiveness Analysis by Test Method
  • Figure 51: East Asia Market Value Share and BPS Analysis by Testing Material, 2025 and 2035
  • Figure 52: East Asia Market Y-o-Y Growth Comparison by Testing Material, 2025-2035
  • Figure 53: East Asia Market Attractiveness Analysis by Testing Material
  • Figure 54: South Asia and Pacific Market Value Share and BPS Analysis by Country, 2025 and 2035
  • Figure 55: South Asia and Pacific Market Value Share and BPS Analysis by Test Method , 2025 and 2035
  • Figure 56: South Asia and Pacific Market Y-o-Y Growth Comparison by Test Method , 2025-2035
  • Figure 57: South Asia and Pacific Market Attractiveness Analysis by Test Method
  • Figure 58: South Asia and Pacific Market Value Share and BPS Analysis by Testing Material, 2025 and 2035
  • Figure 59: South Asia and Pacific Market Y-o-Y Growth Comparison by Testing Material, 2025-2035
  • Figure 60: South Asia and Pacific Market Attractiveness Analysis by Testing Material
  • Figure 61: Middle East & Africa Market Value Share and BPS Analysis by Country, 2025 and 2035
  • Figure 62: Middle East & Africa Market Value Share and BPS Analysis by Test Method , 2025 and 2035
  • Figure 63: Middle East & Africa Market Y-o-Y Growth Comparison by Test Method , 2025-2035
  • Figure 64: Middle East & Africa Market Attractiveness Analysis by Test Method
  • Figure 65: Middle East & Africa Market Value Share and BPS Analysis by Testing Material, 2025 and 2035
  • Figure 66: Middle East & Africa Market Y-o-Y Growth Comparison by Testing Material, 2025-2035
  • Figure 67: Middle East & Africa Market Attractiveness Analysis by Testing Material
  • Figure 68: Global Market - Tier Structure Analysis
  • Figure 69: Global Market - Company Share Analysis

Frequently Asked Questions

How big is the hardness testing machine market in 2025?

The global hardness testing machine market is estimated to be valued at USD 351.0 million in 2025.

What will be the size of hardness testing machine market in 2035?

The market size for the hardness testing machine market is projected to reach USD 651.5 million by 2035.

How much will be the hardness testing machine market growth between 2025 and 2035?

The hardness testing machine market is expected to grow at a 6.4% CAGR between 2025 and 2035.

What are the key product types in the hardness testing machine market?

The key product types in hardness testing machine market are rockwell hardness test method, brinell hardness test method, vickers hardness test method and other hardness test method.

Which testing material segment to contribute significant share in the hardness testing machine market in 2025?

In terms of testing material, metal hardness testing machine (steel, aluminum, iron etc.) segment to command 50.0% share in the hardness testing machine market in 2025.

Explore Similar Insights

Future Market Insights

Hardness Testing Machine Market

Chat With MaRIA

Chat With

MaRIA

Hi There, I am MaRIA, Your Market Research Intelligence Assistant. How may I help you?