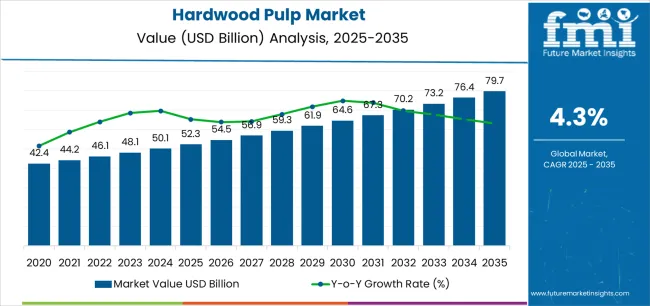
The hardwood pulp market stands at the threshold of a decade-long expansion trajectory that promises to reshape paper manufacturing technology and fiber production solutions. The market's journey from USD 52.3 billion in 2025 to USD 79.8 billion by 2035 represents substantial growth, demonstrating the accelerating adoption of advanced pulping technology and premium fiber optimization across paper mills, packaging manufacturers, and tissue production sectors.
The first half of the decade (2025-2030) will witness the market climbing from USD 52.3 billion to approximately USD 65.7 billion, adding USD 13.4 billion in value, which constitutes 49% of the total forecast growth period. This phase will be characterized by the rapid adoption of premium hardwood pulp products, driven by increasing tissue consumption and the growing need for advanced fiber solutions worldwide. Enhanced brightness capabilities and strength control systems will become standard expectations rather than premium options.
The latter half (2030-2035) will witness continued growth from USD 65.7 billion to USD 79.8 billion, representing an addition of USD 14.1 billion or 51% of the decade's expansion. This period will be defined by mass market penetration of specialized pulping technologies, integration with comprehensive paper production platforms, and seamless compatibility with existing mill infrastructure. The market trajectory signals fundamental shifts in how paper manufacturers approach fiber quality and production management, with participants positioned to benefit from growing demand across multiple pulp grades and application segments.
| Period | Primary Revenue Buckets | Share | Notes |
|---|---|---|---|
| Today | Bleached hardwood kraft pulp (standard) | 51% | Tissue production, printing papers |
| Unbleached hardwood kraft pulp | 23% | Packaging grades, corrugated medium | |
| Dissolving hardwood pulp | 16% | Textile fibers, specialty chemicals | |
| Mechanical hardwood pulp | 10% | Newsprint, magazine papers | |
| Future (3-5 yrs) | Premium bleached kraft pulp | 42-47% | High-quality tissue, premium papers |
| Dissolving grade pulp | 22-28% | Textile industry growth, bio-materials | |
| Recycled fiber-compatible pulp | 12-18% | Circular economy, environmental regulations | |
| Specialty hardwood pulp | 8-14% | Food packaging, barrier applications | |
| Nanocellulose-ready pulp | 6-10% | Advanced materials, composites |
| Metric | Value |
|---|---|
| Market Value (2025) | USD 52.3 billion |
| Market Forecast (2035) | USD 79.8 billion |
| Growth Rate | 4.3% CAGR |
| Leading Technology | Bleached Hardwood Kraft Pulp |
| Primary Application | Tissue and Hygiene Products Segment |
The market demonstrates strong fundamentals with bleached hardwood kraft pulp systems capturing a dominant share through advanced fiber characteristics and paper quality optimization. Tissue and hygiene product applications drive primary demand, supported by increasing consumer spending and premium paper product adoption requirements. Geographic expansion remains concentrated in developed markets with established pulping infrastructure, while emerging economies show accelerating adoption rates driven by paper mill construction and rising quality standards.
Design for fiber excellence, not just commodity supply
Primary Classification: The market segments by pulp type into bleached hardwood kraft pulp, unbleached hardwood kraft pulp, dissolving hardwood pulp, and mechanical hardwood pulp, representing the evolution from basic fiber materials to sophisticated paper production solutions for comprehensive quality optimization.
Secondary Classification: Brightness segmentation divides the market into standard brightness (80-85% ISO), high brightness (85-90% ISO), ultra-high brightness (above 90% ISO), and specialty brightness grades, reflecting distinct requirements for paper quality, print performance, and application standards.
Tertiary Classification: Application segmentation covers tissue and hygiene products, printing and writing papers, packaging materials, dissolving applications, and specialty papers, while wood species spans eucalyptus, birch, aspen, and mixed hardwood categories.
Regional Classification: Geographic distribution covers North America, Latin America, Western Europe, Eastern Europe, East Asia, South Asia Pacific, and Middle East & Africa, with developed markets leading production while emerging economies show accelerating consumption patterns driven by paper industry expansion programs.
The segmentation structure reveals technology progression from standard pulping materials toward sophisticated fiber systems with enhanced brightness and strength capabilities, while application diversity spans from tissue operations to specialty paper establishments requiring precise fiber solutions.
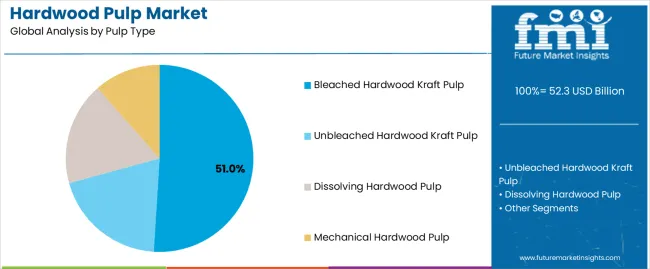
Market Position: Bleached Hardwood Kraft Pulp systems command the leading position in the hardwood pulp market with 51% market share through advanced fiber characteristics, including superior brightness, cleanliness, and paper quality optimization that enable paper manufacturers to achieve optimal product performance across diverse printing and tissue applications.
Value Drivers: The segment benefits from mill preference for reliable fiber systems that provide consistent brightness performance, enhanced paper quality, and strength optimization without compromising pulp yield or affecting production characteristics. Advanced kraft processing enables brightness excellence, printability enhancement, and integration with existing papermaking equipment, where fiber performance and quality consistency represent critical operational requirements.
Competitive Advantages: Bleached Hardwood Kraft Pulp systems differentiate through proven brightness reliability, consistent strength characteristics, and integration with modern paper machines that enhance production efficiency while maintaining optimal paper quality standards suitable for diverse tissue and printing applications.
Key market characteristics:
Unbleached Hardwood Kraft Pulp systems maintain a 23% market position in the hardwood pulp market due to their strength characteristics and cost advantages. These systems appeal to packaging manufacturers requiring high-strength fiber with competitive pricing for diverse packaging applications. Market growth is driven by operator preference, emphasizing strength performance and versatile applications through optimized pulping design.
Dissolving Hardwood Pulp systems capture 16% market share through specialty chemical requirements in textile manufacturing, viscose production, and bio-material applications. These establishments demand high-purity fiber systems capable of chemical processing while providing exceptional conversion efficiency and product quality.
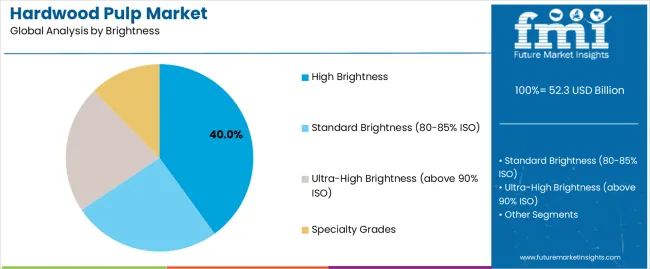
Market Context: High-brightness pulp (85–90% ISO) demonstrates the highest growth rate in the hardwood pulp market, holding a 40% share due to the widespread adoption of premium paper grades and an increasing focus on print quality, visual appeal, and consumer preference optimization, which maximizes paper performance while maintaining cost efficiency.
Appeal Factors: High brightness operators prioritize print quality, visual excellence, and integration with diverse paper applications that enables optimized production operations across multiple grade categories. The segment benefits from substantial tissue market investment and premium paper programs that emphasize the acquisition of high brightness pulp for quality optimization and consumer appeal applications.
Growth Drivers: Premium paper expansion programs incorporate high brightness pulp as standard material for quality grades, while tissue market growth increases demand for brightness capabilities that comply with consumer standards and minimize quality compromises.
Market Challenges: Higher production costs and bleaching complexity may limit adoption across cost-sensitive packaging or commodity paper scenarios.
Application dynamics include:
Standard brightness pulp applications capture market share through cost-effective requirements in commodity papers, newsprint, and basic packaging grades. These applications demand reliable fiber systems capable of operating with standard equipment while providing effective strength performance and operational simplicity capabilities.
Ultra-high brightness pulp applications account for market share, including premium tissue grades, high-quality printing papers, and specialty applications requiring exceptional brightness capabilities for quality optimization and consumer appeal.
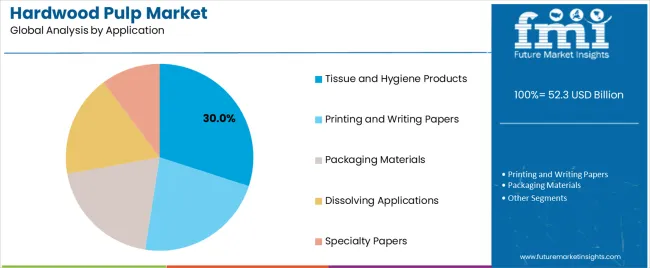
Market Position: Tissue and hygiene products hold a significant market share of 30%, driven by increasing consumer spending and the adoption of premium products for both household and commercial tissue consumption.
Value Drivers: This application segment provides the ideal combination of softness and absorbency, meeting requirements for comfort, performance, and quality without compromising on consumer expectations.
Growth Characteristics: The segment benefits from broad applicability across tissue manufacturers, automated production adoption, and established distribution networks that support widespread pulp usage and operational convenience.
Market Context: Paper Manufacturing dominates the market with 5.6% CAGR, reflecting the primary demand source for hardwood pulp in paper production and converting operations.
Business Model Advantages: Paper mills provide direct market demand for consistent fiber materials, driving quality standards and production innovation while maintaining cost efficiency and operational requirements.
Operational Benefits: Manufacturing applications include quality assurance, production optimization, and cost management enhancement that drive consistent demand for hardwood pulp while providing access to latest fiber technologies.
| Category | Factor | Impact | Why It Matters |
|---|---|---|---|
| Driver | Global tissue consumption growth & hygiene awareness (premium tissue products, commercial facilities) | ★★★★★ | Rising living standards drive premium tissue demand; health consciousness increases hygiene product usage; market expansion follows consumer spending patterns. |
| Driver | Packaging industry expansion & e-commerce growth | ★★★★★ | Explosive growth in online shopping creates demand for packaging materials; corrugated box production drives kraft pulp consumption across multiple applications. |
| Driver | Textile industry demand & dissolving pulp applications (viscose fiber production) | ★★★★☆ | Fashion industry growth increases viscose demand; eco-friendly textile alternatives drive dissolving grade pulp consumption in specialty applications. |
| Restraint | Competition from recycled fibers & alternative materials | ★★★☆☆ | Growing adoption of recycled content in paper production; alternative fiber sources create substitution pressure for virgin pulp consumption. |
| Restraint | Raw material cost volatility & wood chip price fluctuations | ★★★★☆ | Wood cost variations impact production margins; commodity nature of basic grades constrains pricing power during feedstock increases. |
| Trend | High-brightness pulp & premium fiber grades (advanced bleaching, quality enhancement) | ★★★★★ | Premium paper market demanding superior brightness; consumer preference for high-quality products drives specialty grade adoption. |
| Trend | Forest certification & responsible sourcing programs (FSC, PEFC standards) | ★★★★☆ | Corporate procurement policies requiring certified materials; consumer awareness driving responsible fiber sourcing initiatives. |
The hardwood pulp market demonstrates varied regional dynamics with Growth Leaders including Brazil (6.8% growth rate) and Indonesia (7.1% growth rate) driving expansion through plantation development and mill capacity initiatives. Steady Performers encompass United States (4.7% growth rate), Finland (4.9% growth rate), and developed regions, benefiting from established pulping infrastructure and technology adoption. Emerging Markets feature China (6.2% growth rate) and developing regions, where paper mill construction and fiber demand support consistent growth patterns.
Regional synthesis reveals South American markets leading production expansion through plantation forestry and integrated mill development, while Asian markets demonstrate highest consumption growth supported by paper industry development and rising tissue demand. European markets show moderate growth driven by environmental regulations and quality enhancement integration.
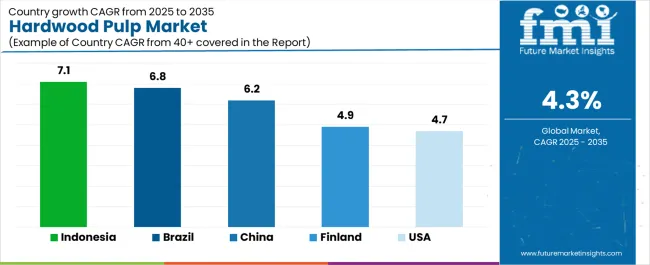
| Region/Country | 2025-2035 Growth | How to win | What to watch out |
|---|---|---|---|
| Brazil | 6.8% | Plantation scale; integrated operations | Environmental regulations; land availability |
| Indonesia | 7.1% | Mill expansion; fiber optimization | Environmental concerns; certification requirements |
| United States | 4.7% | Technology leadership; specialty grades | Market maturity; recycling competition |
| Finland | 4.9% | Innovation focus; premium positioning | Energy costs; market consolidation |
| China | 6.2% | Consumption growth; mill development | Import dependency; quality standards |
China establishes fastest consumption growth through massive paper manufacturing expansion and comprehensive tissue market development, integrating advanced hardwood pulp as standard components in paper production and converting operations. The country's 6.2% growth rate reflects explosive tissue consumption adoption and domestic paper industry expansion that mandates the use of quality fiber systems in commercial and consumer facilities. Growth concentrates in major industrial centers, including Shandong, Jiangsu, and Guangdong, where paper mills showcase integrated pulping systems that appeal to manufacturers seeking advanced fiber capabilities and production optimization applications.
Chinese manufacturers are developing domestically-integrated mill solutions that combine plantation development with functional operational features, including enhanced brightness and strength characteristics. Supply chains through international trading and domestic processing expand market access, while paper consumption culture supports adoption across diverse commercial and consumer segments.
Strategic Market Indicators:
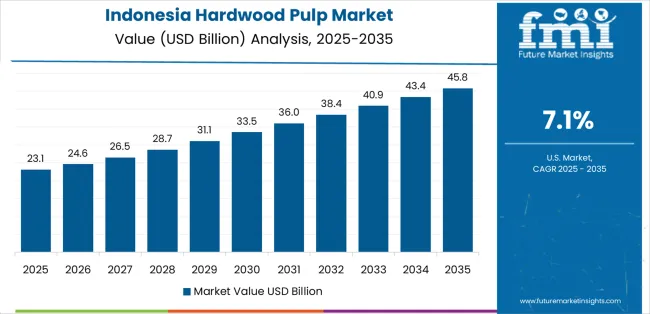
In Jakarta, Surabaya, and Medan, paper manufacturers and pulp producers are implementing hardwood pulp as standard material for paper production and export applications, driven by increasing mill investment and plantation programs that emphasize the importance of fiber quality. The market holds a 7.1% growth rate, supported by pulp mill expansion and forestry development programs that promote quality pulping systems for commercial and export applications. Indonesian operators are adopting fiber solutions that provide consistent quality performance and production features, particularly appealing in plantation regions where integrated operations and processing efficiency represent critical operational expectations.
Market expansion benefits from growing export demand patterns and mill development that enable widespread adoption of quality pulping systems for paper and tissue applications. Technology adoption follows patterns established in integrated forestry, where efficiency and scale drive production decisions and operational deployment.
Market Intelligence Brief:
United States establishes market leadership through comprehensive tissue programs and advanced paper manufacturing development, integrating hardwood pulp across mill and converting applications. The country's 4.7% growth rate reflects established paper consumption patterns and mature pulping technology adoption that supports widespread use of premium fiber systems in tissue and paper facilities. Growth concentrates in major pulping regions, including the Southeast, Pacific Northwest, and Great Lakes, where mill operations showcase mature pulp deployment that appeals to manufacturers seeking proven fiber capabilities and quality applications.
American paper manufacturers leverage established supply networks and comprehensive product availability, including high-brightness grades and specialty options that create quality differentiation and operational advantages. The market benefits from mature mill infrastructure and willingness to invest in quality fiber materials that enhance paper performance and production optimization.
Market Intelligence Brief:
Advanced pulping technology market in Finland demonstrates sophisticated hardwood pulp deployment with documented efficiency effectiveness in mill applications and export facilities through integration with existing forestry systems and production infrastructure. The country leverages forest management expertise and processing standards to maintain a 4.9% growth rate. Production centers, including Helsinki, Tampere, and Oulu, showcase premium installations where hardwood pulp integrates with comprehensive mill platforms and quality systems to optimize fiber operations and processing effectiveness.
Finnish operators prioritize processing innovation and environmental credentials in pulp production, creating demand for certified products with advanced features, including high-brightness capabilities and strength optimization. The market benefits from established forestry consciousness and a willingness to invest in premium fiber materials that provide superior quality benefits and adherence to environmental standards.
Market Intelligence Brief:
Paper manufacturers and pulp producers market expansion in Brazil benefits from diverse plantation demand, including eucalyptus development in Minas Gerais and São Paulo, mill establishment growth, and rising export consumption that increasingly incorporate pulp solutions for fiber production applications. The country maintains a 6.8% growth rate, driven by plantation development and increasing recognition of pulp benefits, including improved fiber quality and enhanced export potential.
Market dynamics focus on integrated production solutions that balance plantation management with processing considerations important to Brazilian pulp operators. Growing mill construction creates continued demand for modern fiber systems in new facility infrastructure and production modernization projects.
Strategic Market Considerations:
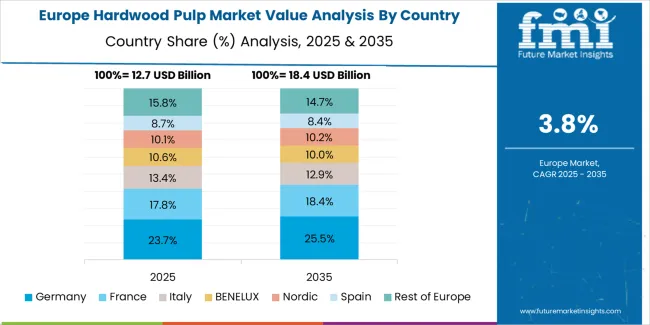
The European hardwood pulp market is projected to grow from USD 8.7 billion in 2025 to USD 12.4 billion by 2035, registering a CAGR of 3.6% over the forecast period. Finland is expected to maintain its leadership position with a 31.2% market share in 2025, supported by its advanced pulping technology and integrated forest operations.
Sweden follows with a 24.8% share in 2025, driven by efficient mill operations and export capabilities. Germany holds a 19.7% share through tissue manufacturing and paper production. France commands a 12.3% share, while Austria accounts for 8.6% in 2025. The rest of Europe region is anticipated to gain momentum, expanding its collective share from 3.4% to 4.2% by 2035, attributed to increasing paper production in Eastern European countries and emerging mill establishments implementing modern pulping programs.
| Stakeholder | What they actually control | Typical strengths | Typical blind spots |
|---|---|---|---|
| Integrated producers | Forest resources, mill capacity, supply chain | Scale efficiency, cost control, vertical integration | Market flexibility; specialty applications |
| Specialty pulp producers | Premium grades; dissolving pulp; custom solutions | Quality leadership; technical expertise; differentiation | Mass market penetration; cost competition |
| Regional mills | Local production, distribution networks, competitive pricing | Market proximity; operational efficiency; cost advantage | Technology gaps; international expansion |
| Trading companies | Market access, logistics, inventory management | Global reach; market intelligence; supply optimization | Production control; quality consistency |
| Technology providers | Process innovation, equipment systems, technical support | Technical expertise; efficiency solutions; performance | Market scalability; commodity competition |
| Item | Value |
|---|---|
| Quantitative Units (2025) | USD 52.3 billion |
| Pulp Type | Bleached Hardwood Kraft Pulp, Unbleached Hardwood Kraft Pulp, Dissolving Hardwood Pulp, Mechanical Hardwood Pulp |
| Brightness | Standard Brightness (80-85% ISO), High Brightness (85-90% ISO), Ultra-High Brightness (above 90% ISO), Specialty Grades |
| Wood Species | Eucalyptus, Birch, Aspen, Mixed Hardwood |
| Application | Tissue and Hygiene Products, Printing and Writing Papers, Packaging Materials, Dissolving Applications, Specialty Papers |
| Regions Covered | North America, Latin America, Western Europe, Eastern Europe, East Asia, South Asia Pacific, Middle East & Africa |
| Countries Covered | Brazil, United States, Finland, China, Indonesia, Sweden, Canada, Chile, Uruguay, Portugal, and 25+ additional countries |
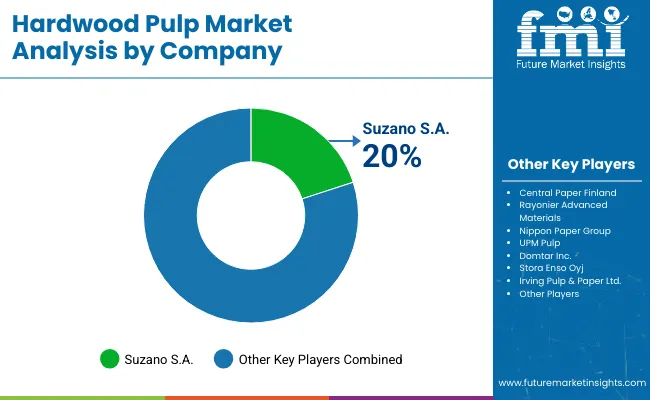
| Key Companies Profiled | Suzano S.A., International Paper Company, UPM-Kymmene Corporation, Stora Enso Oyj, Klabin S.A., Sappi Limited, Domtar Corporation |
| Additional Attributes | Dollar sales by pulp type and brightness categories, regional production trends across South America, North America, and Northern Europe, competitive landscape with integrated producers and specialty mills, consumer preferences for paper quality and fiber performance, integration with paper machines and converting systems, innovations in bleaching technology and fiber enhancement, and development of dissolving grade solutions with enhanced purity and chemical processing capabilities. |
The global hardwood pulp market is estimated to be valued at USD 52.3 billion in 2025.
The market size for the hardwood pulp market is projected to reach USD 79.7 billion by 2035.
The hardwood pulp market is expected to grow at a 4.3% CAGR between 2025 and 2035.
The key product types in hardwood pulp market are bleached hardwood kraft pulp, unbleached hardwood kraft pulp, dissolving hardwood pulp and mechanical hardwood pulp.
In terms of brightness, high brightness segment to command 40.0% share in the hardwood pulp market in 2025.


Full Research Suite comprises of:
Market outlook & trends analysis
Interviews & case studies
Strategic recommendations
Vendor profiles & capabilities analysis
5-year forecasts
8 regions and 60+ country-level data splits
Market segment data splits
12 months of continuous data updates
DELIVERED AS:
PDF EXCEL ONLINE
Industry Share Analysis for Hardwood Pulp Companies
Unbleached Hardwood Kraft Pulp Market Size and Share Forecast Outlook 2025 to 2035
Pulp Roll Cradle Market Forecast and Outlook 2025 to 2035
Pulp Molding Tooling Market Size and Share Forecast Outlook 2025 to 2035
Pulp Liner Market Analysis - Size and Share Forecast Outlook 2025 to 2035
Pulpwood Market Size and Share Forecast Outlook 2025 to 2035
Pulp Molding Machines Market Size and Share Forecast Outlook 2025 to 2035
Pulp Drying Equipment Market Trend Analysis Based on Type, End-Use, Region 2025 to 2035
Pulp Moulding Tooling Market
Pulp Washing Equipment Market
Pulp Cells Market
Repulpable Tape Market Size and Share Forecast Outlook 2025 to 2035
Beet Pulp Market Size and Share Forecast Outlook 2025 to 2035
Hydrapulper Market Size and Share Forecast Outlook 2025 to 2035
Wood Pulp Market Analysis – Demand & Growth Forecast 2024-2034
Drum Pulper Market
Citrus Pulp Fiber Market Size and Share Forecast Outlook 2025 to 2035
Molded Pulp Packaging Market Size and Share Forecast Outlook 2025 to 2035
Molded Pulp Basket Market Size and Share Forecast Outlook 2025 to 2035
Molded Pulp Packaging Machines Market Analysis - Growth & Forecast 2025 to 2035

Thank you!
You will receive an email from our Business Development Manager. Please be sure to check your SPAM/JUNK folder too.
Chat With
MaRIA