Hematology Diagnostics Market Size and Share Forecast Outlook 2025 to 2035

The global hematology diagnostics market is estimated to be valued at USD 3,971.8 million in 2025 and is projected to reach USD 6,287.2 million by 2035, registering a compound annual growth rate of 6.5% over the forecast period.

Quick Stats for Varicose Vein Treatment Market

  • Industry Value (2025): USD 3,971.8 million
  • Forecast Value (2035): USD 6,287.2 million
  • Forecast CAGR: 6.5%
  • Leading Segment in 2025 (Kit Type): Leukemia Testing Kits (38.5% share)
  • Key Growth Regions: Asia-Pacific (China, India, Japan), North America
  • Top Key Players: Sysmex Corporation, Beckman Coulter Inc. (Danaher), Abbott Laboratories, Siemens Healthineers AG, HORIBA Medical, Nihon Kohden Corporation
Metric Value
Industry Size (2025E) USD 3,971.8 million
Industry Value (2035F) USD 6,287.2 million
CAGR (2025 to 2035) 6.5%

The hematology diagnostics market has witnessed sustained momentum as healthcare systems prioritize early detection and management of hematological disorders, including anemia, leukemia, and clotting abnormalities.

Rising global disease prevalence, expanding access to laboratory services, and the shift toward automated, high-throughput analyzers have collectively accelerated adoption. Clinical laboratories and hospitals have increasingly invested in integrated platforms that combine CBC testing, differential counts, and advanced cellular morphology capabilities to improve diagnostic accuracy and turnaround time. Regulatory guidance and quality assurance initiatives have further stimulated demand for validated reagents and consumables that comply with stringent performance standards.

Analyzing Hematology Diagnostics Market by Top Investment Segments

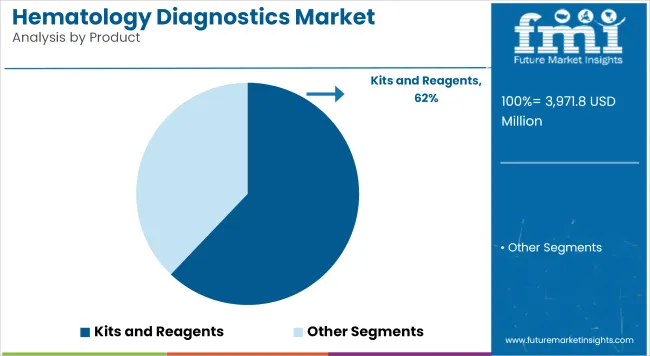
Kits and Reagents Lead Adoption Due to Recurring Demand and Compliance With Stringent Quality Standards

Product Analysis: Kits and Reagents

Hematology Diagnostics Market Analysis By Product

In 2025, Kits and Reagents is estimated to account for 62.1% revenue share, underscoring their indispensable role in haematology workflows. Growth of this segment has been driven by the necessity of reliable consumables that deliver reproducible results across high-throughput analyzers.

Hospitals and laboratories have prioritized validated reagent systems compatible with automated platforms to meet accreditation standards and ensure consistent quality. Increasing test volumes for anemia screening, coagulation assessment, and oncology diagnostics have further contributed to robust recurring demand.

The segment is expected to maintain a dominant position as laboratories expand preventive screening programs and adopt advanced diagnostic algorithms requiring specialized reagent formulations.

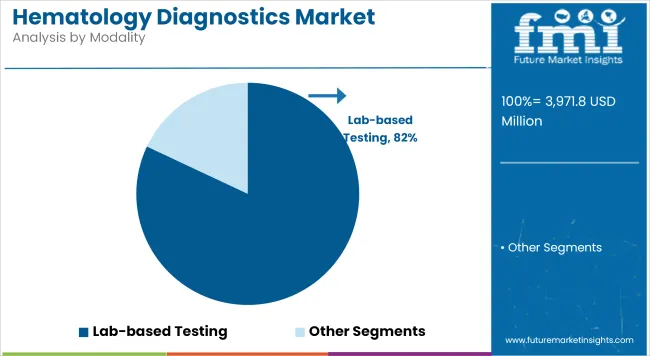
Lab-Based Testing Dominates Due to High Test Volume, Cost-Effectiveness, and Centralized Analytical Capabilities

Modality Analysis

Hematology Diagnostics Market Analysis By Modality

Lab-Based Testing contributes a revenue share of 82.0% in the overall hematology diagnostics market. This segment is being driven by centralized laboratories’ ability to process large specimen volumes efficiently and deliver standardized, high-quality results. Providers have favored lab-based platforms to leverage economies of scale, integrate advanced analytics, and comply with rigorous regulatory requirements.

The prevalence of chronic hematological disorders and the increasing adoption of routine CBC and differential testing have reinforced demand for centralized lab services. Lab-based testing is anticipated to remain dominant, although incremental growth in decentralized and near-patient testing solutions is likely to emerge.
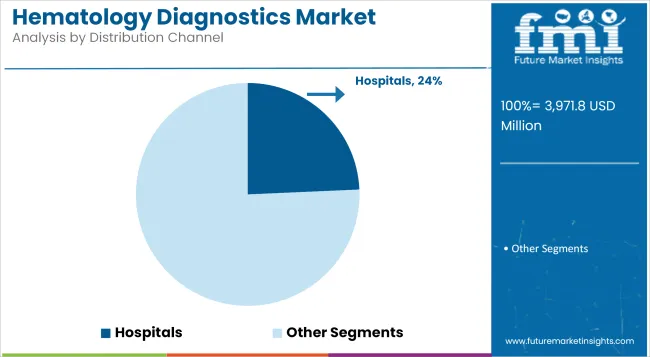
Hospitals Remain Leading End Users Owing to Comprehensive Care Pathways and Integrated Laboratory Infrastructure

Hematology Diagnostics Market Analysis By Distribution Channel

Hospitals contribute a revenue share of 24.3%, highlighting their key role in providing hematology testing as part of comprehensive inpatient and outpatient care. Utilization has been driven by the need for rapid diagnostics in critical care, oncology, and surgical departments.

Hospitals have maintained robust demand for automated analyzers and consumables to ensure continuous operation and timely result reporting. The expansion of oncology treatment programs and the integration of multidisciplinary care models have further supported segment growth.

Challenges and Opportunities

Challenge

Equipment Cost and Skilled Labor Shortage

The hematology diagnostics arena is confronted with serious challenges, such as the prohibitively high costs of analyzers, consumables and the need for specialist personnel to interpret results. Though automated hematology systems improve throughput, the more sophisticated equipment that can differentiate blood disorders of high complexity cannot be afforded by smaller labs and rural clinics.

Also, the interpretation of abnormal cell morphology or rare conditions needs to be reviewed manually by a trained hematologist, subjecting the system to further bottlenecks in resource-limited settings. Compliance with regulatory requirements, high costs of maintenance, and high degree of variations in laboratory infrastructure are all factors that make standardization an even more daunting task particularly as emerging markets seek to fast-track their horizons in diagnostic capabilities.

Opportunity

Rising Burden of Blood Disorders and Diagnostic Automation

Hematology diagnostics market is forecasted to grow in spite of infrastructural limitations due to rising incidence of anemia, leukemia, and chronic diseases affecting blood parameters all over the world. Advancements in automated analyzers, point-of-care (POC) devices, integrated diagnostic platforms include improved technology to enhance test speed, accuracy, and accessibility.

Enhanced diagnostic efficiency in centralized labs or remote clinics with the advent of AI-assisted blood cell differentiation, Cloud-based data analytics, and telehematology. Accurate, high-throughput hematology diagnostics are increasingly demanded in hospitals, oncology centers, and preventive health programs worldwide as personalized medicine and routine screening take off.

Country-Wise Outlook

United States

Strong market growth in hematology diagnostics in the United States is propelled by increased demand for complete blood count (CBC) testing owing to the rise in the incidence of hematologic cancers and lab automation innovations.

High-throughput hematologyanalyzers and integrated systems for slide review are increasingly taken into use by major hospitals and diagnostic labs for early discovery of disease, blood transfusion management, and chemotherapy monitoring. The expansion in outpatient testing and value-based care models further supports the market growth.
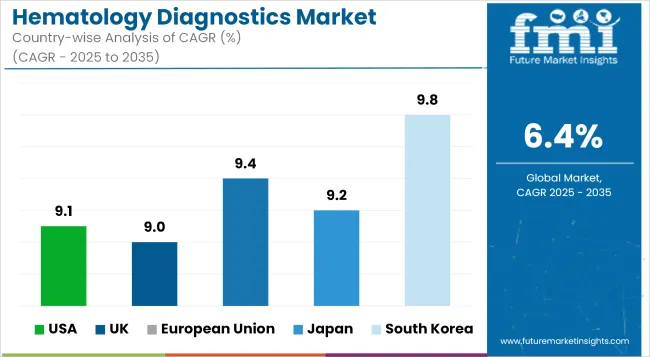
Hematology Diagnostics Market Cagr Analysis By Country

Country CAGR (2025 to 2035)
USA 9.1%

United Kingdom

Modernization of the NHS, increased screening for blood disorders, and huge demand for rapid diagnostic testing in emergency and oncology care are what drive the growth of hematology diagnostics market in the United Kingdom.

UK laboratories use compact, automated analyzers and middleware solutions for seamless integration with electronic health records (EHR), thus expediting turnaround time for diagnosis and coordination of care.

Country CAGR (2025 to 2035)
UK 9.0%

European Union

The European Union is a highly active and fast developing market for hematology diagnostics particularly in Germany, France and Netherlands. Hospitals and private laboratories are increasingly embracing 5-part and 6-part differential analyzers, digital morphology platforms as well as AI-enabled image recognition-based blood profiling systems.

The EU regulatory frameworks and national cancer plans give impetus to the early detection of hematologic diseases in the market, thus increasing the demand in both centralized labs and point-of-care networks.

Region CAGR (2025 to 2035)
European Union 9.4%

Japan

The hematology diagnostics market is steadily growing, driven by the aging population and continuous monitoring of chronic blood conditions. Compact, low-maintenance hematology systems integrated into service delivery and patient care solutions are being deployed by Japanese healthcare providers in regional hospitals and clinics to widen the access to diagnostic services.

Purchasing in government and private sectors is being influenced by an increasing focus on quality assurance, standardization, and advanced flagging algorithms.

Country CAGR (2025 to 2035)
Japan 9.2%

South Korea

The rapid expansion of the hematology diagnostics market within South Korea is on account of an advanced laboratory infrastructure, heavy investment in precision oncology, and government-supported mass health screening programs.

Hematology platforms using AI are merged with digital pathology workflows in South Korean labs, whilst native manufacturers are broadening the outreach of compact, cost-effective systems for both rural and urban clinics.

Country CAGR (2025 to 2035)
South Korea 9.8%

Competition Outlook

The competitive landscape has been defined by companies expanding automated hematology platforms and validated reagent portfolios. Leading manufacturers are investing in digital imaging, AI-powered classification, and connectivity solutions to enhance laboratory workflows and diagnostic accuracy.

Strategic partnerships with reference labs and hospital networks have been prioritized to strengthen distribution and accelerate adoption in emerging markets. Furthermore, investments in training, accreditation support, and service infrastructure are enabling suppliers to differentiate offerings and capture share in a highly competitive market. These trends are expected to maintain innovation intensity and competitive momentum over the forecast period.

Key Development

In 2025, Sysmex Corporation has received 510(k) clearance from the USA FDA for its XR-Series Automated Hematology Analyzer. The company is now preparing for an early market launch of this product in the United States..

In 2024, HORIBA Medical has launched the HELO 2.0, a high-throughput automated hematology platform with CE-IVDR approval and pending US FDA clearance. Designed with customer input, this next-generation system offers a flexible, efficient, and scalable modular solution for mid to large-scale laboratories, building on the success of its predecessor.

Companies

  • Becton Dickinson & Co.
  • Biomerieux SA
  • BTNX Inc.
  • i-SENS, Inc. (Coagusense Inc.)
  • Danaher (Beckman coulter)
  • Danaher (Cepheid)
  • ELDON BIOLOGICALS A/S
  • Bio-rad Laboratories
  • Abbott Laboratories
  • F. Hoffmann-La Roche Ltd.
  • Shenzhen Mindray Bio-Medical Electronics Co., Ltd.
  • Sysmex Corporation
  • Grifols, S.A
  • Horiba
  • Novacyt Group
  • BioMedomics, Inc

Key Segments

By Kit Type:

  • Anemia and Iron Test Kits
  • Folic Acid Testing Kits
  • Sickle Cell Screening Kits
  • PT/INR Testing Kits
  • D-dimer Testing Kits
  • Blood Typing Kits
  • Leukemia Testing Kits
  • Sepsis Testing Kits
  • Antibiotics Resistance Panels
  • Bacterial & Fungal Panels

By Modality:

  • Point of Care
  • Lab-based Testing

By Distribution Channel:

  • Hospitals
  • Diagnostic Laboratories
  • Cancer Research Institutes
  • Retail Pharmacies
  • Drug Store
  • Online Sales Channels

By Region:

  • North America
  • Latin America
  • Europe
  • South Asia & Pacific
  • East Asia
  • Middle East & Africa (MEA)

Table of Content

  1. Executive Summary
  2. Industry Introduction, including Taxonomy and Market Definition
  3. Market Trends and Success Factors, including Macro-economic Factors, Market Dynamics, and Recent Industry Developments
  4. Global Market Demand Analysis 2020 to 2024 and Forecast 2025 to 2035, including Historical Analysis and Future Projections
  5. Global Market Analysis 2020 to 2024 and Forecast 2025 to 2035
    • Kit Type
    • Modality
    • Distribution Channel
  6. Global Market Analysis 2020 to 2024 and Forecast 2025 to 2035, By Kit Type
    • Anemia and Iron Test Kits
    • Folic Acid Testing Kits
    • Sickle Cell Screening Kits
    • PT/INR Testing Kits
    • D-dimer Testing Kits
    • Blood Typing Kits
    • Leukemia Testing Kits
    • Sepsis Testing Kits
    • Antibiotics Resistance Panels
    • Bacterial & Fungal Panels
  7. Global Market Analysis 2020 to 2024 and Forecast 2025 to 2035, By Modality
    • Point of Care
    • Lab-based Testing
  8. Global Market Analysis 2020 to 2024 and Forecast 2025 to 2035, By Distribution Channel
    • Hospitals
    • Diagnostic Laboratories
    • Cancer Research Institutes
    • Retail Pharmacies
    • Drug Store
    • Online Sales Channels
  9. Global Market Analysis 2020 to 2024 and Forecast 2025 to 2035, By Region
    • North America
    • Latin America
    • Western Europe
    • Eastern Europe
    • East Asia
    • South Asia Pacific
    • Middle East and Africa
  10. North America Sales Analysis 2020 to 2024 and Forecast 2025 to 2035, by Key Segments and Countries
  11. Latin America Sales Analysis 2020 to 2024 and Forecast 2025 to 2035, by Key Segments and Countries
  12. Western Europe Sales Analysis 2020 to 2024 and Forecast 2025 to 2035, by Key Segments and Countries
  13. Eastern Europe Sales Analysis 2020 to 2024 and Forecast 2025 to 2035, by Key Segments and Countries
  14. East Asia Sales Analysis 2020 to 2024 and Forecast 2025 to 2035, by Key Segments and Countries
  15. South Asia Pacific Sales Analysis 2020 to 2024 and Forecast 2025 to 2035, by Key Segments and Countries
  16. Middle East and Africa Sales Analysis 2020 to 2024 and Forecast 2025 to 2035, by Key Segments and Countries
  17. Sales Forecast 2025 to 2035 by Kit Type, Modality, and Distribution Channel for 30 Countries
  18. Competition Outlook, including Market Structure Analysis, Company Share Analysis by Key Players, and Competition Dashboard
  19. Company Profile
    • Drew Scientific
    • Abbot Laboratories
    • Bio-Rad Laboratories
    • Sysmex Corporation
    • Mindray Medical International Limited
    • Siemens Healthlineers
    • F. Hoffman-La Roche Ltd.
    • HORIBA Ltd.
    • HemoCue AB
    • Danaher (Beckman Coulter Inc.)

List of Tables

  • Table 1: Global Market Value (USD million) Forecast by Region, 2020 to 2035
  • Table 2: Global Market Volume (Units) Forecast by Region, 2020 to 2035
  • Table 3: Global Market Value (USD million) Forecast by Kit Type, 2020 to 2035
  • Table 4: Global Market Volume (Units) Forecast by Kit Type, 2020 to 2035
  • Table 5: Global Market Value (USD million) Forecast by Modality, 2020 to 2035
  • Table 6: Global Market Volume (Units) Forecast by Modality, 2020 to 2035
  • Table 7: Global Market Value (USD million) Forecast by Distribution Channel, 2020 to 2035
  • Table 8: Global Market Volume (Units) Forecast by Distribution Channel, 2020 to 2035
  • Table 9: North America Market Value (USD million) Forecast by Country, 2020 to 2035
  • Table 10: North America Market Volume (Units) Forecast by Country, 2020 to 2035
  • Table 11: North America Market Value (USD million) Forecast by Kit Type, 2020 to 2035
  • Table 12: North America Market Volume (Units) Forecast by Kit Type, 2020 to 2035
  • Table 13: North America Market Value (USD million) Forecast by Modality, 2020 to 2035
  • Table 14: North America Market Volume (Units) Forecast by Modality, 2020 to 2035
  • Table 15: North America Market Value (USD million) Forecast by Distribution Channel, 2020 to 2035
  • Table 16: North America Market Volume (Units) Forecast by Distribution Channel, 2020 to 2035
  • Table 17: Latin America Market Value (USD million) Forecast by Country, 2020 to 2035
  • Table 18: Latin America Market Volume (Units) Forecast by Country, 2020 to 2035
  • Table 19: Latin America Market Value (USD million) Forecast by Kit Type, 2020 to 2035
  • Table 20: Latin America Market Volume (Units) Forecast by Kit Type, 2020 to 2035
  • Table 21: Latin America Market Value (USD million) Forecast by Modality, 2020 to 2035
  • Table 22: Latin America Market Volume (Units) Forecast by Modality, 2020 to 2035
  • Table 23: Latin America Market Value (USD million) Forecast by Distribution Channel, 2020 to 2035
  • Table 24: Latin America Market Volume (Units) Forecast by Distribution Channel, 2020 to 2035
  • Table 25: Europe Market Value (USD million) Forecast by Country, 2020 to 2035
  • Table 26: Europe Market Volume (Units) Forecast by Country, 2020 to 2035
  • Table 27: Europe Market Value (USD million) Forecast by Kit Type, 2020 to 2035
  • Table 28: Europe Market Volume (Units) Forecast by Kit Type, 2020 to 2035
  • Table 29: Europe Market Value (USD million) Forecast by Modality, 2020 to 2035
  • Table 30: Europe Market Volume (Units) Forecast by Modality, 2020 to 2035
  • Table 31: Europe Market Value (USD million) Forecast by Distribution Channel, 2020 to 2035
  • Table 32: Europe Market Volume (Units) Forecast by Distribution Channel, 2020 to 2035
  • Table 33: East Asia Market Value (USD million) Forecast by Country, 2020 to 2035
  • Table 34: East Asia Market Volume (Units) Forecast by Country, 2020 to 2035
  • Table 35: East Asia Market Value (USD million) Forecast by Kit Type, 2020 to 2035
  • Table 36: East Asia Market Volume (Units) Forecast by Kit Type, 2020 to 2035
  • Table 37: East Asia Market Value (USD million) Forecast by Modality, 2020 to 2035
  • Table 38: East Asia Market Volume (Units) Forecast by Modality, 2020 to 2035
  • Table 39: East Asia Market Value (USD million) Forecast by Distribution Channel, 2020 to 2035
  • Table 40: East Asia Market Volume (Units) Forecast by Distribution Channel, 2020 to 2035
  • Table 41: South Asia & Pacific Market Value (USD million) Forecast by Country, 2020 to 2035
  • Table 42: South Asia & Pacific Market Volume (Units) Forecast by Country, 2020 to 2035
  • Table 43: South Asia & Pacific Market Value (USD million) Forecast by Kit Type, 2020 to 2035
  • Table 44: South Asia & Pacific Market Volume (Units) Forecast by Kit Type, 2020 to 2035
  • Table 45: South Asia & Pacific Market Value (USD million) Forecast by Modality, 2020 to 2035
  • Table 46: South Asia & Pacific Market Volume (Units) Forecast by Modality, 2020 to 2035
  • Table 47: South Asia & Pacific Market Value (USD million) Forecast by Distribution Channel, 2020 to 2035
  • Table 48: South Asia & Pacific Market Volume (Units) Forecast by Distribution Channel, 2020 to 2035
  • Table 49: MEA Market Value (USD million) Forecast by Country, 2020 to 2035
  • Table 50: MEA Market Volume (Units) Forecast by Country, 2020 to 2035
  • Table 51: MEA Market Value (USD million) Forecast by Kit Type, 2020 to 2035
  • Table 52: MEA Market Volume (Units) Forecast by Kit Type, 2020 to 2035
  • Table 53: MEA Market Value (USD million) Forecast by Modality, 2020 to 2035
  • Table 54: MEA Market Volume (Units) Forecast by Modality, 2020 to 2035
  • Table 55: MEA Market Value (USD million) Forecast by Distribution Channel, 2020 to 2035
  • Table 56: MEA Market Volume (Units) Forecast by Distribution Channel, 2020 to 2035

List of Figures

  • Figure 1: Global Market Value (USD million) by Kit Type, 2025 to 2035
  • Figure 2: Global Market Value (USD million) by Modality, 2025 to 2035
  • Figure 3: Global Market Value (USD million) by Distribution Channel, 2025 to 2035
  • Figure 4: Global Market Value (USD million) by Region, 2025 to 2035
  • Figure 5: Global Market Value (USD million) Analysis by Region, 2020 to 2035
  • Figure 6: Global Market Volume (Units) Analysis by Region, 2020 to 2035
  • Figure 7: Global Market Value Share (%) and BPS Analysis by Region, 2025 to 2035
  • Figure 8: Global Market Y-o-Y Growth (%) Projections by Region, 2025 to 2035
  • Figure 9: Global Market Value (USD million) Analysis by Kit Type, 2020 to 2035
  • Figure 10: Global Market Volume (Units) Analysis by Kit Type, 2020 to 2035
  • Figure 11: Global Market Value Share (%) and BPS Analysis by Kit Type, 2025 to 2035
  • Figure 12: Global Market Y-o-Y Growth (%) Projections by Kit Type, 2025 to 2035
  • Figure 13: Global Market Value (USD million) Analysis by Modality, 2020 to 2035
  • Figure 14: Global Market Volume (Units) Analysis by Modality, 2020 to 2035
  • Figure 15: Global Market Value Share (%) and BPS Analysis by Modality, 2025 to 2035
  • Figure 16: Global Market Y-o-Y Growth (%) Projections by Modality, 2025 to 2035
  • Figure 17: Global Market Value (USD million) Analysis by Distribution Channel, 2020 to 2035
  • Figure 18: Global Market Volume (Units) Analysis by Distribution Channel, 2020 to 2035
  • Figure 19: Global Market Value Share (%) and BPS Analysis by Distribution Channel, 2025 to 2035
  • Figure 20: Global Market Y-o-Y Growth (%) Projections by Distribution Channel, 2025 to 2035
  • Figure 21: Global Market Attractiveness by Kit Type, 2025 to 2035
  • Figure 22: Global Market Attractiveness by Modality, 2025 to 2035
  • Figure 23: Global Market Attractiveness by Distribution Channel, 2025 to 2035
  • Figure 24: Global Market Attractiveness by Region, 2025 to 2035
  • Figure 25: North America Market Value (USD million) by Kit Type, 2025 to 2035
  • Figure 26: North America Market Value (USD million) by Modality, 2025 to 2035
  • Figure 27: North America Market Value (USD million) by Distribution Channel, 2025 to 2035
  • Figure 28: North America Market Value (USD million) by Country, 2025 to 2035
  • Figure 29: North America Market Value (USD million) Analysis by Country, 2020 to 2035
  • Figure 30: North America Market Volume (Units) Analysis by Country, 2020 to 2035
  • Figure 31: North America Market Value Share (%) and BPS Analysis by Country, 2025 to 2035
  • Figure 32: North America Market Y-o-Y Growth (%) Projections by Country, 2025 to 2035
  • Figure 33: North America Market Value (USD million) Analysis by Kit Type, 2020 to 2035
  • Figure 34: North America Market Volume (Units) Analysis by Kit Type, 2020 to 2035
  • Figure 35: North America Market Value Share (%) and BPS Analysis by Kit Type, 2025 to 2035
  • Figure 36: North America Market Y-o-Y Growth (%) Projections by Kit Type, 2025 to 2035
  • Figure 37: North America Market Value (USD million) Analysis by Modality, 2020 to 2035
  • Figure 38: North America Market Volume (Units) Analysis by Modality, 2020 to 2035
  • Figure 39: North America Market Value Share (%) and BPS Analysis by Modality, 2025 to 2035
  • Figure 40: North America Market Y-o-Y Growth (%) Projections by Modality, 2025 to 2035
  • Figure 41: North America Market Value (USD million) Analysis by Distribution Channel, 2020 to 2035
  • Figure 42: North America Market Volume (Units) Analysis by Distribution Channel, 2020 to 2035
  • Figure 43: North America Market Value Share (%) and BPS Analysis by Distribution Channel, 2025 to 2035
  • Figure 44: North America Market Y-o-Y Growth (%) Projections by Distribution Channel, 2025 to 2035
  • Figure 45: North America Market Attractiveness by Kit Type, 2025 to 2035
  • Figure 46: North America Market Attractiveness by Modality, 2025 to 2035
  • Figure 47: North America Market Attractiveness by Distribution Channel, 2025 to 2035
  • Figure 48: North America Market Attractiveness by Country, 2025 to 2035
  • Figure 49: Latin America Market Value (USD million) by Kit Type, 2025 to 2035
  • Figure 50: Latin America Market Value (USD million) by Modality, 2025 to 2035
  • Figure 51: Latin America Market Value (USD million) by Distribution Channel, 2025 to 2035
  • Figure 52: Latin America Market Value (USD million) by Country, 2025 to 2035
  • Figure 53: Latin America Market Value (USD million) Analysis by Country, 2020 to 2035
  • Figure 54: Latin America Market Volume (Units) Analysis by Country, 2020 to 2035
  • Figure 55: Latin America Market Value Share (%) and BPS Analysis by Country, 2025 to 2035
  • Figure 56: Latin America Market Y-o-Y Growth (%) Projections by Country, 2025 to 2035
  • Figure 57: Latin America Market Value (USD million) Analysis by Kit Type, 2020 to 2035
  • Figure 58: Latin America Market Volume (Units) Analysis by Kit Type, 2020 to 2035
  • Figure 59: Latin America Market Value Share (%) and BPS Analysis by Kit Type, 2025 to 2035
  • Figure 60: Latin America Market Y-o-Y Growth (%) Projections by Kit Type, 2025 to 2035
  • Figure 61: Latin America Market Value (USD million) Analysis by Modality, 2020 to 2035
  • Figure 62: Latin America Market Volume (Units) Analysis by Modality, 2020 to 2035
  • Figure 63: Latin America Market Value Share (%) and BPS Analysis by Modality, 2025 to 2035
  • Figure 64: Latin America Market Y-o-Y Growth (%) Projections by Modality, 2025 to 2035
  • Figure 65: Latin America Market Value (USD million) Analysis by Distribution Channel, 2020 to 2035
  • Figure 66: Latin America Market Volume (Units) Analysis by Distribution Channel, 2020 to 2035
  • Figure 67: Latin America Market Value Share (%) and BPS Analysis by Distribution Channel, 2025 to 2035
  • Figure 68: Latin America Market Y-o-Y Growth (%) Projections by Distribution Channel, 2025 to 2035
  • Figure 69: Latin America Market Attractiveness by Kit Type, 2025 to 2035
  • Figure 70: Latin America Market Attractiveness by Modality, 2025 to 2035
  • Figure 71: Latin America Market Attractiveness by Distribution Channel, 2025 to 2035
  • Figure 72: Latin America Market Attractiveness by Country, 2025 to 2035
  • Figure 73: Europe Market Value (USD million) by Kit Type, 2025 to 2035
  • Figure 74: Europe Market Value (USD million) by Modality, 2025 to 2035
  • Figure 75: Europe Market Value (USD million) by Distribution Channel, 2025 to 2035
  • Figure 76: Europe Market Value (USD million) by Country, 2025 to 2035
  • Figure 77: Europe Market Value (USD million) Analysis by Country, 2020 to 2035
  • Figure 78: Europe Market Volume (Units) Analysis by Country, 2020 to 2035
  • Figure 79: Europe Market Value Share (%) and BPS Analysis by Country, 2025 to 2035
  • Figure 80: Europe Market Y-o-Y Growth (%) Projections by Country, 2025 to 2035
  • Figure 81: Europe Market Value (USD million) Analysis by Kit Type, 2020 to 2035
  • Figure 82: Europe Market Volume (Units) Analysis by Kit Type, 2020 to 2035
  • Figure 83: Europe Market Value Share (%) and BPS Analysis by Kit Type, 2025 to 2035
  • Figure 84: Europe Market Y-o-Y Growth (%) Projections by Kit Type, 2025 to 2035
  • Figure 85: Europe Market Value (USD million) Analysis by Modality, 2020 to 2035
  • Figure 86: Europe Market Volume (Units) Analysis by Modality, 2020 to 2035
  • Figure 87: Europe Market Value Share (%) and BPS Analysis by Modality, 2025 to 2035
  • Figure 88: Europe Market Y-o-Y Growth (%) Projections by Modality, 2025 to 2035
  • Figure 89: Europe Market Value (USD million) Analysis by Distribution Channel, 2020 to 2035
  • Figure 90: Europe Market Volume (Units) Analysis by Distribution Channel, 2020 to 2035
  • Figure 91: Europe Market Value Share (%) and BPS Analysis by Distribution Channel, 2025 to 2035
  • Figure 92: Europe Market Y-o-Y Growth (%) Projections by Distribution Channel, 2025 to 2035
  • Figure 93: Europe Market Attractiveness by Kit Type, 2025 to 2035
  • Figure 94: Europe Market Attractiveness by Modality, 2025 to 2035
  • Figure 95: Europe Market Attractiveness by Distribution Channel, 2025 to 2035
  • Figure 96: Europe Market Attractiveness by Country, 2025 to 2035
  • Figure 97: East Asia Market Value (USD million) by Kit Type, 2025 to 2035
  • Figure 98: East Asia Market Value (USD million) by Modality, 2025 to 2035
  • Figure 99: East Asia Market Value (USD million) by Distribution Channel, 2025 to 2035
  • Figure 100: East Asia Market Value (USD million) by Country, 2025 to 2035
  • Figure 101: East Asia Market Value (USD million) Analysis by Country, 2020 to 2035
  • Figure 102: East Asia Market Volume (Units) Analysis by Country, 2020 to 2035
  • Figure 103: East Asia Market Value Share (%) and BPS Analysis by Country, 2025 to 2035
  • Figure 104: East Asia Market Y-o-Y Growth (%) Projections by Country, 2025 to 2035
  • Figure 105: East Asia Market Value (USD million) Analysis by Kit Type, 2020 to 2035
  • Figure 106: East Asia Market Volume (Units) Analysis by Kit Type, 2020 to 2035
  • Figure 107: East Asia Market Value Share (%) and BPS Analysis by Kit Type, 2025 to 2035
  • Figure 108: East Asia Market Y-o-Y Growth (%) Projections by Kit Type, 2025 to 2035
  • Figure 109: East Asia Market Value (USD million) Analysis by Modality, 2020 to 2035
  • Figure 110: East Asia Market Volume (Units) Analysis by Modality, 2020 to 2035
  • Figure 111: East Asia Market Value Share (%) and BPS Analysis by Modality, 2025 to 2035
  • Figure 112: East Asia Market Y-o-Y Growth (%) Projections by Modality, 2025 to 2035
  • Figure 113: East Asia Market Value (USD million) Analysis by Distribution Channel, 2020 to 2035
  • Figure 114: East Asia Market Volume (Units) Analysis by Distribution Channel, 2020 to 2035
  • Figure 115: East Asia Market Value Share (%) and BPS Analysis by Distribution Channel, 2025 to 2035
  • Figure 116: East Asia Market Y-o-Y Growth (%) Projections by Distribution Channel, 2025 to 2035
  • Figure 117: East Asia Market Attractiveness by Kit Type, 2025 to 2035
  • Figure 118: East Asia Market Attractiveness by Modality, 2025 to 2035
  • Figure 119: East Asia Market Attractiveness by Distribution Channel, 2025 to 2035
  • Figure 120: East Asia Market Attractiveness by Country, 2025 to 2035
  • Figure 121: South Asia & Pacific Market Value (USD million) by Kit Type, 2025 to 2035
  • Figure 122: South Asia & Pacific Market Value (USD million) by Modality, 2025 to 2035
  • Figure 123: South Asia & Pacific Market Value (USD million) by Distribution Channel, 2025 to 2035
  • Figure 124: South Asia & Pacific Market Value (USD million) by Country, 2025 to 2035
  • Figure 125: South Asia & Pacific Market Value (USD million) Analysis by Country, 2020 to 2035
  • Figure 126: South Asia & Pacific Market Volume (Units) Analysis by Country, 2020 to 2035
  • Figure 127: South Asia & Pacific Market Value Share (%) and BPS Analysis by Country, 2025 to 2035
  • Figure 128: South Asia & Pacific Market Y-o-Y Growth (%) Projections by Country, 2025 to 2035
  • Figure 129: South Asia & Pacific Market Value (USD million) Analysis by Kit Type, 2020 to 2035
  • Figure 130: South Asia & Pacific Market Volume (Units) Analysis by Kit Type, 2020 to 2035
  • Figure 131: South Asia & Pacific Market Value Share (%) and BPS Analysis by Kit Type, 2025 to 2035
  • Figure 132: South Asia & Pacific Market Y-o-Y Growth (%) Projections by Kit Type, 2025 to 2035
  • Figure 133: South Asia & Pacific Market Value (USD million) Analysis by Modality, 2020 to 2035
  • Figure 134: South Asia & Pacific Market Volume (Units) Analysis by Modality, 2020 to 2035
  • Figure 135: South Asia & Pacific Market Value Share (%) and BPS Analysis by Modality, 2025 to 2035
  • Figure 136: South Asia & Pacific Market Y-o-Y Growth (%) Projections by Modality, 2025 to 2035
  • Figure 137: South Asia & Pacific Market Value (USD million) Analysis by Distribution Channel, 2020 to 2035
  • Figure 138: South Asia & Pacific Market Volume (Units) Analysis by Distribution Channel, 2020 to 2035
  • Figure 139: South Asia & Pacific Market Value Share (%) and BPS Analysis by Distribution Channel, 2025 to 2035
  • Figure 140: South Asia & Pacific Market Y-o-Y Growth (%) Projections by Distribution Channel, 2025 to 2035
  • Figure 141: South Asia & Pacific Market Attractiveness by Kit Type, 2025 to 2035
  • Figure 142: South Asia & Pacific Market Attractiveness by Modality, 2025 to 2035
  • Figure 143: South Asia & Pacific Market Attractiveness by Distribution Channel, 2025 to 2035
  • Figure 144: South Asia & Pacific Market Attractiveness by Country, 2025 to 2035
  • Figure 145: MEA Market Value (USD million) by Kit Type, 2025 to 2035
  • Figure 146: MEA Market Value (USD million) by Modality, 2025 to 2035
  • Figure 147: MEA Market Value (USD million) by Distribution Channel, 2025 to 2035
  • Figure 148: MEA Market Value (USD million) by Country, 2025 to 2035
  • Figure 149: MEA Market Value (USD million) Analysis by Country, 2020 to 2035
  • Figure 150: MEA Market Volume (Units) Analysis by Country, 2020 to 2035
  • Figure 151: MEA Market Value Share (%) and BPS Analysis by Country, 2025 to 2035
  • Figure 152: MEA Market Y-o-Y Growth (%) Projections by Country, 2025 to 2035
  • Figure 153: MEA Market Value (USD million) Analysis by Kit Type, 2020 to 2035
  • Figure 154: MEA Market Volume (Units) Analysis by Kit Type, 2020 to 2035
  • Figure 155: MEA Market Value Share (%) and BPS Analysis by Kit Type, 2025 to 2035
  • Figure 156: MEA Market Y-o-Y Growth (%) Projections by Kit Type, 2025 to 2035
  • Figure 157: MEA Market Value (USD million) Analysis by Modality, 2020 to 2035
  • Figure 158: MEA Market Volume (Units) Analysis by Modality, 2020 to 2035
  • Figure 159: MEA Market Value Share (%) and BPS Analysis by Modality, 2025 to 2035
  • Figure 160: MEA Market Y-o-Y Growth (%) Projections by Modality, 2025 to 2035
  • Figure 161: MEA Market Value (USD million) Analysis by Distribution Channel, 2020 to 2035
  • Figure 162: MEA Market Volume (Units) Analysis by Distribution Channel, 2020 to 2035
  • Figure 163: MEA Market Value Share (%) and BPS Analysis by Distribution Channel, 2025 to 2035
  • Figure 164: MEA Market Y-o-Y Growth (%) Projections by Distribution Channel, 2025 to 2035
  • Figure 165: MEA Market Attractiveness by Kit Type, 2025 to 2035
  • Figure 166: MEA Market Attractiveness by Modality, 2025 to 2035
  • Figure 167: MEA Market Attractiveness by Distribution Channel, 2025 to 2035
  • Figure 168: MEA Market Attractiveness by Country, 2025 to 2035

Frequently Asked Questions

What was the overall size of the hematology diagnostics market in 2025?

The overall market size for the hematology diagnostics market was USD 3,971.8 million in 2025.

How big is the hematology diagnostics market expected to be in 2035?

The hematology diagnostics market is expected to reach USD 6,287.2 million in 2035.

What will drive the demand for the hematology diagnostics market during the forecast period?

The increasing incidence of blood disorders, rising demand for early cancer detection, and growing use of leukemia testing kits in lab-based testing fuel the hematology diagnostics market during the forecast period.

List the top 5 countries contributing to the hematology diagnostics market?

The top 5 countries driving the development of the hematology diagnostics market are the USA, UK, European Union, Japan, and South Korea.

Which segment in type is expected to lead in the hematology diagnostics market?

Leukemia testing kits and lab-based testing lead market growth to command a significant share over the assessment period.

Explore Similar Insights

Future Market Insights

Hematology Diagnostics Market