Clostridium Diagnostics Market Size and Share Forecast Outlook (2022 to 2032)

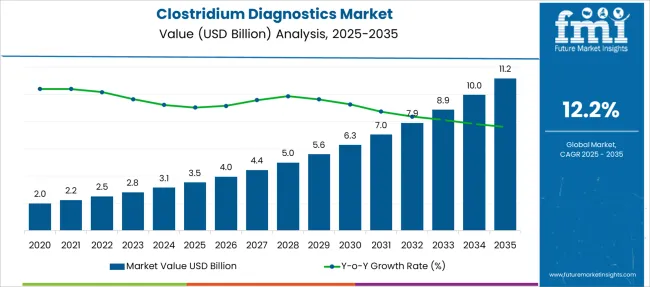
Rising from USD 2.5 Billion in 2022 to USD 7.8 Billion by 2032, the global clostridium diagnostics market is projected to exhibit a CAGR of 12.2% during the forecast period. From 2015 to 2021, the market displayed a CAGR of 13.6%. The growth of the market can be attributed to the rising prevalence of clostridium-related diseases and the increasing campaigns to educate individuals regarding the condition.

Report Attribute Key Statistics
Clostridium Diagnostics Market Size (2022) USD 2.5 Billion
Clostridium Diagnostics Market Revenue Forecast (2032) USD 7.8 Billion
Clostridium Diagnostics Market Growth Rate (2022 to 2032) 12.2%

As per the Centres for Disease Control and Prevention, Clostridium perfringens bacteria are one of the most common causes of foodborne illness (food poisoning). CDC estimates that these bacteria cause about 1 million illnesses in the States every year.

Such a significant number is expected to boost demand for an efficient clostridium diagnostics method. Other factors responsible for the market growth include changing lifestyles, developing healthcare infrastructure, and technological development such as AI and automation.

The high fatality rate of clostridium diseases, growing demand for animal-based products, and growing usage of animals in agriculture are expected to benefit the industry in the forecast period. As per the United States Department of Agriculture (USDA), the population of cattle in the USA in 2016, was 92 million and a significant population was susceptible to clostridium conditions. Such factors are likely to benefit the market in the forecast period.

The growing focus of players to offer vaccines for the fatal situation is predicted to augment the market size in the forecast period. For instance, in February 2019, Merck Animal Health and Rapid Genomics signed an agreement for vaccine verification, where Merck has exclusive rights to Rapid Genomics’ vaccination verification tool, Viral Flex-Seq.

Key companies in the market are taking several initiatives to conduct clinical trials for the development of the clostridium vaccine. For instance, in January 2017, Pfizer announced a phase II study of investigational Clostridium difficile vaccine candidate: PF-06425090; for the prevention of C. difficile infection.

The randomized Phase II study was conducted to examine the safety, immunogenicity, and tolerability of the vaccine in healthy adults 65 to 85 years of age. Pfizer initiated a phase III study in March 2017, with 16,000 participants. Attributed to such factors, the market is projected to flourish in the forecast period.

Comparison of Historical vs Forecast Outlook (2015 to 2032) for Clostridium Diagnostics

Ongoing Partnerships among Players and Launch of new Vaccines to Spike the Market Growth Graph Notably

Growing expenditure on healthcare infrastructure is expected to have played a significant role in developing the market during the timeframe. As per the analysis, from 2015 to 2021, the market is projected to display a CAGR of 13.6%. Initiatives by players in the market are expected to have strengthened the industry growth during the aforementioned time period.

For instance, in August 2016, Boehringer Ingelheim Vetmedica, Inc. launched the Alpha-7 vaccine, the only first-of-a-kind vaccine, single-dose vaccination offering a 7-way defense against clostridium diseases.

Other factors contributing to the market growth include technological development in diagnostic equipment and growing awareness about clostridium-related disorders. Owing to the aforementioned factors, the market is anticipated to have developed significantly during the time period from 2015 to 2021.

During the forecast period from 2022 to 2032, the market is expected to display a CAGR of 12.2%. The growth of the market can be attributed to the growing focus of players to expand their footprint in the industry. For instance, in March 2021, Peggy Lillis Foundation for Clostridium difficile infections announced a partnership with Ferring Pharmaceutical through a new sponsorship to assist new and existing patient advocacy initiatives.

The sponsorship focuses on supporting the organization’s National C. doff Adovacy summit, 2021 FIGHT C.Diff Gala. Attributed to such factors, the global clostridium diagnostics market is projected to develop significantly during the forecast period from 2022 to 2032.

Key Drivers Fueling the Global Clostridium Diagnostics Market

Growing Launch of New Vaccines for Clostridium Condition to Boost the Market

Players in the market are taking various efforts to offer effective vaccines against the deadly Clostridium condition, which is expected to benefit the industry in the forecast period. Growing cases of the condition among animals have encouraged players in the market to launch new vaccines.

For instance, in August 2021, Huvepharma Canada Corportation Inc. launched a new vaccine that has been shown to be effective against necrotic enteritis (NE) due to Clostridium perfringens Type A in broiler chickens.

Other factors contributing to the market growth include increasing awareness about the condition, changing lifestyles, and the development of healthcare infrastructure, among others. Such factors are expected to drive the global clostridium diagnostics market during the forecast period.

Restraints Impacting the Clostridium Diagnostics Market

Lack of Awareness and Resources in Developing Countries to Hamper the Market Growth

Scarcity of resources and lack of awareness in developing countries is expected to be the most significant factor impeding market growth during the forecast period. Further, the high costs involved in R&D and vaccine manufacturing is projected to be another potential challenge to the market in the forecast period.
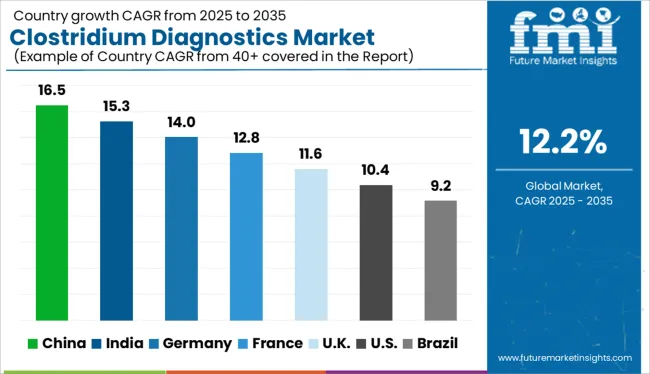
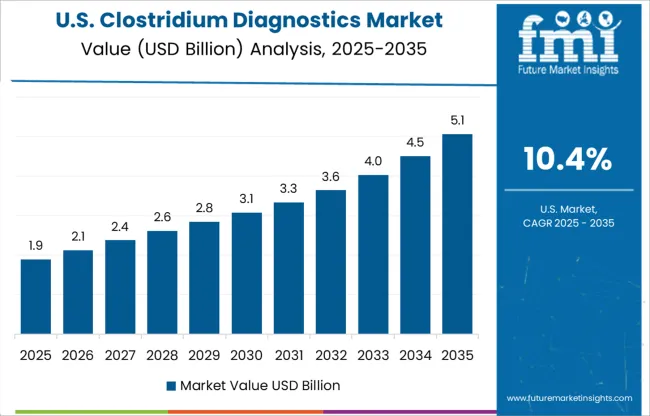
Analysis of Top Countries Conducting Clostridium Diagnostics

How is the Growing Awareness in the USA Boosting the Global Clostridium Diagnostics Market?

Launch of Awareness Campaigns in the States to Augment the Market Size of the USA

As per the analysis, the USA is anticipated to secure a market value worth USD 2.7 Billion during the forecast period. From 2022 to 2032, the country is projected to display a CAGR of 11.8%, while it was 13.3% from 2015 to 2021.

The growth of the USA market can be attributed to the growing awareness among people owing to the rising launch of campaigns by various bodies. For instance, the “See C. diff” campaign, launched by Peggy Lillis Foundation in December 2020, attained its objective by reaching more than 250,000 Americans.

The organization launched the “See C. diff” to commemorate C.diff Awareness Month in 2019, and reached about 80,000 people. Attributed to such efforts, the market in the USA is projected to flourish significantly in the coming time.

How are the Favorable Initiatives taken by Japan Benefitting the Global Clostridium Diagnostics Market?

Implementation of Favorable Initiatives to Support the Market in Japan

As per the analysis, the market in Japan is projected to display a CAGR of 11.1% during the forecast period from 2022 to 2032. The market value is estimated at USD 464 Million by 2032. From 2015 to 2021, the country experienced a CAGR of 12.4%.

The growth of the Japanese market can be attributed to the implementation of favorable initiatives. For instance, in March 2022, Japan launched a new center, with a budget of USD 1.6 Billion, to support vaccine and drug projects as a part of a larger scheme to tackle infectious diseases.

SCARDA will be in charge of establishing a flagship R&D site for innovative collaborations and controlling funds for R&D projects. Due to such factors, the market in Japan is expected to experience various opportunities for expansion in the forecast period.

Clostridium Diagnostics Industry Analysis by Top Investment Segments

Which Technology Segment is expected to dominate the Global Clostridium Diagnostics Market?

Growing Adoption of Antibiotics for the Treatment of Infection to Develop the Segmental Growth

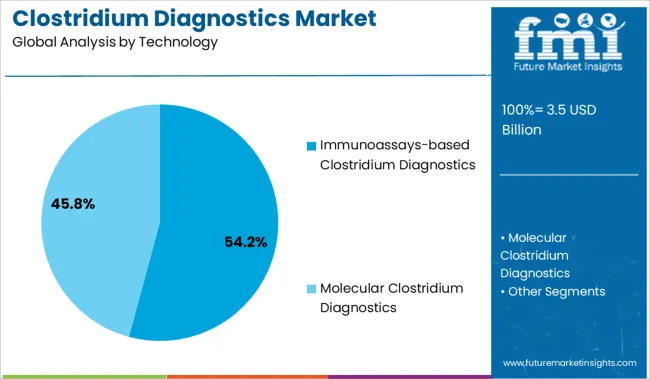
As per the analysis, by technology, the global clostridium diagnostics market is expected to be dominated by the immunoassays segment. The segment is anticipated to display a CAGR of 11.7% during the assessment period from 2022 to 2032.

The development of the segment can be attributed to the increasing adoption of antibiotics for infection treatment. Also, development in drug design and availability of higher antibiotics, and growing awareness about the disease are projected to strengthen the segmental growth in the forecast period.

Which Product Holds the Maximum Potential for Clostridium Diagnostics Market Growth?

Growing Prevalence of Clostridium-related Ailments to Boost the Segmental Growth

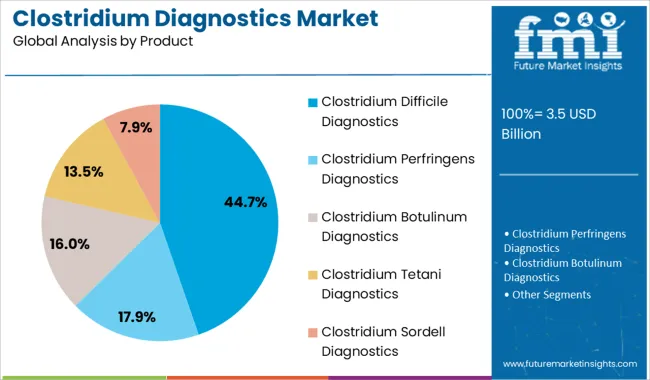
According to the analysis, the clostridium difficile segment is anticipated to dominate the global clostridium diagnostics market during the forecast period. From 2022 to 2032, the segment is projected to display a CAGR of 11.6%.

The development of the segment can be attributed to the growing prevalence of clostridium-related diseases and expanding geriatric population. Also, developing healthcare infrastructure and technical development are projected to be other salient factors driving the growth of the segment in the forecast period.

Role of Emerging Players in the Global Clostridium Diagnostics Market

Acurx Pharmaceuticals, Cubist Pharmaceuticals, Endo Aesthetics, Avisa Pharma, and MGB Bio Pharma, among others, are anticipated to play a significant role in developing the market during the forecast period. Emerging entities are taking several initiatives that are likely to benefit the industry during the forecast period.
  • MGB Bio Pharma, a developer of drugs for drug-resistant bacterial infections. The company has a pipeline of anti-bacterial, intravenous, oral molecules, and topical drugs. The lead product is MGB-BP-3 which has the potential against a range of Gram-positive bacteria including MRSA, VRE, and clostridium difficile. Such factors are anticipated to benefit the industry in the coming time.

Competitive Landscape of the Clostridium Diagnostics Market

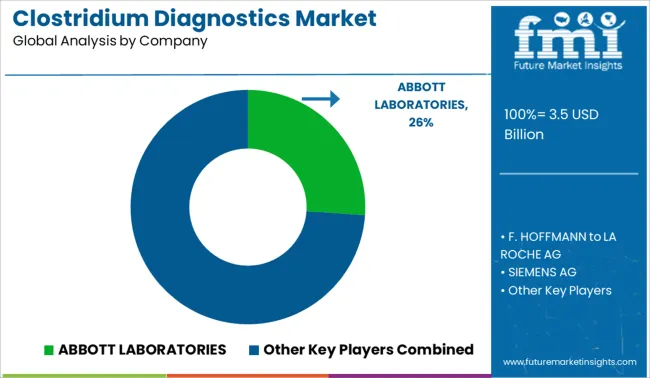
Key players in the global clostridium diagnostics market include Abbott Laboratories, F. Hoffmann-LA ROCHE AG, Siemens AG, Becton Dickinson and Company, and Beckman Coulter, INC.

Scope and Coverage of the Clostridium Diagnostics Market Report

Report Attribute Details
Growth Rate CAGR of 12.2% from 2022 to 2032
Market Value in 2022 USD 2.5 Billion
Market Value in 2032 USD 7.8 Billion
Base Year for Estimation 2021
Historical Data 2015 to 2021
Forecast Period 2022 to 2032
Quantitative Units Revenue in USD Million and CAGR from 2022 to 2032
Report Coverage Revenue Forecast, Company Ranking, Competitive Landscape, Growth Factors, Trends and Pricing Analysis
Segments Covered Technology, Product, End User, Region
Regions Covered North America; Latin America; Europe; Asia Pacific; Middle East & Africa
Key Countries Profiled USA, Canada, Brazil, Mexico, Germany, France, UK, Italy, BENELUX, Nordics, China, Japan, South Korea, GCC, South Africa, Turkey
Key Companies Profiled Abbott Laboratories; F. Hoffmann La-Roche AG; Siemens AG; Becton, Dickinson & Company; Beckman Coulter Inc.; Sysmex India Pvt. Ltd.; Thermo Fisher Scientific Inc.; Fujirebio US Inc.; BioMerieux S.A; Diazyme Laboratories Inc.
Customization Available Upon Request

Top Segments Studied in the Clostridium Diagnostics Market Research Report

Clostridium Diagnostics Market by Technology:

  • Immunoassays-based Clostridium Diagnostics
  • Molecular Clostridium Diagnostics

Clostridium Diagnostics Market by End User:

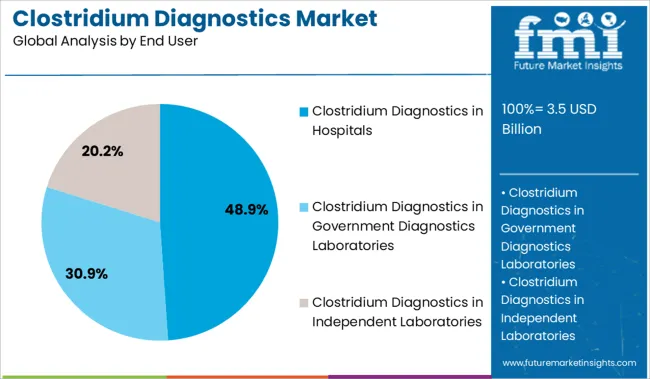
  • Clostridium Diagnostics in Hospitals
  • Clostridium Diagnostics in Government Diagnostics Laboratories
  • Clostridium Diagnostics in Independent Laboratories

Clostridium Diagnostics Market by Product:

  • Clostridium Difficile Diagnostics
  • Clostridium Perfringens Diagnostics
  • Clostridium Botulinum Diagnostics
  • Clostridium Tetani Diagnostics
  • Clostridium Sordell Diagnostics

Clostridium Diagnostics Market by Region:

  • North America Clostridium Diagnostics Market
  • Asia Pacific Clostridium Diagnostics Market
  • Europe Clostridium Diagnostics Market
  • Middle East & Africa Clostridium Diagnostics Market
  • Latin America Clostridium Diagnostics Market

Table of Content

  • 1. Executive Summary
  • 2. Market Overview
  • 3. Market Risks and Trends Assessment
  • 4. Market Background
  • 5. Key Success Factors
  • 6. Global Market Demand Analysis 2015 to 2021 and Forecast, 2022 to 2032
  • 7. Global Market Value Analysis 2015 to 2021 and Forecast, 2022 to 2032
  • 8. Global Market Analysis 2015 to 2021 and Forecast 2022 to 2032, By Technology
    • 8.1. IMMUNOASSAYS
    • 8.2. MOLECULAR DIAGNOSTICS
  • 9. Global Market Analysis 2015 to 2021 and Forecast 2022 to 2032, By Product
    • 9.1. CLOSTRIDIUM DIFFICILE
    • 9.2. CLOSTRIDIUM PERFRINGENS
    • 9.3. CLOSTRIDIUM BOTULINUM
    • 9.4. CLOSTRIDIUM TETANI
    • 9.5. CLOSTRIDIUM SORDELLII
  • 10. Global Market Analysis 2015 to 2021 and Forecast 2022 to 2032, By End to user
    • 10.1. HOSPITALS
    • 10.2. GOVERNMENT DIAGNOSTIC LABORATORIES
    • 10.3. INDEPENDENT LABORATORIES
  • 11. Global Market Analysis 2015 to 2021 and Forecast 2022 to 2032, By Region
    • 11.1. North America
    • 11.2. Latin America
    • 11.3. Europe
    • 11.4. Asia Pacific
    • 11.5. Middle East and Africa (MEA)
  • 12. North America Market Analysis 2015 to 2021 and Forecast 2022 to 2032
  • 13. Latin America Market Analysis 2015 to 2021 and Forecast 2022 to 2032
  • 14. Europe Market Analysis 2015 to 2021 and Forecast 2022 to 2032
  • 15. Asia Pacific Market Analysis 2015 to 2021 and Forecast 2022 to 2032
  • 16. Middle East and Africa Market Analysis 2015 to 2021 and Forecast 2022 to 2032
  • 17. Key Countries Market Analysis 2015 to 2021 and Forecast 2022 to 2032
  • 18. Market Structure Analysis
  • 19. Competition Analysis
    • 19.1. ABBOTT LABORATORIES
    • 19.2. F. HOFFMANN to LA ROCHE AG
    • 19.3. SIEMENS AG
    • 19.4. BECTON, DICKINSON AND COMPANY
    • 19.5. BECKMAN COULTER, INC.
    • 19.6. SYSMEX INDIA PVT. LTD.
    • 19.7. THERMO FISHER SCIENTIFIC INC.
    • 19.8. FUJIREBIO US, INC.
    • 19.9. BIOMÉRIEUX SA
    • 19.10. DIAZYME LABORATORIES, INC.
  • 20. Assumptions and Acronyms Used
  • 21. Research Methodology

List of Tables

Table 01: Global Market Value (US$ Mn), By Technology, 2015 – 2021

Table 02: Global Market Value (US$ Mn), By Technology, 2022 – 2032

Table 03: Global Market Value (US$ Mn), By End-user, 2015 – 2021

Table 04: Global Market Value (US$ Mn), By End-user, 2022 – 2032

Table 05: Global Market Value (US$ Mn), By Product, 2015 – 2021

Table 06: Global Market Value (US$ Mn), By Product, 2022 – 2032

Table 07: Global Market, By Region, 2015 – 2021

Table 08: Global Market, By Region, 2022 – 2032

Table 09: North America Market Value (US$ Mn), By Technology, 2015 – 2021

Table 10: North America Market Value (US$ Mn), By Technology, 2022 – 2032

Table 11: North America Market Value (US$ Mn), By End-user, 2015 – 2021

Table 12: North America Market Value (US$ Mn), By End-user, 2022 – 2032

Table 13: North America Market Value (US$ Mn), By Product, 2015 – 2021

Table 14: North America Market Value (US$ Mn), By Product, 2022 – 2032

Table 15: North America Market, By Country, 2015 – 2021

Table 16: North America Market, By Country, 2022 – 2032

Table 17: Latin America Market Value (US$ Mn), By Technology, 2015 – 2021

Table 18: Latin America Market Value (US$ Mn), By Technology, 2022 – 2032

Table 19: Latin America Market Value (US$ Mn), By End-user, 2015 – 2021

Table 20: Latin America Market Value (US$ Mn), By End-user, 2022 – 2032

Table 21: Latin America Market Value (US$ Mn), By Product, 2015 – 2021

Table 22: Latin America Market Value (US$ Mn), By Product, 2022 – 2032

Table 23: Latin America Market, By Country, 2015 – 2021

Table 24: Latin America Market, By Country, 2022 – 2032

Table 25: Europe Market Value (US$ Mn), By Technology, 2015 – 2021

Table 26: Europe Market Value (US$ Mn), By Technology, 2022 – 2032

Table 27: Europe Market Value (US$ Mn), By End-user, 2015 – 2021

Table 28: Europe Market Value (US$ Mn), By End-user, 2022 – 2032

Table 29: Europe Market Value (US$ Mn), By Product, 2015 – 2021

Table 30: Europe Market Value (US$ Mn), By Product, 2022 – 2032

Table 31: Europe Market, By Country, 2015 – 2021

Table 32: Europe Market, By Country, 2022 – 2032

Table 33: Asia Pacific Market Value (US$ Mn), By Technology, 2015 – 2021

Table 34: Asia Pacific Market Value (US$ Mn), By Technology, 2022 – 2032

Table 35: Asia Pacific Market Value (US$ Mn), By End-user, 2015 – 2021

Table 36: Asia Pacific Market Value (US$ Mn), By End-user, 2022 – 2032

Table 37: Asia Pacific Market Value (US$ Mn), By Product, 2015 – 2021

Table 38: Asia Pacific Market Value (US$ Mn), By Product, 2022 – 2032

Table 39: Asia Pacific Market, By Country, 2015 – 2021

Table 40: Asia Pacific Market, By Country, 2022 – 2032

Table 41: MEA Market Value (US$ Mn), By Technology, 2015 – 2021

Table 42: MEA Market Value (US$ Mn), By Technology, 2022 – 2032

Table 43: MEA Market Value (US$ Mn), By End-user, 2015 – 2021

Table 44: MEA Market Value (US$ Mn), By End-user, 2022 – 2032

Table 45: MEA Market Value (US$ Mn), By Product, 2015 – 2021

Table 46: MEA Market Value (US$ Mn), By Product, 2022 – 2032

Table 47: MEA Market, By Country, 2015 – 2021

Table 48: MEA Market, By Country, 2022 – 2032

Table 49: Global Market Incremental $ Opportunity, By Technology, 2015 - 2021

Table 50: Global Market Incremental $ Opportunity, By End-user, 2022 – 2032

Table 51: Global Market Incremental $ Opportunity, By Product, 2015 - 2021

Table 52: Global Market Incremental $ Opportunity, By Region, 2022 – 2032

Table 53: North America Market Incremental $ Opportunity, By Technology, 2015 - 2021

Table 54: North America Market Incremental $ Opportunity, By End-user, 2022 – 2032

Table 55: North America Market Incremental $ Opportunity, By Product, 2015 – 2021

Table 56: North America Market Incremental $ Opportunity, By Country, 2022 – 2032

Table 57: Latin America Market Incremental $ Opportunity, By Technology, 2015 - 2021

Table 58: Latin America Market Incremental $ Opportunity, By End-user, 2022 – 2032

Table 59: Latin America Market Incremental $ Opportunity, By Product, 2015 - 2021

Table 60: Latin America Market Incremental $ Opportunity, By Country, 2022 – 2032

Table 61: Europe Market Incremental $ Opportunity, By Technology, 2015 - 2021

Table 62: Europe Market Incremental $ Opportunity, By End-user, 2022 – 2032

Table 63: Europe Market Incremental $ Opportunity, By Product, 2015 - 2021

Table 64: Europe Market Incremental $ Opportunity, By Country, 2022 - 2032

Table 65: Asia Pacific Market Incremental $ Opportunity, By Technology, 2015 - 2021

Table 66: Asia Pacific Market Incremental $ Opportunity, By End-user, 2022 – 2032

Table 67: Asia Pacific Market Incremental $ Opportunity, By Product, 2015 - 2021

Table 68: Asia Pacific Market Incremental $ Opportunity, By Country, 2022 – 2032

Table 69: MEA Market Incremental $ Opportunity, By Technology, 2015 - 2021

Table 70: MEA Market Incremental $ Opportunity, By End-user, 2022 – 2032

Table 71: MEA Market Incremental $ Opportunity, By Product, 2015 - 2021

Table 72: MEA Market Incremental $ Opportunity, By Country, 2022 - 2032

List of Figures

Figure 01: Global Market Value (US$ Mn) and Year-on-Year Growth, 2015-2032

Figure 02: Global Market Absolute $ Historical Gain (2015 - 2021) and Opportunity (2022 – 2032), US$ Mn

Figure 03: Global Market Share, By Technology, 2022 & 2032

Figure 04: Global Market Y-o-Y Growth Projections, By Technology – 2022-2032

Figure 05: Global Market Attractiveness Index, By Technology – 2022-2032

Figure 06: Global Market Share, By End-user, 2022 & 2032

Figure 07: Global Market Y-o-Y Growth Projections, By End-user – 2022-2032

Figure 08: Global Market Attractiveness Index, By End-user – 2022-2032

Figure 09: Global Market Share, By Product, 2022 & 2032

Figure 10: Global Market Y-o-Y Growth Projections, By Product – 2022-2032

Figure 11: Global Market Attractiveness Index, By Product – 2022-2032

Figure 12: Global Market Share, By Region, 2022 & 2032

Figure 13: Global Market Y-o-Y Growth Projections, By Region – 2022-2032

Figure 14: Global Market Attractiveness Index, By Region – 2022-2032

Figure 15: North America Market Value (US$ Mn) and Year-on-Year Growth, 2015-2032

Figure 16: North America Market Absolute $ Opportunity Historical (2015 - 2021) and Forecast Period (2022 – 2032), US$ Mn

Figure 17: North America Market Share, By Technology, 2022 & 2032

Figure 18: North America Market Y-o-Y Growth Projections, By Technology – 2022-2032

Figure 19: North America Market Attractiveness Index, By Technology – 2022-2032

Figure 20: North America Market Share, By End-user, 2022 & 2032

Figure 21: North America Market Y-o-Y Growth Projections, By End-user – 2022-2032

Figure 22: North America Market Attractiveness Index, By End-user – 2022-2032

Figure 23: North America Market Share, By Product, 2022 & 2032

Figure 24: North America Market Y-o-Y Growth Projections, By Product – 2022-2032

Figure 25: North America Market Attractiveness Index, By Product – 2022-2032

Figure 26: North America Market Share, By Country, 2022 & 2032

Figure 27: North America Market Y-o-Y Growth Projections, By Country – 2022-2032

Figure 28: North America Market Attractiveness Index, By Country – 2022-2032

Figure 29: Latin America Market Value (US$ Mn) and Year-on-Year Growth, 2015-2032

Figure 30: Latin America Market Absolute $ Opportunity Historical (2015 - 2021) and Forecast Period (2022 – 2032), US$ Mn

Figure 31: Latin America Market Share, By Technology, 2022 & 2032

Figure 32: Latin America Market Y-o-Y Growth Projections, By Technology – 2022-2032

Figure 33: Latin America Market Attractiveness Index, By Technology – 2022-2032

Figure 34: Latin America Market Share, By End-user, 2022 & 2032

Figure 35: Latin America Market Y-o-Y Growth Projections, By End-user – 2022-2032

Figure 36: Latin America Market Attractiveness Index, By End-user – 2022-2032

Figure 37: Latin America Market Share, By Product, 2022 & 2032

Figure 38: Latin America Market Y-o-Y Growth Projections, By Product – 2022-2032

Figure 39: Latin America Market Attractiveness Index, By Product – 2022-2032

Figure 40: Latin America Market Share, By Country, 2022 & 2032

Figure 41: Latin America Market Y-o-Y Growth Projections, By Country – 2022-2032

Figure 42: Latin America Market Attractiveness Index, By Country – 2022-2032

Figure 43: Europe Market Value (US$ Mn) and Year-on-Year Growth, 2015-2032

Figure 44: Europe Market Absolute $ Opportunity Historical (2015 - 2021) and Forecast Period (2022 – 2032), US$ Mn

Figure 45: Europe Market Share, By Technology, 2022 & 2032

Figure 46: Europe Market Y-o-Y Growth Projections, By Technology – 2022-2032

Figure 47: Europe Market Attractiveness Index, By Technology – 2022-2032

Figure 48: Europe Market Share, By End-user, 2022 & 2032

Figure 49: Europe Market Y-o-Y Growth Projections, By End-user – 2022-2032

Figure 50: Europe Market Attractiveness Index, By End-user – 2022-2032

Figure 51: Europe Market Share, By Product, 2022 & 2032

Figure 52: Europe Market Y-o-Y Growth Projections, By Product – 2022-2032

Figure 53: Europe Market Attractiveness Index, By Product – 2022-2032

Figure 54: Europe Market Share, By Country, 2022 & 2032

Figure 55: Europe Market Y-o-Y Growth Projections, By Country – 2022-2032

Figure 56: Europe Market Attractiveness Index, By Country – 2022-2032

Figure 57: MEA Market Value (US$ Mn) and Year-on-Year Growth, 2015-2032

Figure 58: MEA Market Absolute $ Opportunity Historical (2015 - 2021) and Forecast Period (2022 – 2032), US$ Mn

Figure 59: MEA Market Share, By Technology, 2022 & 2032

Figure 60: MEA Market Y-o-Y Growth Projections, By Technology – 2022-2032

Figure 61: MEA Market Attractiveness Index, By Technology – 2022-2032

Figure 62: MEA Market Share, By End-user, 2022 & 2032

Figure 63: MEA Market Y-o-Y Growth Projections, By End-user – 2022-2032

Figure 64: MEA Market Attractiveness Index, By End-user – 2022-2032

Figure 65: MEA Market Share, By Product, 2022 & 2032

Figure 66: MEA Market Y-o-Y Growth Projections, By Product – 2022-2032

Figure 67: MEA Market Attractiveness Index, By Product – 2022-2032

Figure 68: MEA Market Share, By Country, 2022 & 2032

Figure 69: MEA Market Y-o-Y Growth Projections, By Country – 2022-2032

Figure 70: MEA Market Attractiveness Index, By Country – 2022-2032

Figure 71: Asia Pacific Market Value (US$ Mn) and Year-on-Year Growth, 2015-2032

Figure 72: Asia Pacific Market Absolute $ Opportunity Historical (2015 - 2021) and Forecast Period (2022 – 2032), US$ Mn

Figure 73: Asia Pacific Market Share, By Technology, 2022 & 2032

Figure 74: Asia Pacific Market Y-o-Y Growth Projections, By Technology – 2022-2032

Figure 75: Asia Pacific Market Attractiveness Index, By Technology – 2022-2032

Figure 76: Asia Pacific Market Share, By End-user, 2022 & 2032

Figure 77: Asia Pacific Market Y-o-Y Growth Projections, By End-user – 2022-2032

Figure 78: Asia Pacific Market Attractiveness Index, By End-user – 2022-2032

Figure 79: Asia Pacific Market Share, By Product, 2022 & 2032

Figure 80: Asia Pacific Market Y-o-Y Growth Projections, By Product – 2022-2032

Figure 81: Asia Pacific Market Attractiveness Index, By Product – 2022-2032

Figure 82: Asia Pacific Market Share, By Country, 2022 & 2032

Figure 83: Asia Pacific Market Y-o-Y Growth Projections, By Country – 2022-2032

Figure 84: Asia Pacific Market Attractiveness Index, By Country – 2022-2032

Figure 85: US Market Value (US$ Mn) and Forecast, 2022 - 2032

Figure 86: US Market Share, By Technology, 2021

Figure 87: US Market Share, By End-user, 2021

Figure 88: US Market Share, By Product, 2021

Figure 89: Canada Market Value (US$ Mn) and Forecast, 2022 - 2032

Figure 90: Canada Market Share, By Technology, 2021

Figure 91: Canada Market Share, By End-user, 2021

Figure 92: Canada Market Share, By Product, 2021

Figure 93: Brazil Market Value (US$ Mn) and Forecast, 2022 - 2032

Figure 94: Brazil Market Share, By Technology, 2021

Figure 95: Brazil Market Share, By End-user, 2021

Figure 96: Brazil Market Share, By Product, 2021

Figure 97: Mexico Market Value (US$ Mn) and Forecast, 2022 - 2032

Figure 98: Mexico Market Share, By Technology, 2021

Figure 99: Mexico Market Share, By End-user, 2021

Figure 100: Mexico Market Share, By Product, 2021

Figure 101: Germany Market Value (US$ Mn) and Forecast, 2022 - 2032

Figure 102: Germany Market Share, By Technology, 2021

Figure 103: Germany Market Share, By End-user, 2021

Figure 104: Germany Market Share, By Product, 2021

Figure 105: U.K. Market Value (US$ Mn) and Forecast, 2022 - 2032

Figure 106: U.K. Market Share, By Technology, 2021

Figure 107: U.K. Market Share, By End-user, 2021

Figure 108: U.K. Market Share, By Product, 2021

Figure 109: France Market Value (US$ Mn) and Forecast, 2022 - 2032

Figure 110: France Market Share, By Technology, 2021

Figure 111: France Market Share, By End-user, 2021

Figure 112: France Market Share, By Product, 2021

Figure 113: Italy Market Value (US$ Mn) and Forecast, 2022 - 2032

Figure 114: Italy Market Share, By Technology, 2021

Figure 115: Italy Market Share, By End-user, 2021

Figure 116: Italy Market Share, By Product, 2021

Figure 117: BENELUX Market Value (US$ Mn) and Forecast, 2022 - 2032

Figure 118: BENELUX Market Share, By Technology, 2021

Figure 119: BENELUX Market Share, By End-user, 2021

Figure 120: BENELUX Market Share, By Product, 2021

Figure 121: Nordic Countries Market Value (US$ Mn) and Forecast, 2022 - 2032

Figure 122: Nordic Countries Market Share, By Technology, 2021

Figure 123: Nordic Countries Market Share, By End-user, 2021

Figure 124: Nordic Countries Market Share, By Product, 2021

Figure 125: China Market Value (US$ Mn) and Forecast, 2022 - 2032

Figure 126: China Market Share, By Technology, 2021

Figure 127: China Market Share, By End-user, 2021

Figure 128: China Market Share, By Product, 2021

Figure 129: Japan Market Value (US$ Mn) and Forecast, 2022 - 2032

Figure 130: Japan Market Share, By Technology, 2021

Figure 131: Japan Market Share, By End-user, 2021

Figure 132: Japan Market Share, By Product, 2021

Figure 133: South Korea Market Value (US$ Mn) and Forecast, 2022 - 2032

Figure 134: South Korea Market Share, By Technology, 2021

Figure 135: South Korea Market Share, By End-user, 2021

Figure 136: South Korea Market Share, By Product, 2021

Figure 137: GCC Countries Market Value (US$ Mn) and Forecast, 2022 - 2032

Figure 138: GCC Countries Market Share, By Technology, 2021

Figure 139: GCC Countries Market Share, By End-user, 2021

Figure 140: GCC Countries Market Share, By Product, 2021

Figure 141: South Africa Market Value (US$ Mn) and Forecast, 2022 - 2032

Figure 142: South Africa Market Share, By Technology, 2021

Figure 143: South Africa Market Share, By End-user, 2021

Figure 144: South Africa Market Share, By Product, 2021

Figure 145: Turkey Market Value (US$ Mn) and Forecast, 2022 - 2032

Figure 146: Turkey Market Share, By Technology, 2021

Figure 147: Turkey Market Share, By End-user, 2021

Figure 148: Turkey Market Share, By Product, 2021

Frequently Asked Questions

What is the anticipated growth rate for the Clostridium Diagnostics Market during the projected period?

The global clostridium diagnostics market is expected to display a CAGR of 12.2% during the forecast period.

What is the projected valuation for Clostridium Diagnostics Market by 2032?

The clostridium diagnostics market is anticipated to secure a market value worth USD 7.8 Billion by 2032.

Who are the prominent Clostridium Diagnostics Market providers?

Abbott Laboratories, F. Hoffmann-LA ROCHE AG, and Siemens AG are some of the eminent players in the global clostridium diagnostics market

Which is the leading market for Clostridium Diagnostics?

The USA is projected to dominate the clostridium diagnostics market with a market value worth USD 2.7 Billion by 2032.

Which is the leading Technology of Clostridium Diagnostics Market products?

Immunoassays technology segment is projected to dominate the clostridium diagnostics market with a CAGR of 11.7% from 2022 to 2032

How big is the UK Clostridium Diagnostics Market?

The UK Clostridium Diagnostics market is anticipated to secure USD 330 Million by 2032

Explore Similar Insights

Future Market Insights

Clostridium Diagnostics Market